Cities with the Highest Percentage of Population with a Degree in Engineering in Missouri
RELATED REPORTS & OPTIONS
Engineering
Missouri
Compare Cities
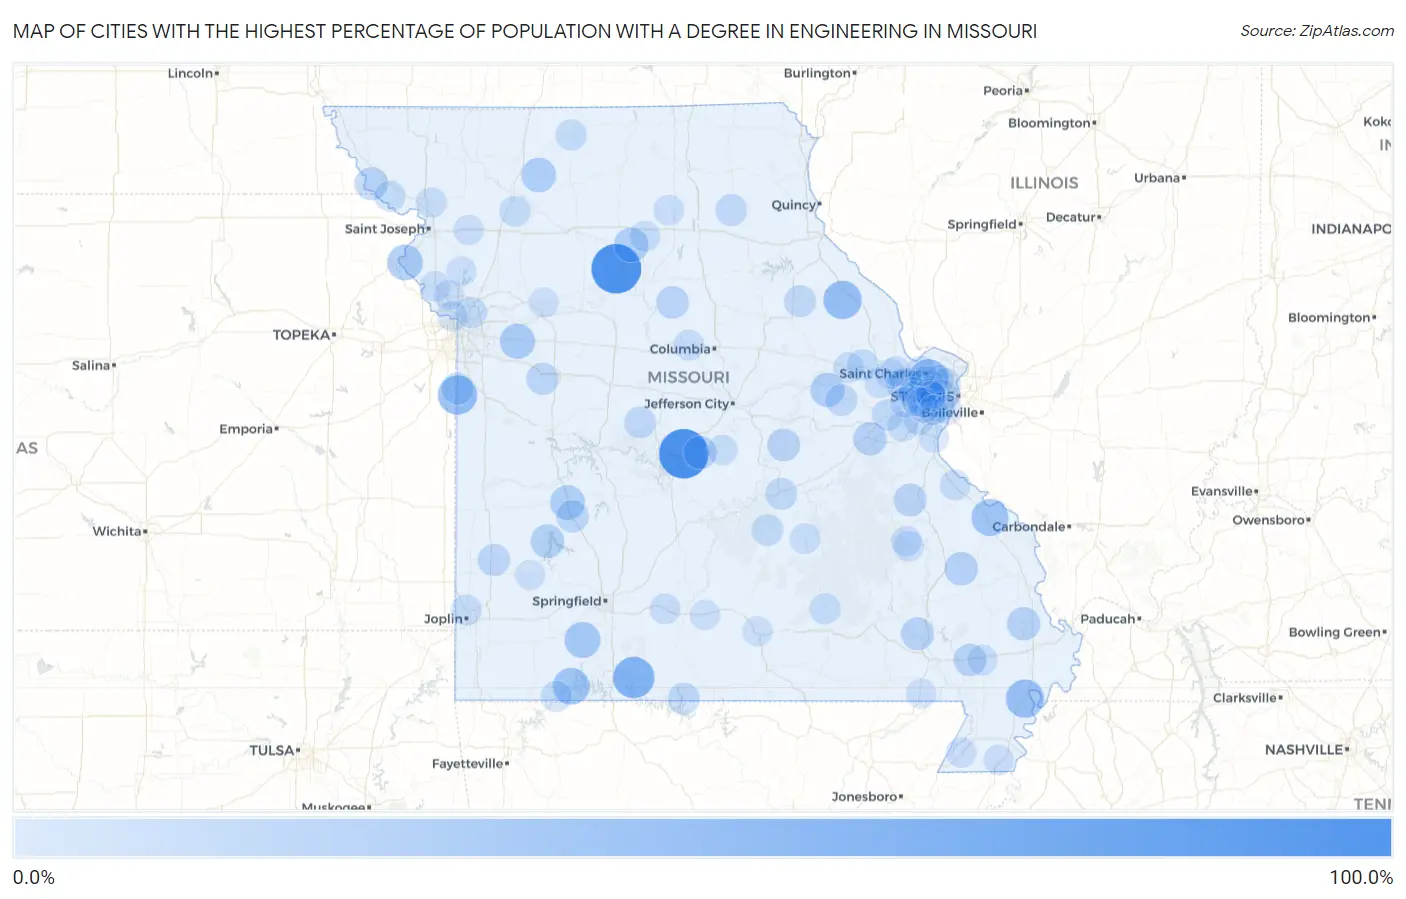
Map of Cities with the Highest Percentage of Population with a Degree in Engineering in Missouri
0.0%
100.0%
Cities with the Highest Percentage of Population with a Degree in Engineering in Missouri
| City | % Graduates | vs State | vs National | |
| 1. | Perkins | 100.0% | 5.6%(+94.4)#1 | 7.6%(+92.4)#23 |
| 2. | Bagnell | 100.0% | 5.6%(+94.4)#2 | 7.6%(+92.4)#46 |
| 3. | Triplett | 100.0% | 5.6%(+94.4)#3 | 7.6%(+92.4)#58 |
| 4. | Kissee Mills | 60.2% | 5.6%(+54.6)#4 | 7.6%(+52.6)#117 |
| 5. | Goose Creek Lake | 50.0% | 5.6%(+44.4)#5 | 7.6%(+42.4)#161 |
| 6. | West Line | 50.0% | 5.6%(+44.4)#6 | 7.6%(+42.4)#171 |
| 7. | Champ | 50.0% | 5.6%(+44.4)#7 | 7.6%(+42.4)#182 |
| 8. | St Clement | 46.2% | 5.6%(+40.6)#8 | 7.6%(+38.5)#209 |
| 9. | Marston | 45.5% | 5.6%(+39.9)#9 | 7.6%(+37.8)#211 |
| 10. | Brewer | 39.1% | 5.6%(+33.6)#10 | 7.6%(+31.5)#279 |
| 11. | Shell Knob | 38.6% | 5.6%(+33.0)#11 | 7.6%(+31.0)#286 |
| 12. | Hurley | 34.5% | 5.6%(+28.9)#12 | 7.6%(+26.8)#344 |
| 13. | Lewis And Clark Village | 33.3% | 5.6%(+27.8)#13 | 7.6%(+25.7)#372 |
| 14. | Bates City | 31.2% | 5.6%(+25.7)#14 | 7.6%(+23.6)#410 |
| 15. | Gilman City | 28.6% | 5.6%(+23.0)#15 | 7.6%(+20.9)#484 |
| 16. | Collins | 28.6% | 5.6%(+23.0)#16 | 7.6%(+20.9)#495 |
| 17. | Rothville | 28.6% | 5.6%(+23.0)#17 | 7.6%(+20.9)#497 |
| 18. | Berger | 26.9% | 5.6%(+21.4)#18 | 7.6%(+19.3)#562 |
| 19. | Umber View Heights | 25.0% | 5.6%(+19.4)#19 | 7.6%(+17.4)#678 |
| 20. | Marquand | 23.1% | 5.6%(+17.5)#20 | 7.6%(+15.4)#777 |
| 21. | Parkway | 23.0% | 5.6%(+17.4)#21 | 7.6%(+15.3)#782 |
| 22. | Morley | 22.9% | 5.6%(+17.3)#22 | 7.6%(+15.2)#784 |
| 23. | Tuscumbia | 22.2% | 5.6%(+16.7)#23 | 7.6%(+14.6)#841 |
| 24. | Williamsville | 21.4% | 5.6%(+15.9)#24 | 7.6%(+13.8)#893 |
| 25. | Big Lake | 21.4% | 5.6%(+15.9)#25 | 7.6%(+13.8)#903 |
| 26. | Terre Du Lac | 20.9% | 5.6%(+15.3)#26 | 7.6%(+13.2)#960 |
| 27. | Belle | 20.3% | 5.6%(+14.8)#27 | 7.6%(+12.7)#1,008 |
| 28. | Armstrong | 20.0% | 5.6%(+14.4)#28 | 7.6%(+12.4)#1,043 |
| 29. | Dudley | 20.0% | 5.6%(+14.4)#29 | 7.6%(+12.4)#1,064 |
| 30. | Humansville | 19.1% | 5.6%(+13.5)#30 | 7.6%(+11.5)#1,149 |
| 31. | Maryland Heights | 18.2% | 5.6%(+12.6)#31 | 7.6%(+10.5)#1,251 |
| 32. | Lamar | 18.1% | 5.6%(+12.5)#32 | 7.6%(+10.4)#1,290 |
| 33. | Centerview | 17.6% | 5.6%(+12.1)#33 | 7.6%(+10.00)#1,334 |
| 34. | Cleveland | 17.5% | 5.6%(+11.9)#34 | 7.6%(+9.83)#1,358 |
| 35. | Farber | 16.7% | 5.6%(+11.1)#35 | 7.6%(+9.02)#1,513 |
| 36. | Pontiac | 16.7% | 5.6%(+11.1)#36 | 7.6%(+9.02)#1,532 |
| 37. | Rolla | 16.3% | 5.6%(+10.7)#37 | 7.6%(+8.63)#1,603 |
| 38. | Weldon Spring Heights | 15.7% | 5.6%(+10.1)#38 | 7.6%(+8.04)#1,739 |
| 39. | Stover | 15.5% | 5.6%(+9.96)#39 | 7.6%(+7.89)#1,764 |
| 40. | Leonard | 15.4% | 5.6%(+9.81)#40 | 7.6%(+7.74)#1,799 |
| 41. | New Haven | 15.3% | 5.6%(+9.68)#41 | 7.6%(+7.60)#1,817 |
| 42. | Edgar Springs | 14.3% | 5.6%(+8.71)#42 | 7.6%(+6.64)#2,057 |
| 43. | Claycomo | 14.2% | 5.6%(+8.64)#43 | 7.6%(+6.56)#2,089 |
| 44. | Gray Summit | 14.1% | 5.6%(+8.55)#44 | 7.6%(+6.47)#2,110 |
| 45. | Weldon Spring | 13.9% | 5.6%(+8.30)#45 | 7.6%(+6.22)#2,194 |
| 46. | Wright City | 13.8% | 5.6%(+8.23)#46 | 7.6%(+6.16)#2,209 |
| 47. | Bellerive Acres | 13.3% | 5.6%(+7.76)#47 | 7.6%(+5.69)#2,366 |
| 48. | New Hamburg | 13.0% | 5.6%(+7.47)#48 | 7.6%(+5.40)#2,483 |
| 49. | Eminence | 12.7% | 5.6%(+7.16)#49 | 7.6%(+5.08)#2,588 |
| 50. | Princeton | 12.7% | 5.6%(+7.08)#50 | 7.6%(+5.00)#2,619 |
| 51. | Chain O Lakes | 12.5% | 5.6%(+6.93)#51 | 7.6%(+4.85)#2,691 |
| 52. | Forest City | 12.5% | 5.6%(+6.93)#52 | 7.6%(+4.85)#2,692 |
| 53. | Altamont | 12.5% | 5.6%(+6.93)#53 | 7.6%(+4.85)#2,697 |
| 54. | Airport Drive | 12.1% | 5.6%(+6.57)#54 | 7.6%(+4.49)#2,835 |
| 55. | Labarque Creek | 12.1% | 5.6%(+6.49)#55 | 7.6%(+4.41)#2,867 |
| 56. | Chesterfield | 11.9% | 5.6%(+6.37)#56 | 7.6%(+4.29)#2,916 |
| 57. | Fenton | 11.9% | 5.6%(+6.33)#57 | 7.6%(+4.25)#2,936 |
| 58. | New Melle | 11.7% | 5.6%(+6.11)#58 | 7.6%(+4.03)#3,047 |
| 59. | Marceline | 11.6% | 5.6%(+6.07)#59 | 7.6%(+3.99)#3,057 |
| 60. | Rocheport | 11.6% | 5.6%(+6.02)#60 | 7.6%(+3.95)#3,077 |
| 61. | Seymour | 11.3% | 5.6%(+5.77)#61 | 7.6%(+3.69)#3,202 |
| 62. | Warrenton | 11.2% | 5.6%(+5.65)#62 | 7.6%(+3.57)#3,261 |
| 63. | Salem | 11.1% | 5.6%(+5.54)#63 | 7.6%(+3.46)#3,316 |
| 64. | Savannah | 10.9% | 5.6%(+5.35)#64 | 7.6%(+3.27)#3,452 |
| 65. | Richmond Heights | 10.9% | 5.6%(+5.30)#65 | 7.6%(+3.22)#3,477 |
| 66. | Bloomsdale | 10.7% | 5.6%(+5.14)#66 | 7.6%(+3.07)#3,577 |
| 67. | Clarkson Valley | 10.6% | 5.6%(+5.06)#67 | 7.6%(+2.98)#3,629 |
| 68. | Arcadia | 10.6% | 5.6%(+5.02)#68 | 7.6%(+2.94)#3,654 |
| 69. | Tracy | 10.5% | 5.6%(+4.95)#69 | 7.6%(+2.88)#3,708 |
| 70. | St Elizabeth | 10.4% | 5.6%(+4.81)#70 | 7.6%(+2.73)#3,810 |
| 71. | Pilot Knob | 10.2% | 5.6%(+4.63)#71 | 7.6%(+2.56)#3,930 |
| 72. | High Ridge | 10.2% | 5.6%(+4.61)#72 | 7.6%(+2.54)#3,949 |
| 73. | Ethel | 10.0% | 5.6%(+4.43)#73 | 7.6%(+2.35)#4,103 |
| 74. | Valley Park | 9.9% | 5.6%(+4.36)#74 | 7.6%(+2.29)#4,140 |
| 75. | Stewartsville | 9.9% | 5.6%(+4.30)#75 | 7.6%(+2.23)#4,188 |
| 76. | Senath | 9.8% | 5.6%(+4.21)#76 | 7.6%(+2.14)#4,264 |
| 77. | Riverside | 9.7% | 5.6%(+4.15)#77 | 7.6%(+2.08)#4,300 |
| 78. | Wildwood | 9.7% | 5.6%(+4.08)#78 | 7.6%(+2.01)#4,349 |
| 79. | Ferrelview | 9.6% | 5.6%(+4.04)#79 | 7.6%(+1.97)#4,375 |
| 80. | Dexter | 9.6% | 5.6%(+4.02)#80 | 7.6%(+1.95)#4,393 |
| 81. | Creve Coeur | 9.6% | 5.6%(+3.99)#81 | 7.6%(+1.91)#4,421 |
| 82. | Ballwin | 9.5% | 5.6%(+3.93)#82 | 7.6%(+1.85)#4,478 |
| 83. | Steele | 9.4% | 5.6%(+3.86)#83 | 7.6%(+1.79)#4,519 |
| 84. | Edmundson | 9.2% | 5.6%(+3.59)#84 | 7.6%(+1.52)#4,744 |
| 85. | Norwood | 9.1% | 5.6%(+3.52)#85 | 7.6%(+1.44)#4,799 |
| 86. | Neelyville | 9.1% | 5.6%(+3.52)#86 | 7.6%(+1.44)#4,813 |
| 87. | Lake St Louis | 9.1% | 5.6%(+3.50)#87 | 7.6%(+1.43)#4,835 |
| 88. | Barnhart | 9.1% | 5.6%(+3.48)#88 | 7.6%(+1.40)#4,857 |
| 89. | Westwood | 8.9% | 5.6%(+3.29)#89 | 7.6%(+1.22)#5,051 |
| 90. | Grantwood Village | 8.7% | 5.6%(+3.16)#90 | 7.6%(+1.08)#5,175 |
| 91. | St Charles | 8.7% | 5.6%(+3.09)#91 | 7.6%(+1.01)#5,248 |
| 92. | Manchester | 8.6% | 5.6%(+3.03)#92 | 7.6%(+0.954)#5,303 |
| 93. | O Fallon | 8.6% | 5.6%(+3.02)#93 | 7.6%(+0.940)#5,317 |
| 94. | Hardin | 8.6% | 5.6%(+3.00)#94 | 7.6%(+0.924)#5,331 |
| 95. | Lemay | 8.5% | 5.6%(+2.94)#95 | 7.6%(+0.863)#5,379 |
| 96. | Willow Springs | 8.5% | 5.6%(+2.94)#96 | 7.6%(+0.863)#5,381 |
| 97. | Trimble | 8.5% | 5.6%(+2.90)#97 | 7.6%(+0.827)#5,429 |
| 98. | Sunset Hills | 8.5% | 5.6%(+2.89)#98 | 7.6%(+0.811)#5,440 |
| 99. | Crystal Lake Park | 8.4% | 5.6%(+2.79)#99 | 7.6%(+0.711)#5,524 |
| 100. | Lockwood | 8.3% | 5.6%(+2.76)#100 | 7.6%(+0.686)#5,555 |
Common Questions
What are the Top 10 Cities with the Highest Percentage of Population with a Degree in Engineering in Missouri?
Top 10 Cities with the Highest Percentage of Population with a Degree in Engineering in Missouri are:
#1
100.0%
#2
100.0%
#3
60.2%
#4
50.0%
#5
50.0%
#6
46.2%
#7
45.5%
#8
39.1%
#9
38.6%
#10
34.5%
What city has the Highest Percentage of Population with a Degree in Engineering in Missouri?
Bagnell has the Highest Percentage of Population with a Degree in Engineering in Missouri with 100.0%.
What is the Percentage of Population with a Degree in Engineering in the State of Missouri?
Percentage of Population with a Degree in Engineering in Missouri is 5.6%.
What is the Percentage of Population with a Degree in Engineering in the United States?
Percentage of Population with a Degree in Engineering in the United States is 7.6%.