Cities with the Highest Percentage of Population with a Degree in Engineering in Illinois
RELATED REPORTS & OPTIONS
Engineering
Illinois
Compare Cities
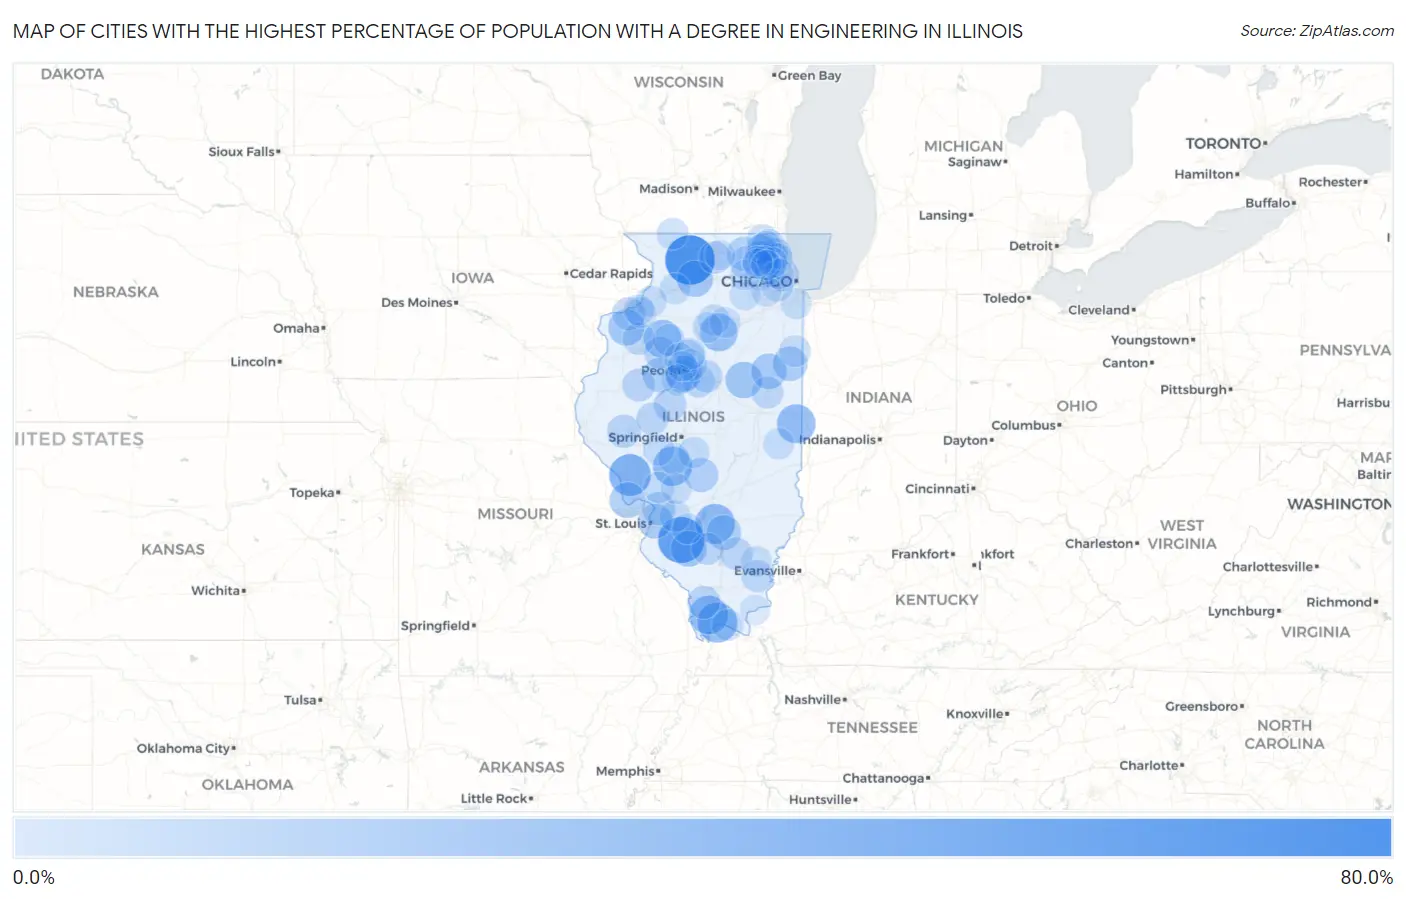
Map of Cities with the Highest Percentage of Population with a Degree in Engineering in Illinois
0.0%
80.0%
Cities with the Highest Percentage of Population with a Degree in Engineering in Illinois
| City | % Graduates | vs State | vs National | |
| 1. | Adeline | 66.7% | 7.1%(+59.6)#1 | 7.6%(+59.0)#94 |
| 2. | Venedy | 57.1% | 7.1%(+50.1)#2 | 7.6%(+49.5)#134 |
| 3. | Eldred | 44.4% | 7.1%(+37.4)#3 | 7.6%(+36.8)#216 |
| 4. | Odin | 39.3% | 7.1%(+32.2)#4 | 7.6%(+31.6)#278 |
| 5. | Burtons Bridge | 39.1% | 7.1%(+32.1)#5 | 7.6%(+31.5)#280 |
| 6. | New Grand Chain | 38.9% | 7.1%(+31.8)#6 | 7.6%(+31.2)#283 |
| 7. | Nilwood | 37.5% | 7.1%(+30.4)#7 | 7.6%(+29.9)#298 |
| 8. | Campbell's Island | 37.3% | 7.1%(+30.2)#8 | 7.6%(+29.6)#303 |
| 9. | Dongola | 36.6% | 7.1%(+29.5)#9 | 7.6%(+28.9)#312 |
| 10. | Georgetown | 36.1% | 7.1%(+29.1)#10 | 7.6%(+28.5)#321 |
| 11. | La Fayette | 33.3% | 7.1%(+26.3)#11 | 7.6%(+25.7)#365 |
| 12. | Leonore | 33.3% | 7.1%(+26.3)#12 | 7.6%(+25.7)#366 |
| 13. | Anchor | 30.0% | 7.1%(+22.9)#13 | 7.6%(+22.4)#445 |
| 14. | Grand Detour | 29.4% | 7.1%(+22.3)#14 | 7.6%(+21.7)#464 |
| 15. | Matherville | 28.9% | 7.1%(+21.8)#15 | 7.6%(+21.2)#477 |
| 16. | Oakdale | 28.6% | 7.1%(+21.5)#16 | 7.6%(+20.9)#487 |
| 17. | Brussels | 27.8% | 7.1%(+20.7)#17 | 7.6%(+20.1)#530 |
| 18. | Creve Coeur | 27.3% | 7.1%(+20.2)#18 | 7.6%(+19.6)#546 |
| 19. | Thawville | 27.3% | 7.1%(+20.2)#19 | 7.6%(+19.6)#548 |
| 20. | Ridgewood | 26.5% | 7.1%(+19.5)#20 | 7.6%(+18.9)#577 |
| 21. | Watseka | 25.1% | 7.1%(+18.0)#21 | 7.6%(+17.4)#637 |
| 22. | Fairmont City | 25.0% | 7.1%(+17.9)#22 | 7.6%(+17.4)#640 |
| 23. | Norris | 25.0% | 7.1%(+17.9)#23 | 7.6%(+17.4)#654 |
| 24. | Kell | 25.0% | 7.1%(+17.9)#24 | 7.6%(+17.4)#660 |
| 25. | Sunnyland | 24.4% | 7.1%(+17.4)#25 | 7.6%(+16.8)#698 |
| 26. | Coalton | 23.3% | 7.1%(+16.3)#26 | 7.6%(+15.7)#760 |
| 27. | Holcomb | 23.1% | 7.1%(+16.0)#27 | 7.6%(+15.4)#776 |
| 28. | Union | 22.9% | 7.1%(+15.8)#28 | 7.6%(+15.2)#785 |
| 29. | Roxana | 21.5% | 7.1%(+14.4)#29 | 7.6%(+13.8)#887 |
| 30. | Versailles | 21.1% | 7.1%(+14.0)#30 | 7.6%(+13.4)#936 |
| 31. | Milan | 21.0% | 7.1%(+13.9)#31 | 7.6%(+13.3)#954 |
| 32. | North Pekin | 20.8% | 7.1%(+13.7)#32 | 7.6%(+13.1)#972 |
| 33. | Schiller Park | 20.4% | 7.1%(+13.4)#33 | 7.6%(+12.8)#1,002 |
| 34. | Cobden | 20.2% | 7.1%(+13.2)#34 | 7.6%(+12.6)#1,014 |
| 35. | Easton | 20.0% | 7.1%(+12.9)#35 | 7.6%(+12.4)#1,044 |
| 36. | Marietta | 20.0% | 7.1%(+12.9)#36 | 7.6%(+12.4)#1,065 |
| 37. | Hampshire | 20.0% | 7.1%(+12.9)#37 | 7.6%(+12.3)#1,075 |
| 38. | Dahlgren | 19.5% | 7.1%(+12.5)#38 | 7.6%(+11.9)#1,109 |
| 39. | Chandlerville | 19.0% | 7.1%(+12.0)#39 | 7.6%(+11.4)#1,154 |
| 40. | Heritage Lake | 18.9% | 7.1%(+11.8)#40 | 7.6%(+11.2)#1,174 |
| 41. | Congerville | 18.7% | 7.1%(+11.6)#41 | 7.6%(+11.0)#1,204 |
| 42. | New Milford | 18.3% | 7.1%(+11.2)#42 | 7.6%(+10.6)#1,241 |
| 43. | Ludlow | 18.2% | 7.1%(+11.1)#43 | 7.6%(+10.5)#1,261 |
| 44. | Omaha | 18.2% | 7.1%(+11.1)#44 | 7.6%(+10.5)#1,265 |
| 45. | Rio | 18.2% | 7.1%(+11.1)#45 | 7.6%(+10.5)#1,269 |
| 46. | Radom | 18.2% | 7.1%(+11.1)#46 | 7.6%(+10.5)#1,273 |
| 47. | Williamsfield | 17.9% | 7.1%(+10.8)#47 | 7.6%(+10.2)#1,306 |
| 48. | Hawthorn Woods | 17.4% | 7.1%(+10.3)#48 | 7.6%(+9.71)#1,384 |
| 49. | Toulon | 17.3% | 7.1%(+10.2)#49 | 7.6%(+9.65)#1,398 |
| 50. | Rome | 17.1% | 7.1%(+10.0)#50 | 7.6%(+9.43)#1,431 |
| 51. | Argyle | 16.9% | 7.1%(+9.88)#51 | 7.6%(+9.29)#1,460 |
| 52. | Pistakee Highlands | 16.8% | 7.1%(+9.75)#52 | 7.6%(+9.16)#1,474 |
| 53. | Germantown Hills | 16.8% | 7.1%(+9.73)#53 | 7.6%(+9.13)#1,480 |
| 54. | Beaverville | 16.7% | 7.1%(+9.61)#54 | 7.6%(+9.02)#1,514 |
| 55. | Joppa | 16.7% | 7.1%(+9.61)#55 | 7.6%(+9.02)#1,516 |
| 56. | Winslow | 16.7% | 7.1%(+9.61)#56 | 7.6%(+9.02)#1,518 |
| 57. | Dunlap | 16.6% | 7.1%(+9.52)#57 | 7.6%(+8.92)#1,549 |
| 58. | Round Lake | 16.4% | 7.1%(+9.39)#58 | 7.6%(+8.80)#1,576 |
| 59. | Shipman | 16.3% | 7.1%(+9.23)#59 | 7.6%(+8.63)#1,605 |
| 60. | Kildeer | 16.2% | 7.1%(+9.15)#60 | 7.6%(+8.56)#1,620 |
| 61. | Lasalle | 16.1% | 7.1%(+9.07)#61 | 7.6%(+8.48)#1,629 |
| 62. | St Jacob | 16.1% | 7.1%(+9.04)#62 | 7.6%(+8.44)#1,639 |
| 63. | Kincaid | 16.0% | 7.1%(+8.95)#63 | 7.6%(+8.35)#1,647 |
| 64. | Indian Creek | 15.9% | 7.1%(+8.86)#64 | 7.6%(+8.26)#1,676 |
| 65. | Virden | 15.8% | 7.1%(+8.80)#65 | 7.6%(+8.20)#1,688 |
| 66. | Chillicothe | 15.8% | 7.1%(+8.79)#66 | 7.6%(+8.19)#1,689 |
| 67. | Franklin | 15.7% | 7.1%(+8.66)#67 | 7.6%(+8.07)#1,726 |
| 68. | Como | 15.7% | 7.1%(+8.66)#68 | 7.6%(+8.07)#1,727 |
| 69. | Trout Valley | 15.7% | 7.1%(+8.65)#69 | 7.6%(+8.05)#1,733 |
| 70. | Mapleton | 15.6% | 7.1%(+8.50)#70 | 7.6%(+7.91)#1,755 |
| 71. | Hoffman Estates | 15.4% | 7.1%(+8.36)#71 | 7.6%(+7.77)#1,780 |
| 72. | Hillsdale | 15.4% | 7.1%(+8.33)#72 | 7.6%(+7.74)#1,788 |
| 73. | Brocton | 15.4% | 7.1%(+8.33)#73 | 7.6%(+7.74)#1,793 |
| 74. | Buffalo Grove | 15.3% | 7.1%(+8.23)#74 | 7.6%(+7.63)#1,810 |
| 75. | Wayne | 15.3% | 7.1%(+8.21)#75 | 7.6%(+7.61)#1,815 |
| 76. | Thornton | 15.1% | 7.1%(+8.04)#76 | 7.6%(+7.44)#1,854 |
| 77. | Naplate | 15.0% | 7.1%(+7.95)#77 | 7.6%(+7.35)#1,874 |
| 78. | Prairie Grove | 14.9% | 7.1%(+7.87)#78 | 7.6%(+7.27)#1,890 |
| 79. | Clarendon Hills | 14.7% | 7.1%(+7.69)#79 | 7.6%(+7.09)#1,924 |
| 80. | Plano | 14.7% | 7.1%(+7.61)#80 | 7.6%(+7.01)#1,948 |
| 81. | Schaumburg | 14.5% | 7.1%(+7.49)#81 | 7.6%(+6.90)#1,968 |
| 82. | Germantown | 14.4% | 7.1%(+7.38)#82 | 7.6%(+6.79)#1,988 |
| 83. | Colona | 14.3% | 7.1%(+7.27)#83 | 7.6%(+6.68)#2,015 |
| 84. | Carbon Cliff | 14.3% | 7.1%(+7.23)#84 | 7.6%(+6.64)#2,020 |
| 85. | Holiday Hills | 14.3% | 7.1%(+7.23)#85 | 7.6%(+6.64)#2,028 |
| 86. | Enfield | 14.3% | 7.1%(+7.23)#86 | 7.6%(+6.64)#2,033 |
| 87. | Lake Ka Ho | 14.3% | 7.1%(+7.23)#87 | 7.6%(+6.64)#2,045 |
| 88. | Naperville | 14.0% | 7.1%(+6.94)#88 | 7.6%(+6.35)#2,147 |
| 89. | Standard | 13.9% | 7.1%(+6.84)#89 | 7.6%(+6.24)#2,187 |
| 90. | Virgil | 13.6% | 7.1%(+6.58)#90 | 7.6%(+5.99)#2,261 |
| 91. | Volo | 13.6% | 7.1%(+6.51)#91 | 7.6%(+5.92)#2,284 |
| 92. | Barrington Hills | 13.5% | 7.1%(+6.49)#92 | 7.6%(+5.89)#2,292 |
| 93. | Bensenville | 13.5% | 7.1%(+6.42)#93 | 7.6%(+5.83)#2,315 |
| 94. | Cherry Valley | 13.2% | 7.1%(+6.18)#94 | 7.6%(+5.59)#2,406 |
| 95. | Palatine | 13.1% | 7.1%(+6.08)#95 | 7.6%(+5.49)#2,435 |
| 96. | Carpentersville | 13.1% | 7.1%(+6.00)#96 | 7.6%(+5.41)#2,463 |
| 97. | Rosiclare | 13.0% | 7.1%(+5.93)#97 | 7.6%(+5.34)#2,499 |
| 98. | Peoria | 12.9% | 7.1%(+5.84)#98 | 7.6%(+5.24)#2,534 |
| 99. | Sleepy Hollow | 12.9% | 7.1%(+5.80)#99 | 7.6%(+5.20)#2,548 |
| 100. | South Barrington | 12.8% | 7.1%(+5.79)#100 | 7.6%(+5.19)#2,550 |
Common Questions
What are the Top 10 Cities with the Highest Percentage of Population with a Degree in Engineering in Illinois?
Top 10 Cities with the Highest Percentage of Population with a Degree in Engineering in Illinois are:
#1
66.7%
#2
57.1%
#3
44.4%
#4
39.3%
#5
38.9%
#6
37.5%
#7
36.6%
#8
36.1%
#9
33.3%
#10
33.3%
What city has the Highest Percentage of Population with a Degree in Engineering in Illinois?
Adeline has the Highest Percentage of Population with a Degree in Engineering in Illinois with 66.7%.
What is the Percentage of Population with a Degree in Engineering in the State of Illinois?
Percentage of Population with a Degree in Engineering in Illinois is 7.1%.
What is the Percentage of Population with a Degree in Engineering in the United States?
Percentage of Population with a Degree in Engineering in the United States is 7.6%.