Lockeford, CA Map & Demographics
Lockeford Map
Lockeford Overview
$48,432
PER CAPITA INCOME
$112,589
AVG FAMILY INCOME
$106,087
AVG HOUSEHOLD INCOME
6.9%
WAGE / INCOME GAP [ % ]
93.1¢/ $1
WAGE / INCOME GAP [ $ ]
0.46
INEQUALITY / GINI INDEX
4,126
TOTAL POPULATION
2,274
MALE POPULATION
1,852
FEMALE POPULATION
122.79
MALES / 100 FEMALES
81.44
FEMALES / 100 MALES
42.1
MEDIAN AGE
3.2
AVG FAMILY SIZE
2.7
AVG HOUSEHOLD SIZE
1,943
LABOR FORCE [ PEOPLE ]
60.0%
PERCENT IN LABOR FORCE
6.3%
UNEMPLOYMENT RATE
Lockeford Zip Codes
Lockeford Area Codes
Income in Lockeford
Income Overview in Lockeford
Per Capita Income in Lockeford is $48,432, while median incomes of families and households are $112,589 and $106,087 respectively.
| Characteristic | Number | Measure |
| Per Capita Income | 4,126 | $48,432 |
| Median Family Income | 1,060 | $112,589 |
| Mean Family Income | 1,060 | $118,237 |
| Median Household Income | 1,506 | $106,087 |
| Mean Household Income | 1,506 | $129,518 |
| Income Deficit | 1,060 | $0 |
| Wage / Income Gap (%) | 4,126 | 6.89% |
| Wage / Income Gap ($) | 4,126 | 93.11¢ per $1 |
| Gini / Inequality Index | 4,126 | 0.46 |
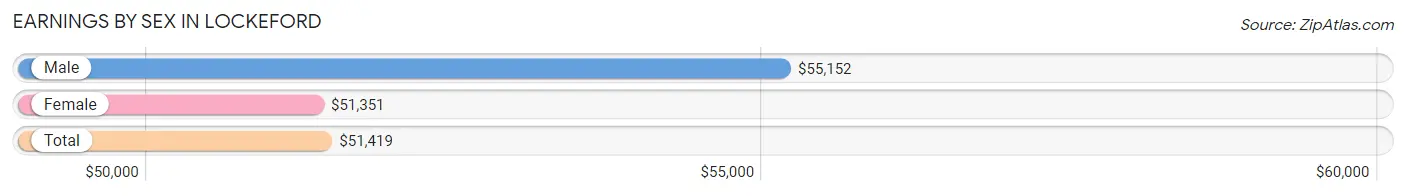
Earnings by Sex in Lockeford
Average Earnings in Lockeford are $51,419, $55,152 for men and $51,351 for women, a difference of 6.9%.
| Sex | Number | Average Earnings |
| Male | 1,116 (59.0%) | $55,152 |
| Female | 776 (41.0%) | $51,351 |
| Total | 1,892 (100.0%) | $51,419 |
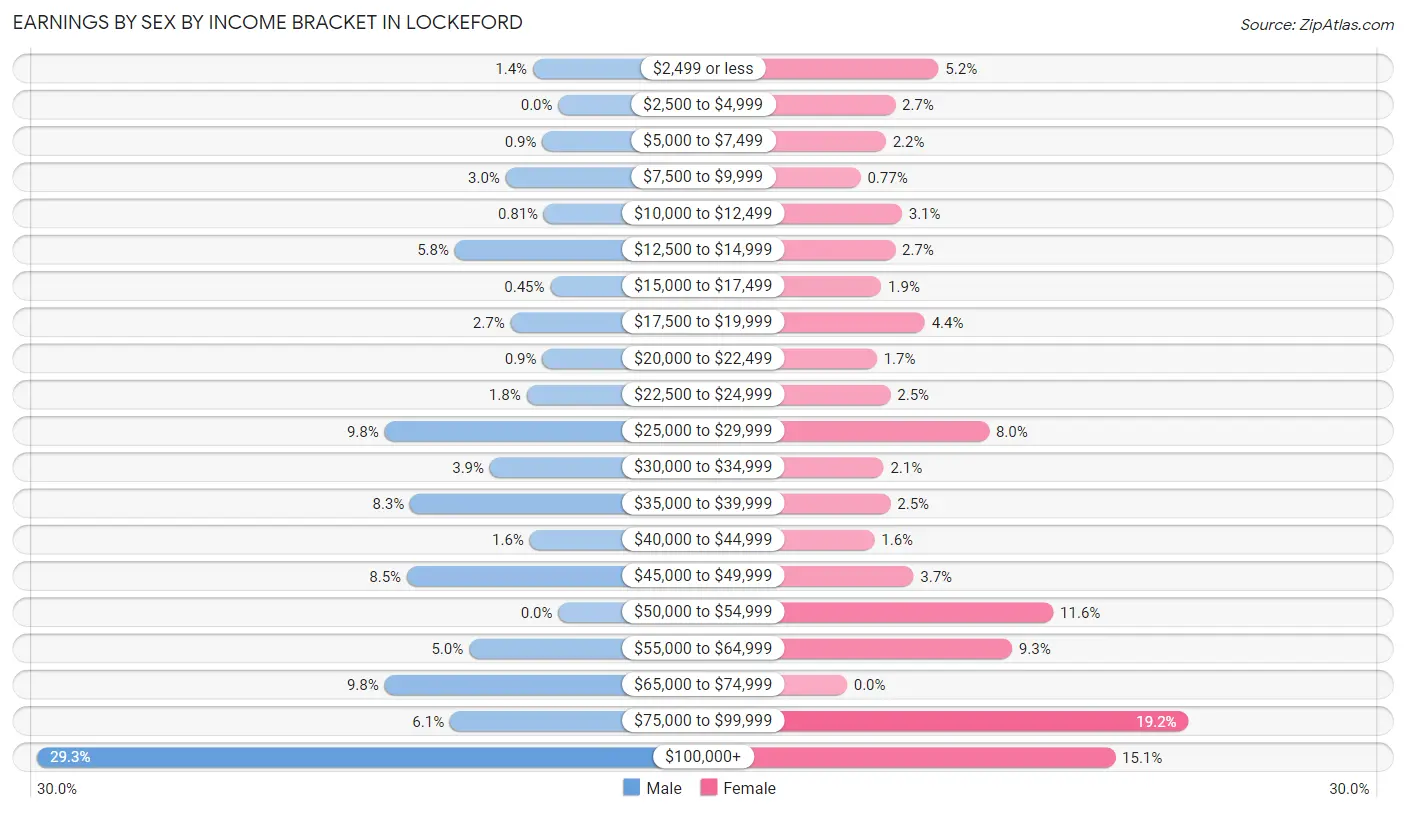
Earnings by Sex by Income Bracket in Lockeford
The most common earnings brackets in Lockeford are $100,000+ for men (327 | 29.3%) and $75,000 to $99,999 for women (149 | 19.2%).
| Income | Male | Female |
| $2,499 or less | 16 (1.4%) | 40 (5.1%) |
| $2,500 to $4,999 | 0 (0.0%) | 21 (2.7%) |
| $5,000 to $7,499 | 10 (0.9%) | 17 (2.2%) |
| $7,500 to $9,999 | 33 (3.0%) | 6 (0.8%) |
| $10,000 to $12,499 | 9 (0.8%) | 24 (3.1%) |
| $12,500 to $14,999 | 65 (5.8%) | 21 (2.7%) |
| $15,000 to $17,499 | 5 (0.4%) | 15 (1.9%) |
| $17,500 to $19,999 | 30 (2.7%) | 34 (4.4%) |
| $20,000 to $22,499 | 10 (0.9%) | 13 (1.7%) |
| $22,500 to $24,999 | 20 (1.8%) | 19 (2.5%) |
| $25,000 to $29,999 | 109 (9.8%) | 62 (8.0%) |
| $30,000 to $34,999 | 43 (3.8%) | 16 (2.1%) |
| $35,000 to $39,999 | 93 (8.3%) | 19 (2.5%) |
| $40,000 to $44,999 | 18 (1.6%) | 12 (1.5%) |
| $45,000 to $49,999 | 95 (8.5%) | 29 (3.7%) |
| $50,000 to $54,999 | 0 (0.0%) | 90 (11.6%) |
| $55,000 to $64,999 | 56 (5.0%) | 72 (9.3%) |
| $65,000 to $74,999 | 109 (9.8%) | 0 (0.0%) |
| $75,000 to $99,999 | 68 (6.1%) | 149 (19.2%) |
| $100,000+ | 327 (29.3%) | 117 (15.1%) |
| Total | 1,116 (100.0%) | 776 (100.0%) |
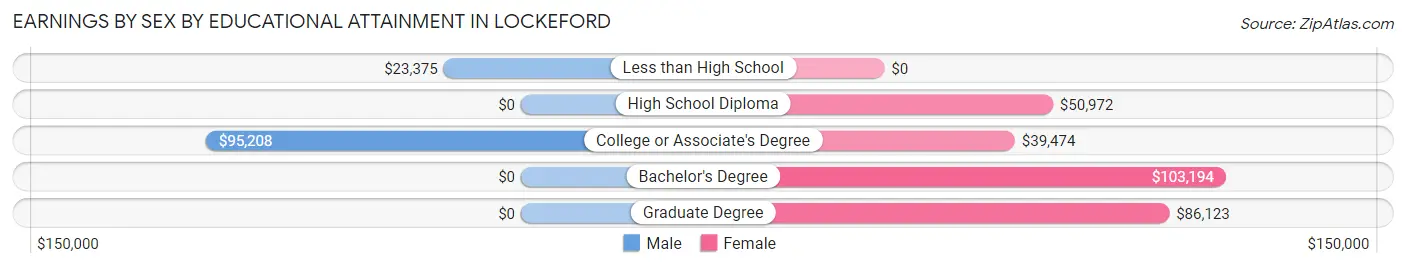
Earnings by Sex by Educational Attainment in Lockeford
Average earnings in Lockeford are $65,417 for men and $51,791 for women, a difference of 20.8%. Men with an educational attainment of college or associate's degree enjoy the highest average annual earnings of $95,208, while those with less than high school education earn the least with $23,375. Women with an educational attainment of bachelor's degree earn the most with the average annual earnings of $103,194, while those with college or associate's degree education have the smallest earnings of $39,474.
| Educational Attainment | Male Income | Female Income |
| Less than High School | $23,375 | $0 |
| High School Diploma | - | - |
| College or Associate's Degree | $95,208 | $39,474 |
| Bachelor's Degree | - | - |
| Graduate Degree | - | - |
| Total | $65,417 | $51,791 |
Family Income in Lockeford
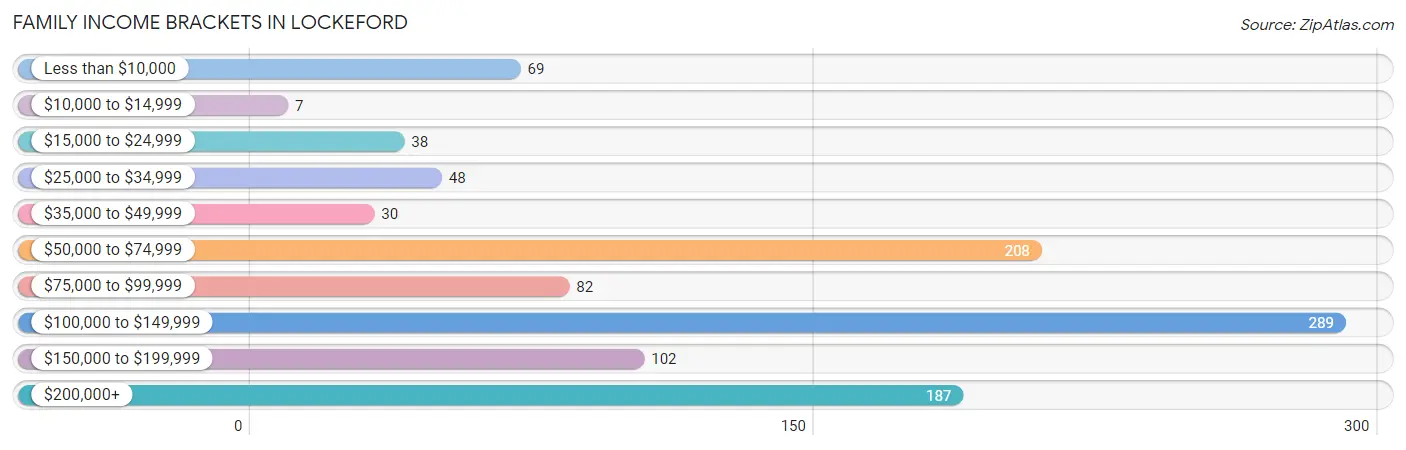
Family Income Brackets in Lockeford
According to the Lockeford family income data, there are 289 families falling into the $100,000 to $149,999 income range, which is the most common income bracket and makes up 27.3% of all families. Conversely, the $10,000 to $14,999 income bracket is the least frequent group with only 7 families (0.7%) belonging to this category.
| Income Bracket | # Families | % Families |
| Less than $10,000 | 69 | 6.5% |
| $10,000 to $14,999 | 7 | 0.7% |
| $15,000 to $24,999 | 38 | 3.6% |
| $25,000 to $34,999 | 48 | 4.5% |
| $35,000 to $49,999 | 30 | 2.8% |
| $50,000 to $74,999 | 208 | 19.6% |
| $75,000 to $99,999 | 82 | 7.7% |
| $100,000 to $149,999 | 289 | 27.3% |
| $150,000 to $199,999 | 102 | 9.6% |
| $200,000+ | 187 | 17.6% |
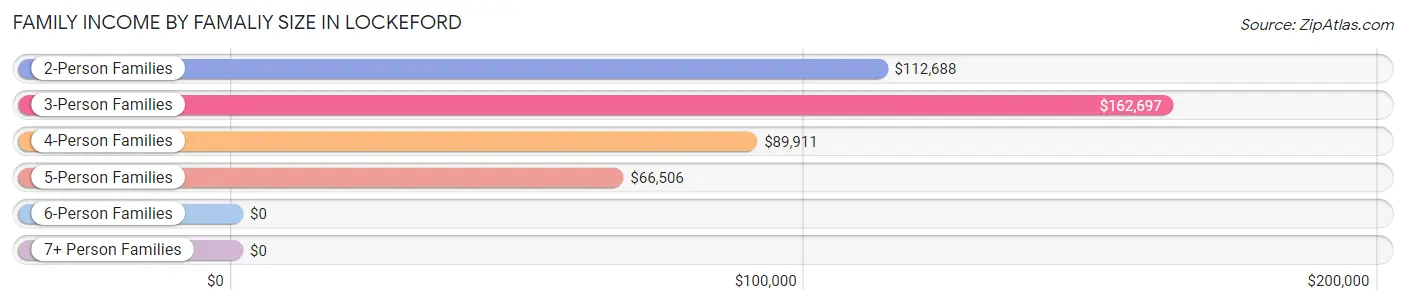
Family Income by Famaliy Size in Lockeford
3-person families (181 | 17.1%) account for the highest median family income in Lockeford with $162,697 per family, while 2-person families (528 | 49.8%) have the highest median income of $56,344 per family member.
| Income Bracket | # Families | Median Income |
| 2-Person Families | 528 (49.8%) | $112,688 |
| 3-Person Families | 181 (17.1%) | $162,697 |
| 4-Person Families | 181 (17.1%) | $89,911 |
| 5-Person Families | 117 (11.0%) | $66,506 |
| 6-Person Families | 34 (3.2%) | $0 |
| 7+ Person Families | 19 (1.8%) | $0 |
| Total | 1,060 (100.0%) | $112,589 |
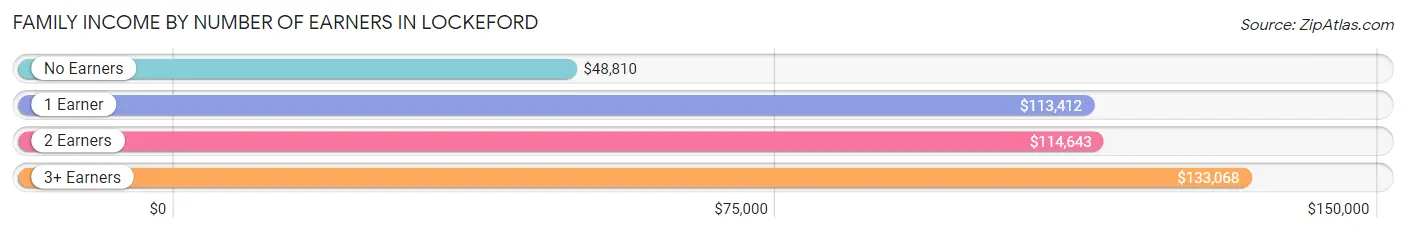
Family Income by Number of Earners in Lockeford
The median family income in Lockeford is $112,589, with families comprising 3+ earners (87) having the highest median family income of $133,068, while families with no earners (260) have the lowest median family income of $48,810, accounting for 8.2% and 24.5% of families, respectively.
| Number of Earners | # Families | Median Income |
| No Earners | 260 (24.5%) | $48,810 |
| 1 Earner | 341 (32.2%) | $113,412 |
| 2 Earners | 372 (35.1%) | $114,643 |
| 3+ Earners | 87 (8.2%) | $133,068 |
| Total | 1,060 (100.0%) | $112,589 |
Household Income in Lockeford
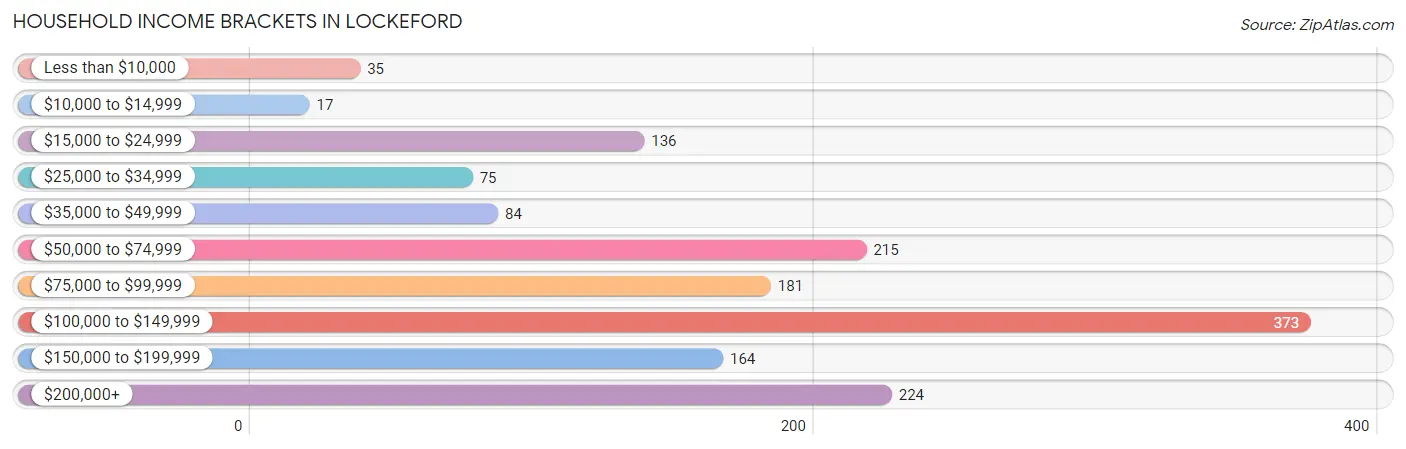
Household Income Brackets in Lockeford
With 373 households falling in the category, the $100,000 to $149,999 income range is the most frequent in Lockeford, accounting for 24.8% of all households. In contrast, only 17 households (1.1%) fall into the $10,000 to $14,999 income bracket, making it the least populous group.
| Income Bracket | # Households | % Households |
| Less than $10,000 | 35 | 2.3% |
| $10,000 to $14,999 | 17 | 1.1% |
| $15,000 to $24,999 | 136 | 9.0% |
| $25,000 to $34,999 | 75 | 5.0% |
| $35,000 to $49,999 | 84 | 5.6% |
| $50,000 to $74,999 | 215 | 14.3% |
| $75,000 to $99,999 | 181 | 12.0% |
| $100,000 to $149,999 | 373 | 24.8% |
| $150,000 to $199,999 | 164 | 10.9% |
| $200,000+ | 224 | 14.9% |
Household Income by Householder Age in Lockeford
The median household income in Lockeford is $106,087, with the highest median household income of $127,188 found in the 45 to 64 years age bracket for the primary householder. A total of 399 households (26.5%) fall into this category. Meanwhile, the 15 to 24 years age bracket for the primary householder has the lowest median household income of $0, with 24 households (1.6%) in this group.
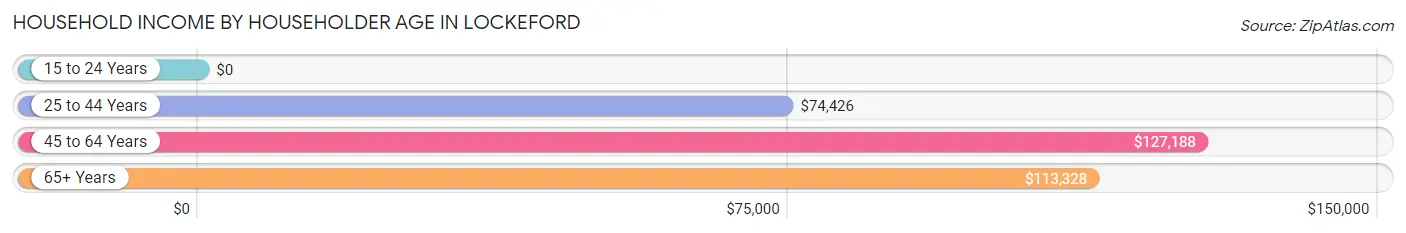
| Income Bracket | # Households | Median Income |
| 15 to 24 Years | 24 (1.6%) | $0 |
| 25 to 44 Years | 447 (29.7%) | $74,426 |
| 45 to 64 Years | 399 (26.5%) | $127,188 |
| 65+ Years | 636 (42.2%) | $113,328 |
| Total | 1,506 (100.0%) | $106,087 |
Poverty in Lockeford
Income Below Poverty by Sex and Age in Lockeford
With 10.2% poverty level for males and 9.3% for females among the residents of Lockeford, 15 year old males and 5 year old females are the most vulnerable to poverty, with 16 males (66.7%) and 11 females (32.4%) in their respective age groups living below the poverty level.
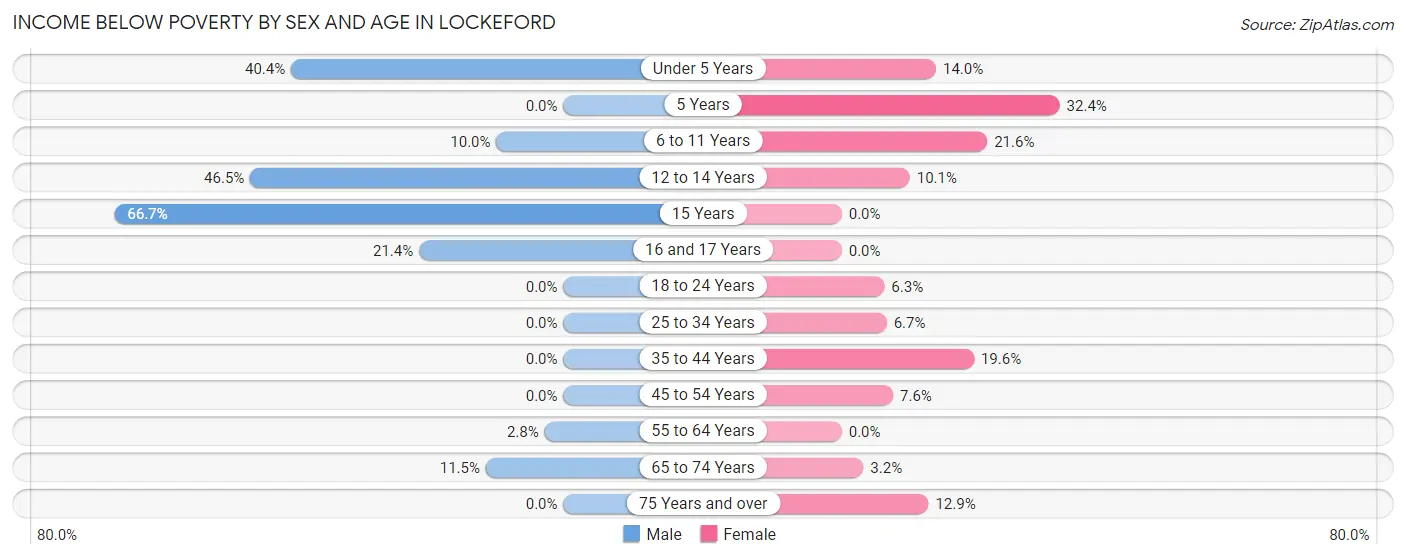
| Age Bracket | Male | Female |
| Under 5 Years | 91 (40.4%) | 7 (14.0%) |
| 5 Years | 0 (0.0%) | 11 (32.4%) |
| 6 to 11 Years | 19 (10.0%) | 35 (21.6%) |
| 12 to 14 Years | 40 (46.5%) | 10 (10.1%) |
| 15 Years | 16 (66.7%) | 0 (0.0%) |
| 16 and 17 Years | 21 (21.4%) | 0 (0.0%) |
| 18 to 24 Years | 0 (0.0%) | 5 (6.3%) |
| 25 to 34 Years | 0 (0.0%) | 10 (6.7%) |
| 35 to 44 Years | 0 (0.0%) | 53 (19.6%) |
| 45 to 54 Years | 0 (0.0%) | 16 (7.6%) |
| 55 to 64 Years | 6 (2.8%) | 0 (0.0%) |
| 65 to 74 Years | 38 (11.5%) | 12 (3.2%) |
| 75 Years and over | 0 (0.0%) | 13 (12.9%) |
| Total | 231 (10.2%) | 172 (9.3%) |
Income Above Poverty by Sex and Age in Lockeford
According to the poverty statistics in Lockeford, males aged 18 to 24 years and females aged 16 and 17 years are the age groups that are most secure financially, with 100.0% of males and 100.0% of females in these age groups living above the poverty line.
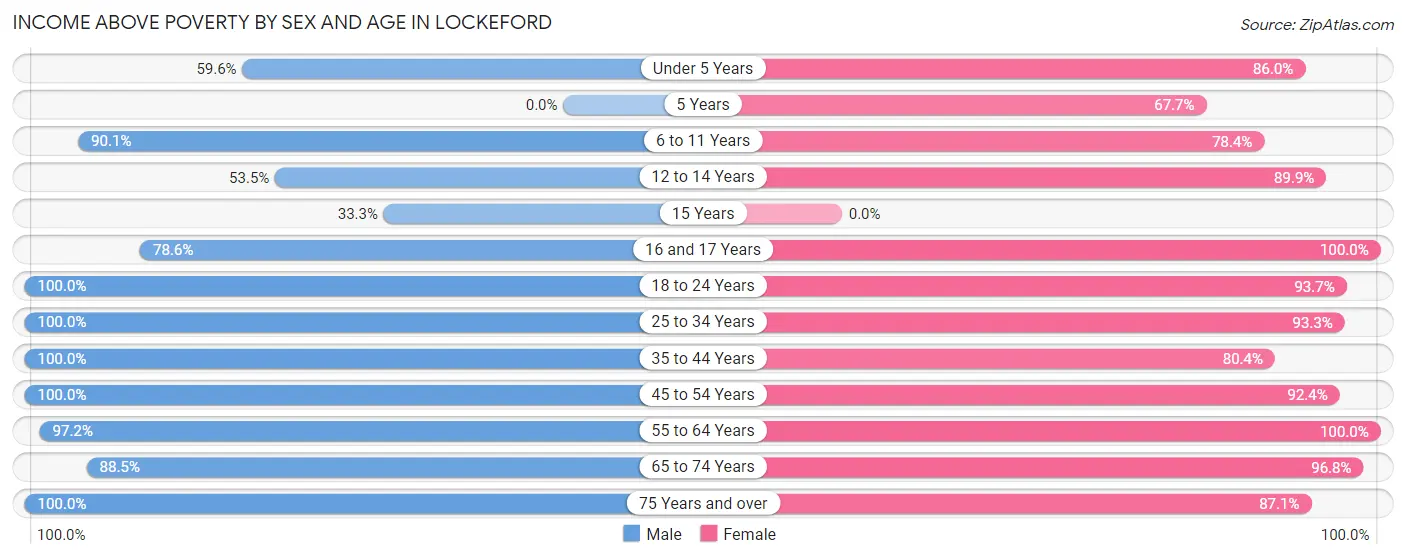
| Age Bracket | Male | Female |
| Under 5 Years | 134 (59.6%) | 43 (86.0%) |
| 5 Years | 0 (0.0%) | 23 (67.6%) |
| 6 to 11 Years | 172 (90.0%) | 127 (78.4%) |
| 12 to 14 Years | 46 (53.5%) | 89 (89.9%) |
| 15 Years | 8 (33.3%) | 0 (0.0%) |
| 16 and 17 Years | 77 (78.6%) | 24 (100.0%) |
| 18 to 24 Years | 160 (100.0%) | 74 (93.7%) |
| 25 to 34 Years | 312 (100.0%) | 140 (93.3%) |
| 35 to 44 Years | 312 (100.0%) | 217 (80.4%) |
| 45 to 54 Years | 155 (100.0%) | 194 (92.4%) |
| 55 to 64 Years | 209 (97.2%) | 299 (100.0%) |
| 65 to 74 Years | 292 (88.5%) | 362 (96.8%) |
| 75 Years and over | 149 (100.0%) | 88 (87.1%) |
| Total | 2,026 (89.8%) | 1,680 (90.7%) |
Income Below Poverty Among Married-Couple Families in Lockeford
The poverty statistics for married-couple families in Lockeford show that 1.6% or 12 of the total 767 families live below the poverty line. Families with 1 or 2 children have the highest poverty rate of 2.2%, comprising of 5 families. On the other hand, families with 3 or 4 children have the lowest poverty rate of 0.0%, which includes 0 families.
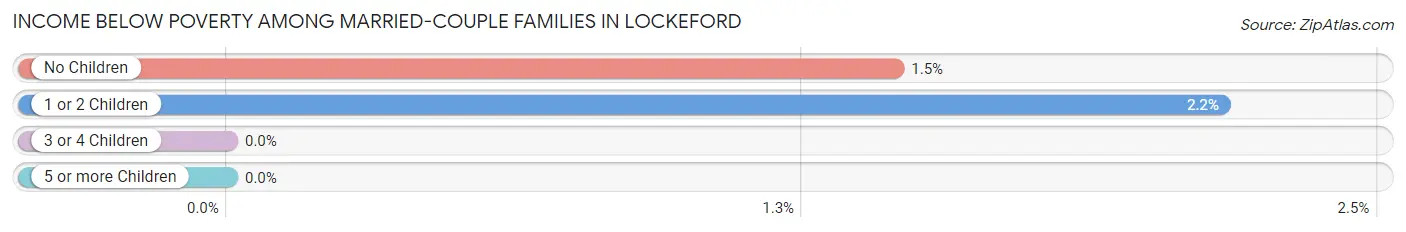
| Children | Above Poverty | Below Poverty |
| No Children | 476 (98.6%) | 7 (1.5%) |
| 1 or 2 Children | 226 (97.8%) | 5 (2.2%) |
| 3 or 4 Children | 53 (100.0%) | 0 (0.0%) |
| 5 or more Children | 0 (0.0%) | 0 (0.0%) |
| Total | 755 (98.4%) | 12 (1.6%) |
Income Below Poverty Among Single-Parent Households in Lockeford
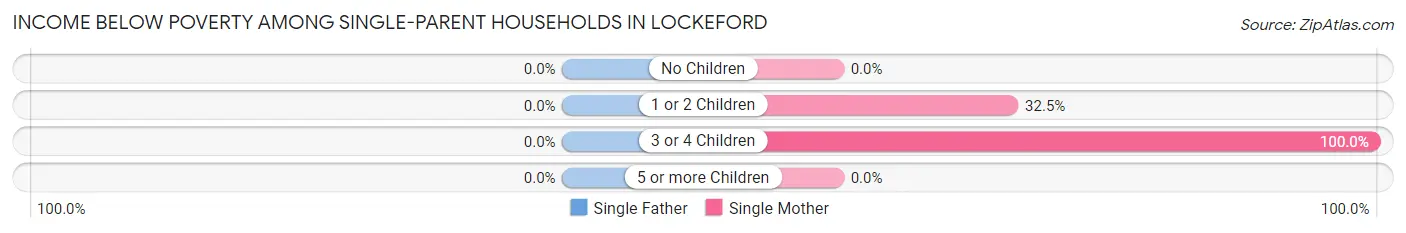
| Children | Single Father | Single Mother |
| No Children | 0 (0.0%) | 0 (0.0%) |
| 1 or 2 Children | 0 (0.0%) | 39 (32.5%) |
| 3 or 4 Children | 0 (0.0%) | 45 (100.0%) |
| 5 or more Children | 0 (0.0%) | 0 (0.0%) |
| Total | 0 (0.0%) | 84 (45.9%) |
Income Below Poverty Among Married-Couple vs Single-Parent Households in Lockeford
The poverty data for Lockeford shows that 12 of the married-couple family households (1.6%) and 84 of the single-parent households (28.7%) are living below the poverty level. Within the married-couple family households, those with 1 or 2 children have the highest poverty rate, with 5 households (2.2%) falling below the poverty line. Among the single-parent households, those with 3 or 4 children have the highest poverty rate, with 45 household (100.0%) living below poverty.
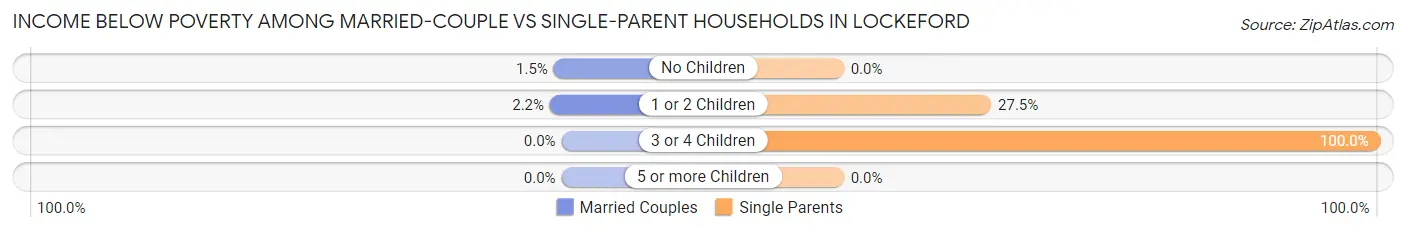
| Children | Married-Couple Families | Single-Parent Households |
| No Children | 7 (1.5%) | 0 (0.0%) |
| 1 or 2 Children | 5 (2.2%) | 39 (27.5%) |
| 3 or 4 Children | 0 (0.0%) | 45 (100.0%) |
| 5 or more Children | 0 (0.0%) | 0 (0.0%) |
| Total | 12 (1.6%) | 84 (28.7%) |
Race in Lockeford
The most populous races in Lockeford are White / Caucasian (3,117 | 75.5%), Hispanic or Latino (1,350 | 32.7%), and Two or more Races (416 | 10.1%).
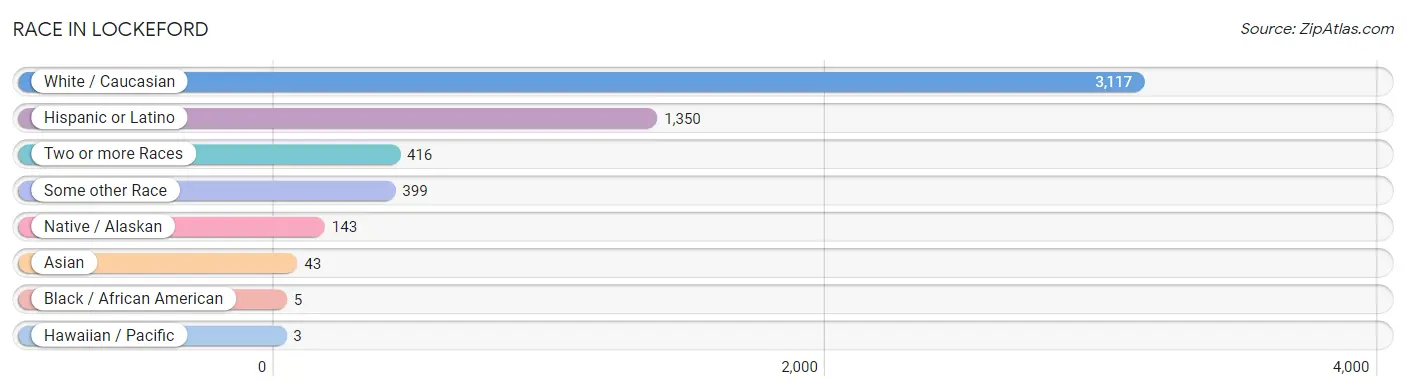
| Race | # Population | % Population |
| Asian | 43 | 1.0% |
| Black / African American | 5 | 0.1% |
| Hawaiian / Pacific | 3 | 0.1% |
| Hispanic or Latino | 1,350 | 32.7% |
| Native / Alaskan | 143 | 3.5% |
| White / Caucasian | 3,117 | 75.5% |
| Two or more Races | 416 | 10.1% |
| Some other Race | 399 | 9.7% |
| Total | 4,126 | 100.0% |
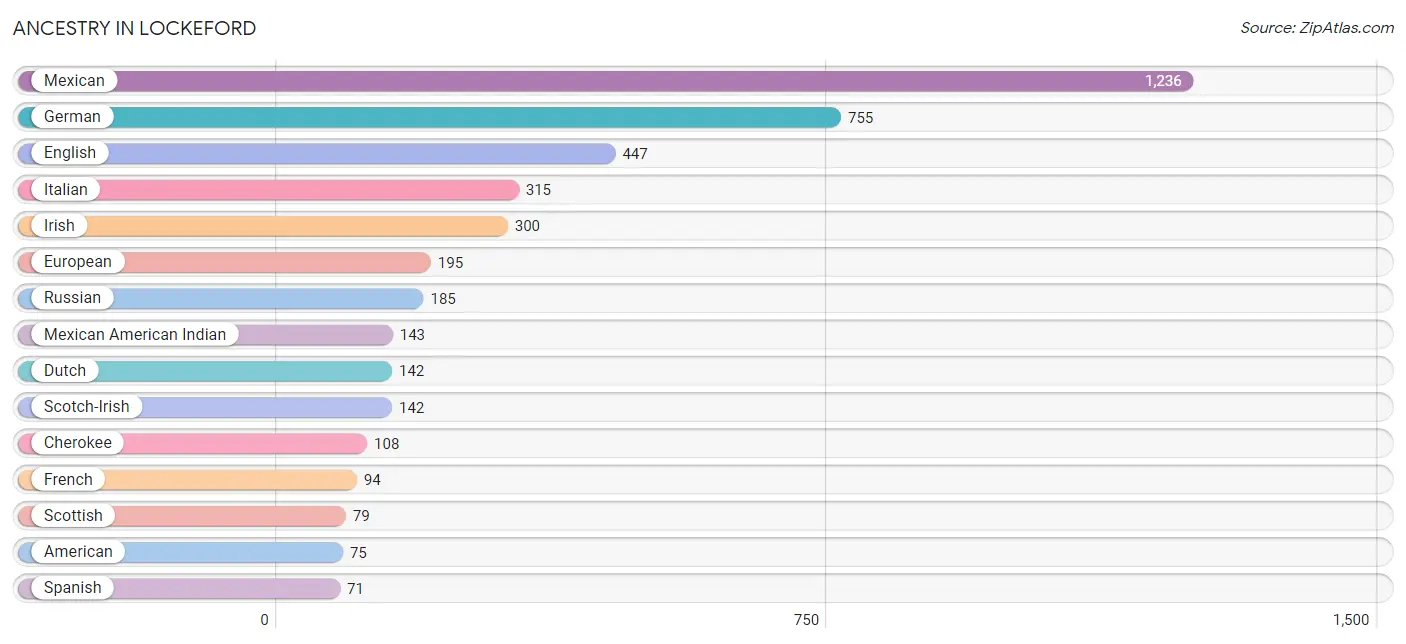
Ancestry in Lockeford
The most populous ancestries reported in Lockeford are Mexican (1,236 | 30.0%), German (755 | 18.3%), English (447 | 10.8%), Italian (315 | 7.6%), and Irish (300 | 7.3%), together accounting for 74.0% of all Lockeford residents.
| Ancestry | # Population | % Population |
| African | 5 | 0.1% |
| American | 75 | 1.8% |
| Arab | 16 | 0.4% |
| Austrian | 12 | 0.3% |
| Bangladeshi | 20 | 0.5% |
| Brazilian | 3 | 0.1% |
| Canadian | 5 | 0.1% |
| Cherokee | 108 | 2.6% |
| Choctaw | 8 | 0.2% |
| Czech | 56 | 1.4% |
| Dutch | 142 | 3.4% |
| English | 447 | 10.8% |
| European | 195 | 4.7% |
| French | 94 | 2.3% |
| French Canadian | 11 | 0.3% |
| German | 755 | 18.3% |
| Hungarian | 25 | 0.6% |
| Icelander | 4 | 0.1% |
| Indian (Asian) | 23 | 0.6% |
| Irish | 300 | 7.3% |
| Italian | 315 | 7.6% |
| Korean | 5 | 0.1% |
| Lebanese | 10 | 0.2% |
| Mexican | 1,236 | 30.0% |
| Mexican American Indian | 143 | 3.5% |
| Native Hawaiian | 13 | 0.3% |
| Northern European | 22 | 0.5% |
| Polish | 5 | 0.1% |
| Portuguese | 52 | 1.3% |
| Puerto Rican | 36 | 0.9% |
| Russian | 185 | 4.5% |
| Scandinavian | 17 | 0.4% |
| Scotch-Irish | 142 | 3.4% |
| Scottish | 79 | 1.9% |
| Spaniard | 7 | 0.2% |
| Spanish | 71 | 1.7% |
| Subsaharan African | 5 | 0.1% |
| Swedish | 39 | 0.9% |
| Swiss | 26 | 0.6% |
| Syrian | 10 | 0.2% |
| Thai | 14 | 0.3% |
| Welsh | 17 | 0.4% | View All 42 Rows |
Immigrants in Lockeford
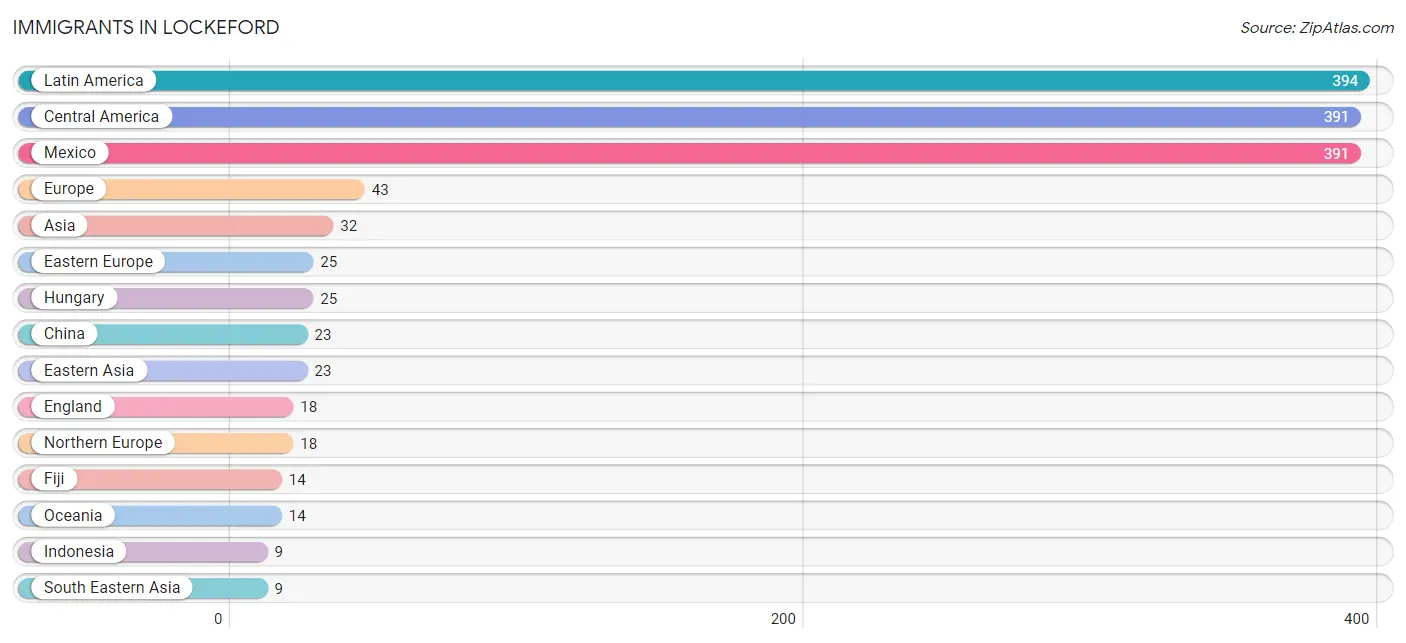
The most numerous immigrant groups reported in Lockeford came from Latin America (394 | 9.6%), Central America (391 | 9.5%), Mexico (391 | 9.5%), Europe (43 | 1.0%), and Asia (32 | 0.8%), together accounting for 30.3% of all Lockeford residents.
| Immigration Origin | # Population | % Population |
| Asia | 32 | 0.8% |
| Brazil | 3 | 0.1% |
| Central America | 391 | 9.5% |
| China | 23 | 0.6% |
| Eastern Asia | 23 | 0.6% |
| Eastern Europe | 25 | 0.6% |
| England | 18 | 0.4% |
| Europe | 43 | 1.0% |
| Fiji | 14 | 0.3% |
| Hungary | 25 | 0.6% |
| Indonesia | 9 | 0.2% |
| Latin America | 394 | 9.6% |
| Mexico | 391 | 9.5% |
| Northern Europe | 18 | 0.4% |
| Oceania | 14 | 0.3% |
| South America | 3 | 0.1% |
| South Eastern Asia | 9 | 0.2% | View All 17 Rows |
Sex and Age in Lockeford
Sex and Age in Lockeford
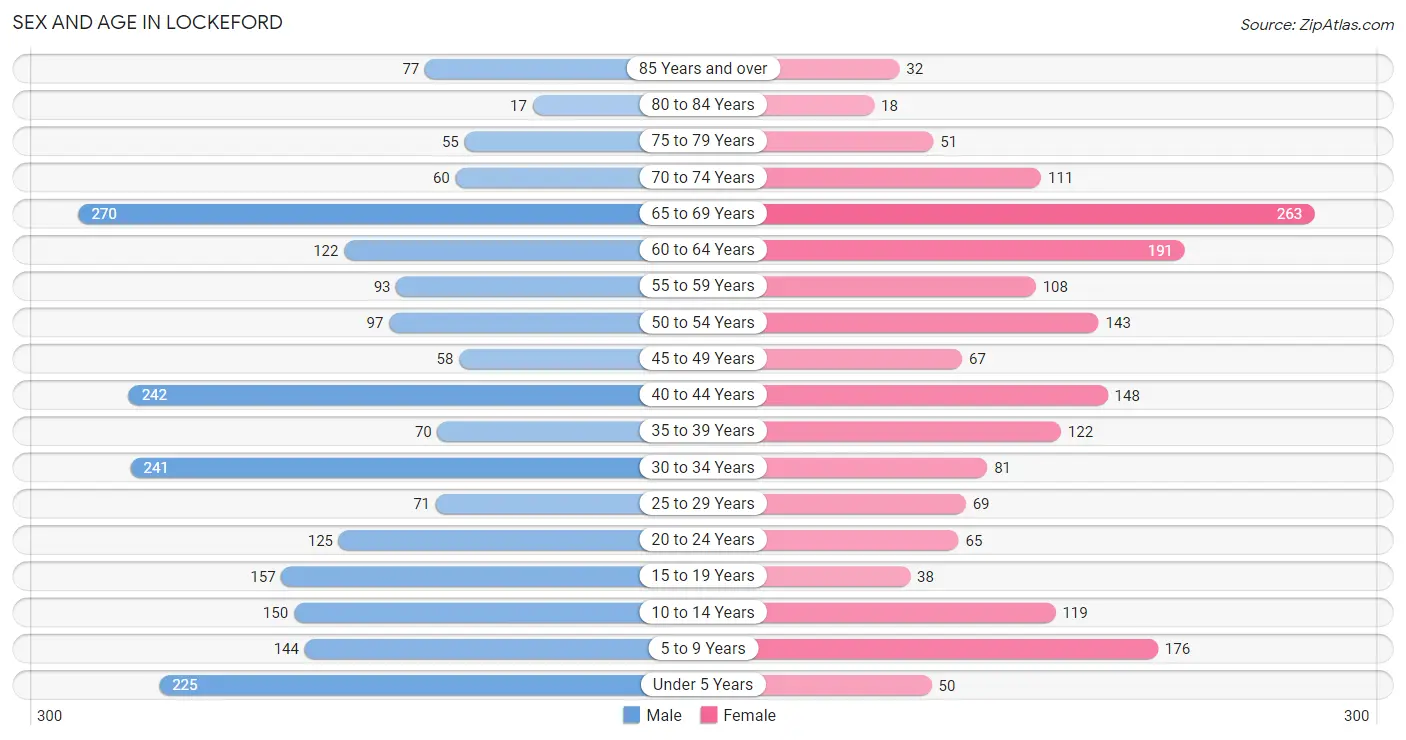
The most populous age groups in Lockeford are 65 to 69 Years (270 | 11.9%) for men and 65 to 69 Years (263 | 14.2%) for women.
| Age Bracket | Male | Female |
| Under 5 Years | 225 (9.9%) | 50 (2.7%) |
| 5 to 9 Years | 144 (6.3%) | 176 (9.5%) |
| 10 to 14 Years | 150 (6.6%) | 119 (6.4%) |
| 15 to 19 Years | 157 (6.9%) | 38 (2.1%) |
| 20 to 24 Years | 125 (5.5%) | 65 (3.5%) |
| 25 to 29 Years | 71 (3.1%) | 69 (3.7%) |
| 30 to 34 Years | 241 (10.6%) | 81 (4.4%) |
| 35 to 39 Years | 70 (3.1%) | 122 (6.6%) |
| 40 to 44 Years | 242 (10.6%) | 148 (8.0%) |
| 45 to 49 Years | 58 (2.5%) | 67 (3.6%) |
| 50 to 54 Years | 97 (4.3%) | 143 (7.7%) |
| 55 to 59 Years | 93 (4.1%) | 108 (5.8%) |
| 60 to 64 Years | 122 (5.4%) | 191 (10.3%) |
| 65 to 69 Years | 270 (11.9%) | 263 (14.2%) |
| 70 to 74 Years | 60 (2.6%) | 111 (6.0%) |
| 75 to 79 Years | 55 (2.4%) | 51 (2.8%) |
| 80 to 84 Years | 17 (0.7%) | 18 (1.0%) |
| 85 Years and over | 77 (3.4%) | 32 (1.7%) |
| Total | 2,274 (100.0%) | 1,852 (100.0%) |
Families and Households in Lockeford
Median Family Size in Lockeford
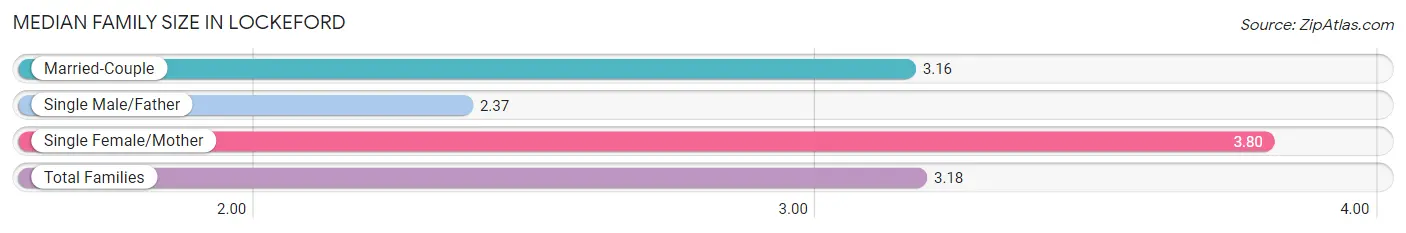
The median family size in Lockeford is 3.18 persons per family, with single female/mother families (183 | 17.3%) accounting for the largest median family size of 3.8 persons per family. On the other hand, single male/father families (110 | 10.4%) represent the smallest median family size with 2.37 persons per family.
| Family Type | # Families | Family Size |
| Married-Couple | 767 (72.4%) | 3.16 |
| Single Male/Father | 110 (10.4%) | 2.37 |
| Single Female/Mother | 183 (17.3%) | 3.80 |
| Total Families | 1,060 (100.0%) | 3.18 |
Median Household Size in Lockeford
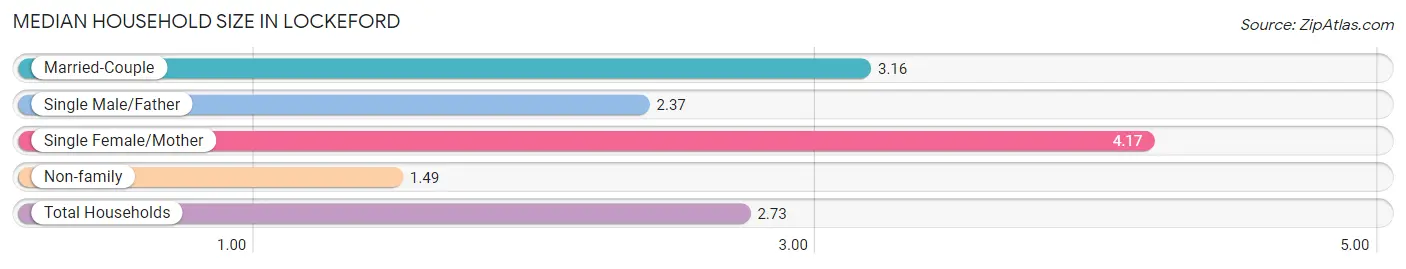
The median household size in Lockeford is 2.73 persons per household, with single female/mother households (183 | 12.1%) accounting for the largest median household size of 4.17 persons per household. non-family households (446 | 29.6%) represent the smallest median household size with 1.49 persons per household.
| Household Type | # Households | Household Size |
| Married-Couple | 767 (50.9%) | 3.16 |
| Single Male/Father | 110 (7.3%) | 2.37 |
| Single Female/Mother | 183 (12.1%) | 4.17 |
| Non-family | 446 (29.6%) | 1.49 |
| Total Households | 1,506 (100.0%) | 2.73 |
Household Size by Marriage Status in Lockeford
Out of a total of 1,506 households in Lockeford, 1,060 (70.4%) are family households, while 446 (29.6%) are nonfamily households. The most numerous type of family households are 2-person households, comprising 528, and the most common type of nonfamily households are 1-person households, comprising 300.
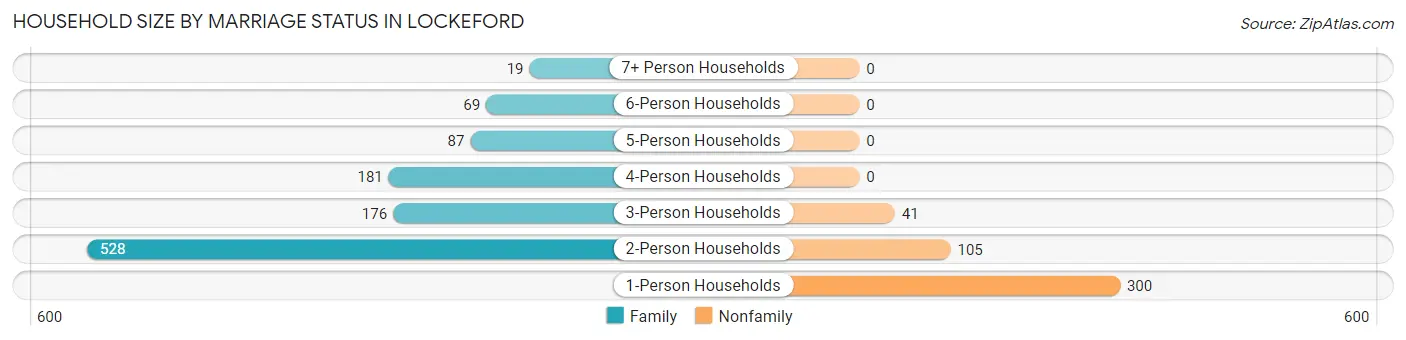
| Household Size | Family Households | Nonfamily Households |
| 1-Person Households | - | 300 (19.9%) |
| 2-Person Households | 528 (35.1%) | 105 (7.0%) |
| 3-Person Households | 176 (11.7%) | 41 (2.7%) |
| 4-Person Households | 181 (12.0%) | 0 (0.0%) |
| 5-Person Households | 87 (5.8%) | 0 (0.0%) |
| 6-Person Households | 69 (4.6%) | 0 (0.0%) |
| 7+ Person Households | 19 (1.3%) | 0 (0.0%) |
| Total | 1,060 (70.4%) | 446 (29.6%) |
Female Fertility in Lockeford
Fertility by Age in Lockeford
Average fertility rate in Lockeford is 17.0 births per 1,000 women. Women in the age bracket of 35 to 50 years have the highest fertility rate with 30.0 births per 1,000 women. Women in the age bracket of 35 to 50 years acount for 100.0% of all women with births.
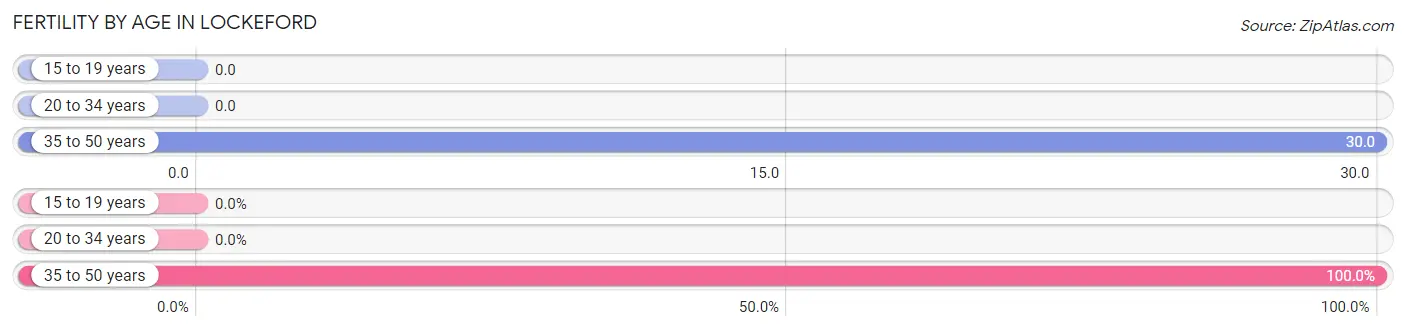
| Age Bracket | Women with Births | Births / 1,000 Women |
| 15 to 19 years | 0 (0.0%) | 0.0 |
| 20 to 34 years | 0 (0.0%) | 0.0 |
| 35 to 50 years | 10 (100.0%) | 30.0 |
| Total | 10 (100.0%) | 17.0 |
Fertility by Age by Marriage Status in Lockeford
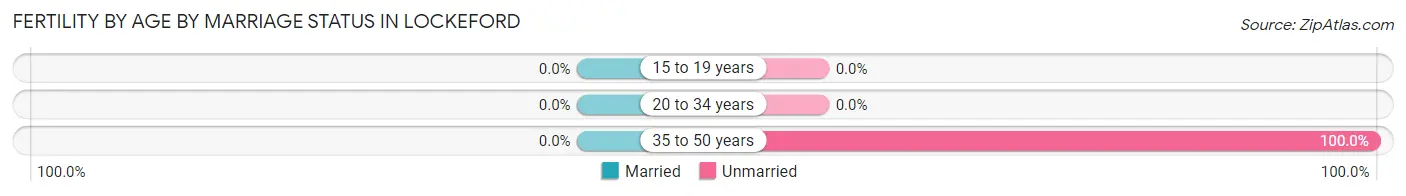
| Age Bracket | Married | Unmarried |
| 15 to 19 years | 0 (0.0%) | 0 (0.0%) |
| 20 to 34 years | 0 (0.0%) | 0 (0.0%) |
| 35 to 50 years | 0 (0.0%) | 10 (100.0%) |
| Total | 0 (0.0%) | 10 (100.0%) |
Fertility by Education in Lockeford
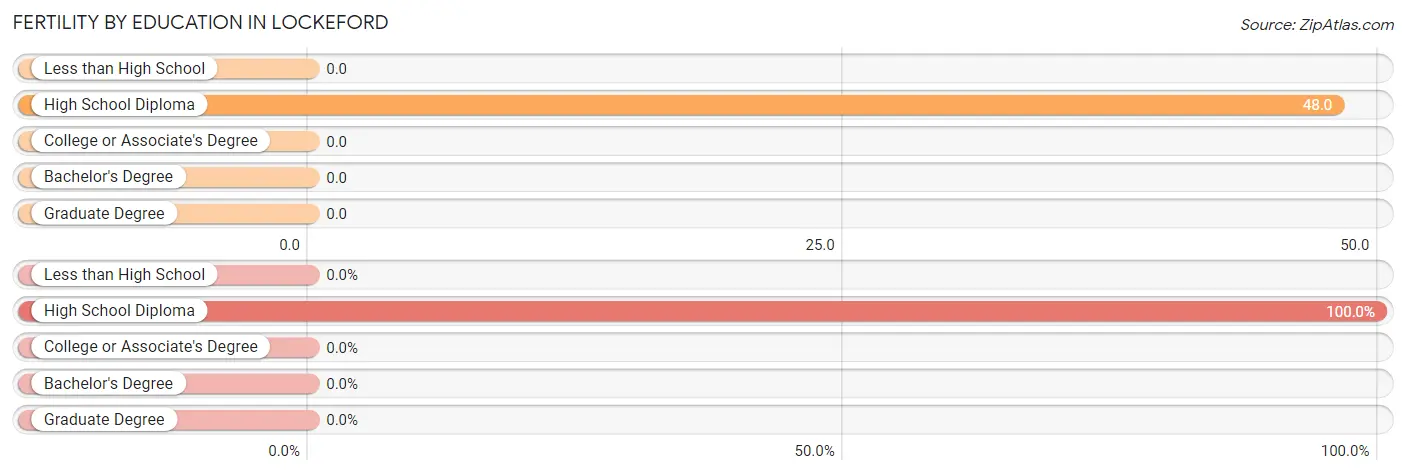
| Educational Attainment | Women with Births | Births / 1,000 Women |
| Less than High School | 0 (0.0%) | 0.0 |
| High School Diploma | 10 (100.0%) | 48.0 |
| College or Associate's Degree | 0 (0.0%) | 0.0 |
| Bachelor's Degree | 0 (0.0%) | 0.0 |
| Graduate Degree | 0 (0.0%) | 0.0 |
| Total | 10 (100.0%) | 17.0 |
Fertility by Education by Marriage Status in Lockeford
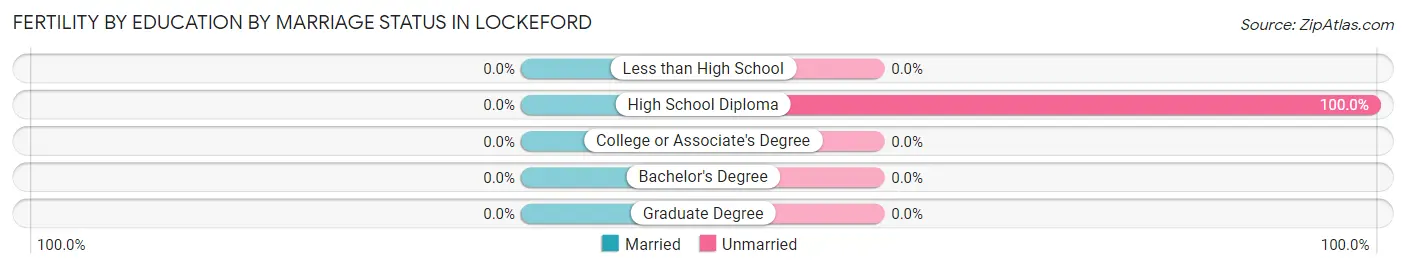
| Educational Attainment | Married | Unmarried |
| Less than High School | 0 (0.0%) | 0 (0.0%) |
| High School Diploma | 0 (0.0%) | 10 (100.0%) |
| College or Associate's Degree | 0 (0.0%) | 0 (0.0%) |
| Bachelor's Degree | 0 (0.0%) | 0 (0.0%) |
| Graduate Degree | 0 (0.0%) | 0 (0.0%) |
| Total | 0 (0.0%) | 10 (100.0%) |
Employment Characteristics in Lockeford
Employment by Class of Employer in Lockeford
Among the 1,781 employed individuals in Lockeford, private company employees (1,084 | 60.9%), local government employees (202 | 11.3%), and self-employed (not incorporated) (190 | 10.7%) make up the most common classes of employment.
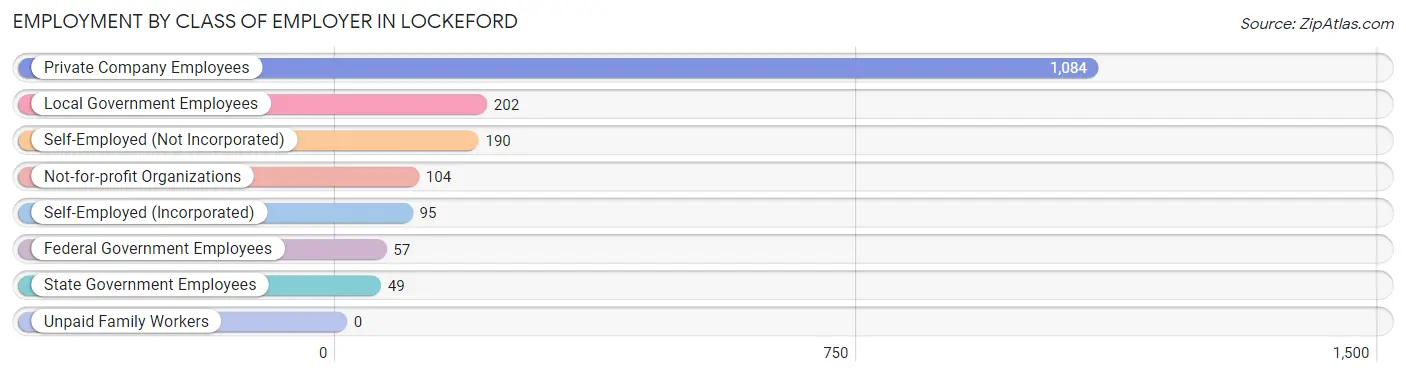
| Employer Class | # Employees | % Employees |
| Private Company Employees | 1,084 | 60.9% |
| Self-Employed (Incorporated) | 95 | 5.3% |
| Self-Employed (Not Incorporated) | 190 | 10.7% |
| Not-for-profit Organizations | 104 | 5.8% |
| Local Government Employees | 202 | 11.3% |
| State Government Employees | 49 | 2.8% |
| Federal Government Employees | 57 | 3.2% |
| Unpaid Family Workers | 0 | 0.0% |
| Total | 1,781 | 100.0% |
Employment Status by Age in Lockeford
According to the labor force statistics for Lockeford, out of the total population over 16 years of age (3,238), 60.0% or 1,943 individuals are in the labor force, with 6.3% or 122 of them unemployed. The age group with the highest labor force participation rate is 20 to 24 years, with 97.4% or 185 individuals in the labor force. Within the labor force, the 16 to 19 years age range has the highest percentage of unemployed individuals, with 34.3% or 24 of them being unemployed.
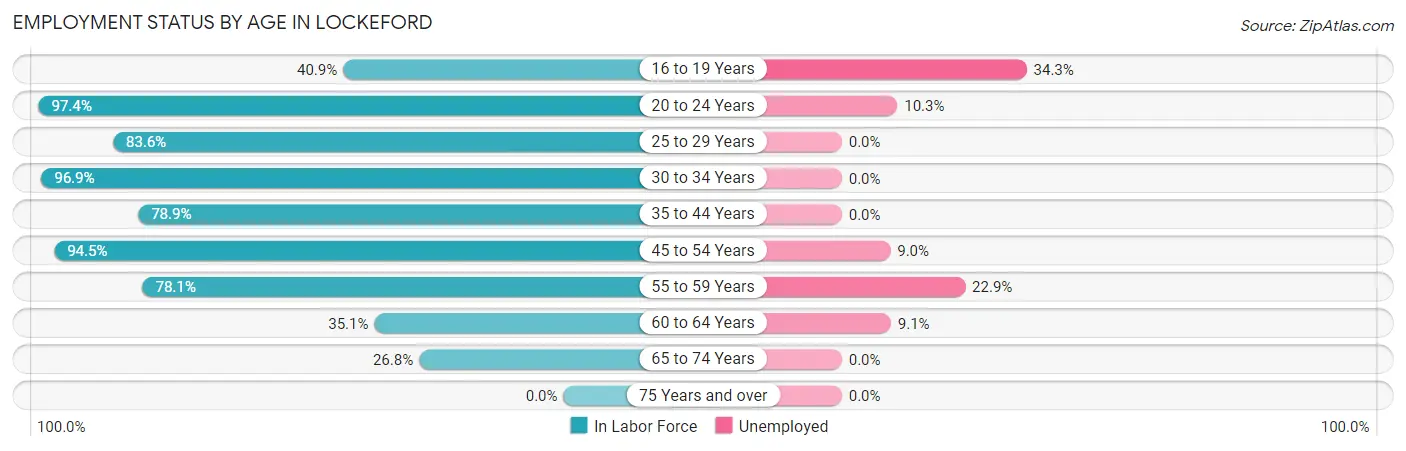
| Age Bracket | In Labor Force | Unemployed |
| 16 to 19 Years | 70 (40.9%) | 24 (34.3%) |
| 20 to 24 Years | 185 (97.4%) | 19 (10.3%) |
| 25 to 29 Years | 117 (83.6%) | 0 (0.0%) |
| 30 to 34 Years | 312 (96.9%) | 0 (0.0%) |
| 35 to 44 Years | 459 (78.9%) | 0 (0.0%) |
| 45 to 54 Years | 345 (94.5%) | 31 (9.0%) |
| 55 to 59 Years | 157 (78.1%) | 36 (22.9%) |
| 60 to 64 Years | 110 (35.1%) | 10 (9.1%) |
| 65 to 74 Years | 189 (26.8%) | 0 (0.0%) |
| 75 Years and over | 0 (0.0%) | 0 (0.0%) |
| Total | 1,943 (60.0%) | 122 (6.3%) |
Employment Status by Educational Attainment in Lockeford
According to labor force statistics for Lockeford, 78.0% of individuals (1,500) out of the total population between 25 and 64 years of age (1,923) are in the labor force, with 5.2% or 78 of them being unemployed. The group with the highest labor force participation rate are those with the educational attainment of college / associate degree, with 87.3% or 591 individuals in the labor force. Within the labor force, individuals with high school diploma education have the highest percentage of unemployment, with 10.5% or 50 of them being unemployed.
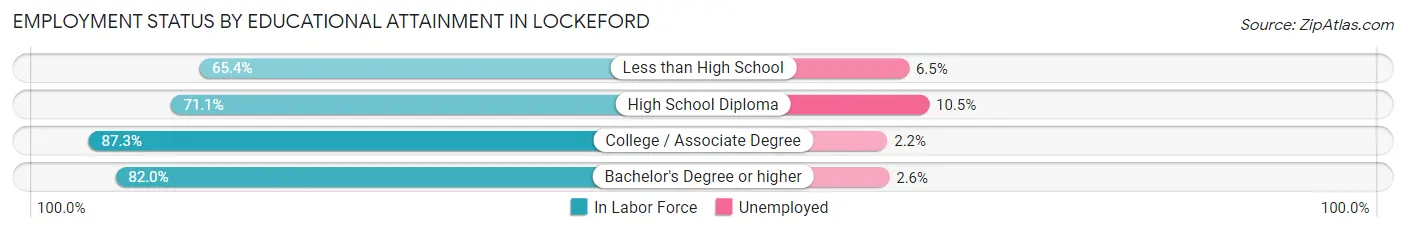
| Educational Attainment | In Labor Force | Unemployed |
| Less than High School | 155 (65.4%) | 15 (6.5%) |
| High School Diploma | 480 (71.1%) | 71 (10.5%) |
| College / Associate Degree | 591 (87.3%) | 15 (2.2%) |
| Bachelor's Degree or higher | 274 (82.0%) | 9 (2.6%) |
| Total | 1,500 (78.0%) | 100 (5.2%) |
Employment Occupations by Sex in Lockeford
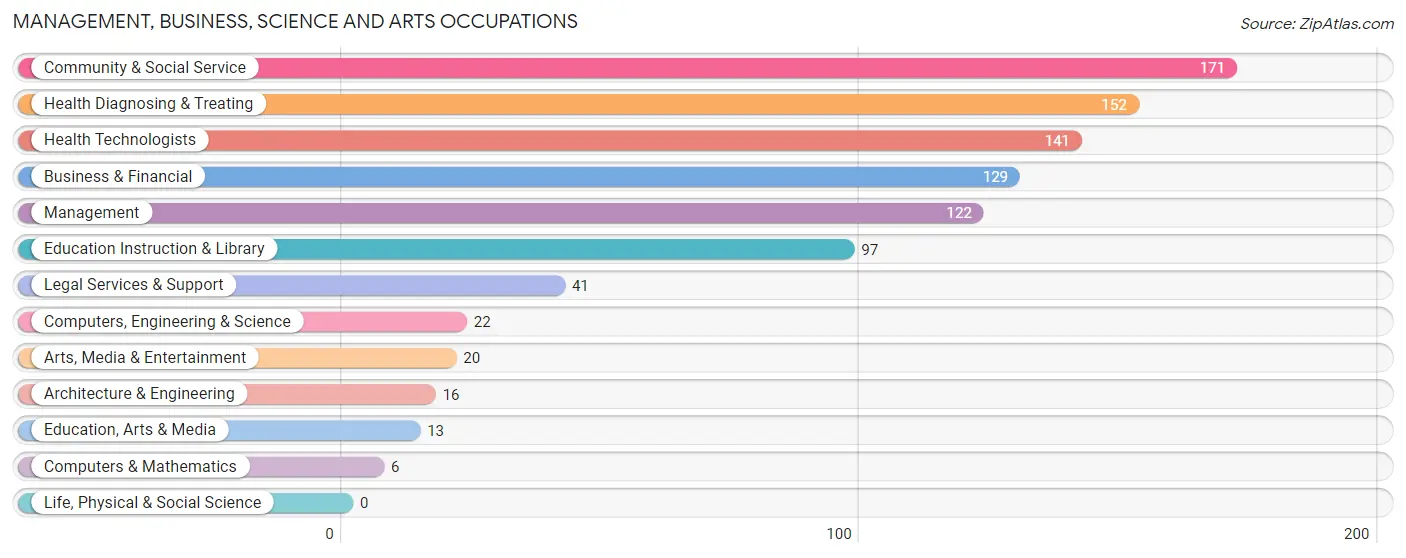
Management, Business, Science and Arts Occupations
The most common Management, Business, Science and Arts occupations in Lockeford are Community & Social Service (171 | 9.6%), Health Diagnosing & Treating (152 | 8.5%), Health Technologists (141 | 7.9%), Business & Financial (129 | 7.2%), and Management (122 | 6.8%).
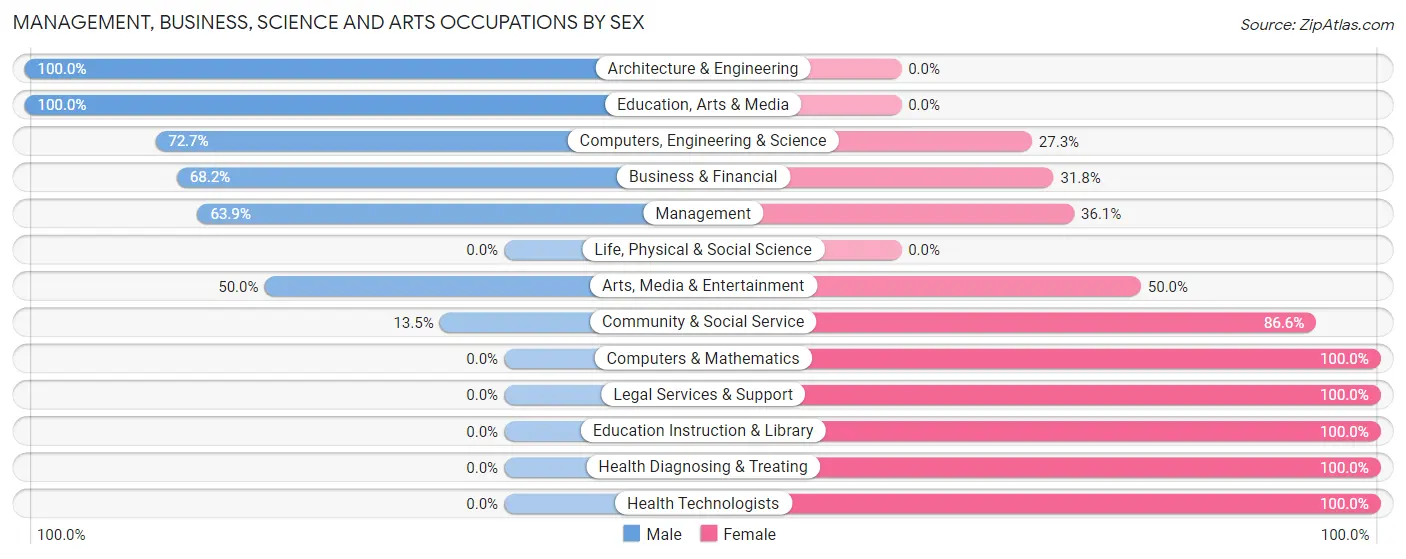
Management, Business, Science and Arts Occupations by Sex
Within the Management, Business, Science and Arts occupations in Lockeford, the most male-oriented occupations are Architecture & Engineering (100.0%), Education, Arts & Media (100.0%), and Computers, Engineering & Science (72.7%), while the most female-oriented occupations are Computers & Mathematics (100.0%), Legal Services & Support (100.0%), and Education Instruction & Library (100.0%).
| Occupation | Male | Female |
| Management | 78 (63.9%) | 44 (36.1%) |
| Business & Financial | 88 (68.2%) | 41 (31.8%) |
| Computers, Engineering & Science | 16 (72.7%) | 6 (27.3%) |
| Computers & Mathematics | 0 (0.0%) | 6 (100.0%) |
| Architecture & Engineering | 16 (100.0%) | 0 (0.0%) |
| Life, Physical & Social Science | 0 (0.0%) | 0 (0.0%) |
| Community & Social Service | 23 (13.5%) | 148 (86.6%) |
| Education, Arts & Media | 13 (100.0%) | 0 (0.0%) |
| Legal Services & Support | 0 (0.0%) | 41 (100.0%) |
| Education Instruction & Library | 0 (0.0%) | 97 (100.0%) |
| Arts, Media & Entertainment | 10 (50.0%) | 10 (50.0%) |
| Health Diagnosing & Treating | 0 (0.0%) | 152 (100.0%) |
| Health Technologists | 0 (0.0%) | 141 (100.0%) |
| Total (Category) | 205 (34.4%) | 391 (65.6%) |
| Total (Overall) | 1,064 (59.4%) | 727 (40.6%) |
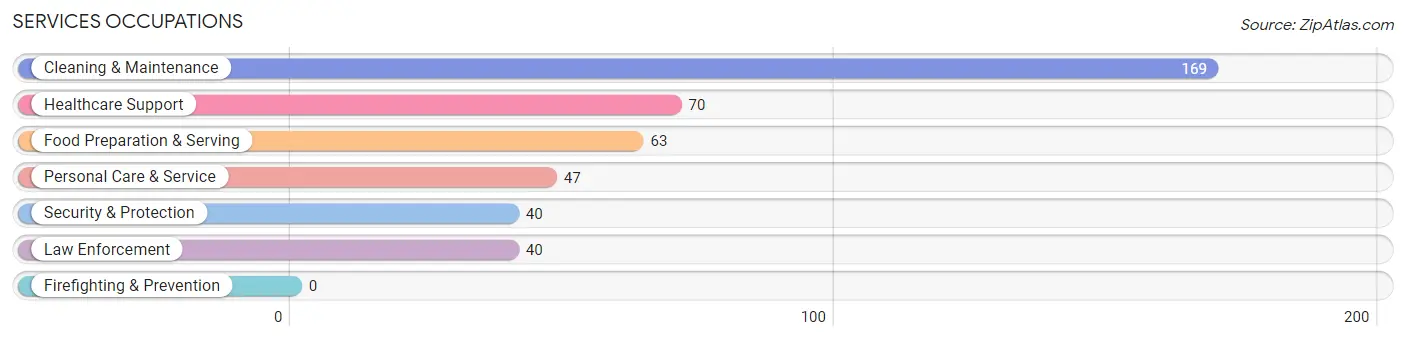
Services Occupations
The most common Services occupations in Lockeford are Cleaning & Maintenance (169 | 9.4%), Healthcare Support (70 | 3.9%), Food Preparation & Serving (63 | 3.5%), Personal Care & Service (47 | 2.6%), and Security & Protection (40 | 2.2%).
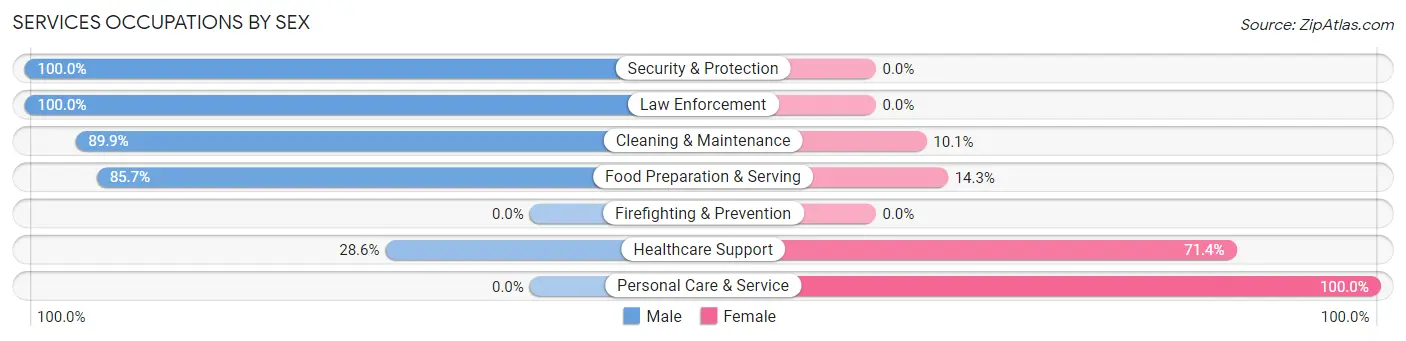
Services Occupations by Sex
Within the Services occupations in Lockeford, the most male-oriented occupations are Security & Protection (100.0%), Law Enforcement (100.0%), and Cleaning & Maintenance (89.9%), while the most female-oriented occupations are Personal Care & Service (100.0%), Healthcare Support (71.4%), and Food Preparation & Serving (14.3%).
| Occupation | Male | Female |
| Healthcare Support | 20 (28.6%) | 50 (71.4%) |
| Security & Protection | 40 (100.0%) | 0 (0.0%) |
| Firefighting & Prevention | 0 (0.0%) | 0 (0.0%) |
| Law Enforcement | 40 (100.0%) | 0 (0.0%) |
| Food Preparation & Serving | 54 (85.7%) | 9 (14.3%) |
| Cleaning & Maintenance | 152 (89.9%) | 17 (10.1%) |
| Personal Care & Service | 0 (0.0%) | 47 (100.0%) |
| Total (Category) | 266 (68.4%) | 123 (31.6%) |
| Total (Overall) | 1,064 (59.4%) | 727 (40.6%) |
Sales and Office Occupations
The most common Sales and Office occupations in Lockeford are Office & Administration (173 | 9.7%), and Sales & Related (20 | 1.1%).
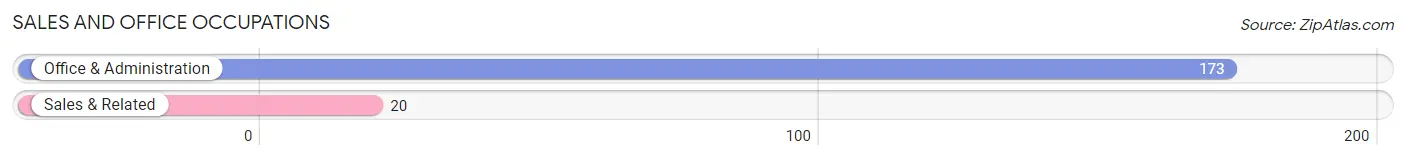
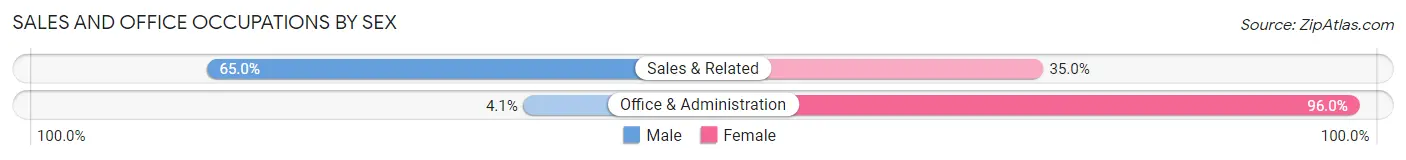
Sales and Office Occupations by Sex
| Occupation | Male | Female |
| Sales & Related | 13 (65.0%) | 7 (35.0%) |
| Office & Administration | 7 (4.1%) | 166 (96.0%) |
| Total (Category) | 20 (10.4%) | 173 (89.6%) |
| Total (Overall) | 1,064 (59.4%) | 727 (40.6%) |
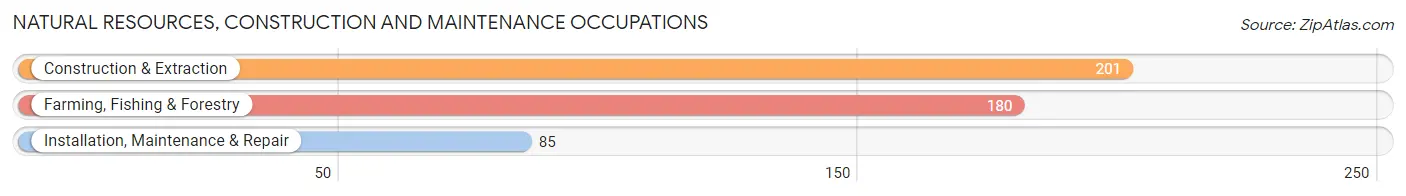
Natural Resources, Construction and Maintenance Occupations
The most common Natural Resources, Construction and Maintenance occupations in Lockeford are Construction & Extraction (201 | 11.2%), Farming, Fishing & Forestry (180 | 10.1%), and Installation, Maintenance & Repair (85 | 4.8%).
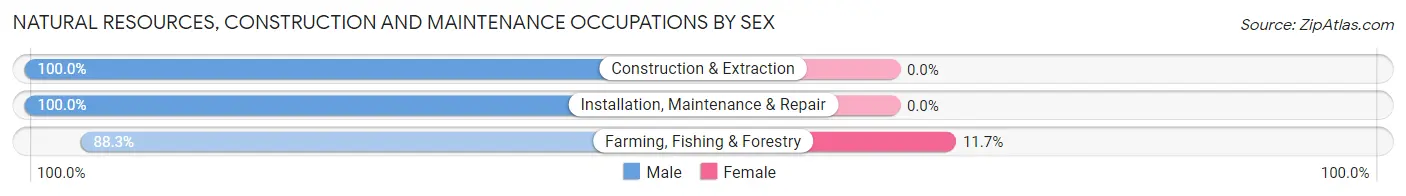
Natural Resources, Construction and Maintenance Occupations by Sex
| Occupation | Male | Female |
| Farming, Fishing & Forestry | 159 (88.3%) | 21 (11.7%) |
| Construction & Extraction | 201 (100.0%) | 0 (0.0%) |
| Installation, Maintenance & Repair | 85 (100.0%) | 0 (0.0%) |
| Total (Category) | 445 (95.5%) | 21 (4.5%) |
| Total (Overall) | 1,064 (59.4%) | 727 (40.6%) |
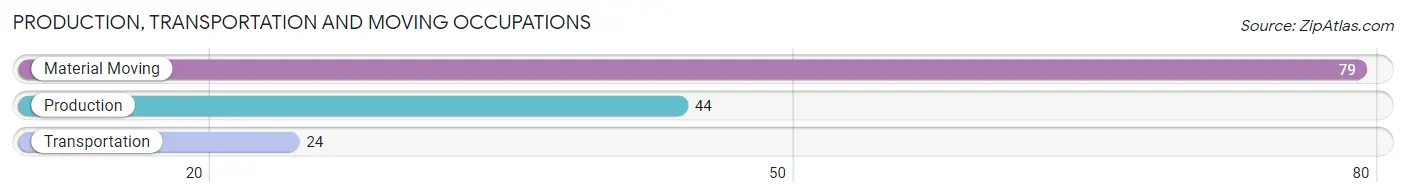
Production, Transportation and Moving Occupations
The most common Production, Transportation and Moving occupations in Lockeford are Material Moving (79 | 4.4%), Production (44 | 2.5%), and Transportation (24 | 1.3%).
Production, Transportation and Moving Occupations by Sex
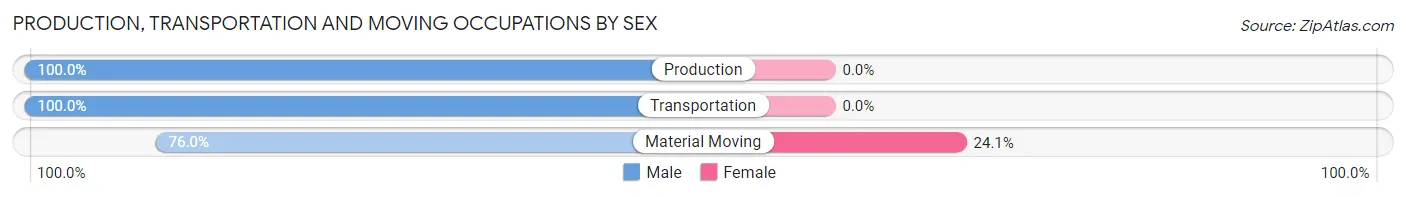
| Occupation | Male | Female |
| Production | 44 (100.0%) | 0 (0.0%) |
| Transportation | 24 (100.0%) | 0 (0.0%) |
| Material Moving | 60 (75.9%) | 19 (24.0%) |
| Total (Category) | 128 (87.1%) | 19 (12.9%) |
| Total (Overall) | 1,064 (59.4%) | 727 (40.6%) |
Employment Industries by Sex in Lockeford
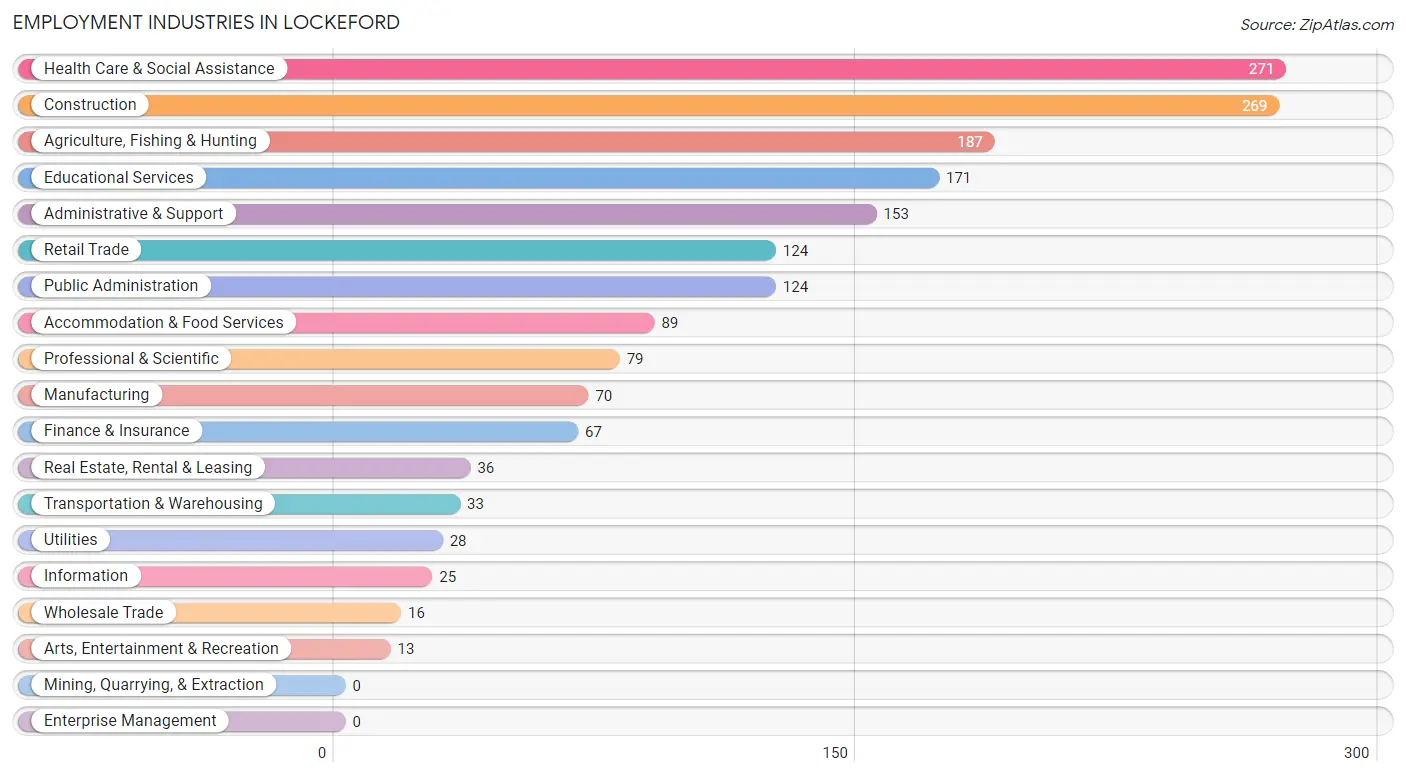
Employment Industries in Lockeford
The major employment industries in Lockeford include Health Care & Social Assistance (271 | 15.1%), Construction (269 | 15.0%), Agriculture, Fishing & Hunting (187 | 10.4%), Educational Services (171 | 9.6%), and Administrative & Support (153 | 8.5%).
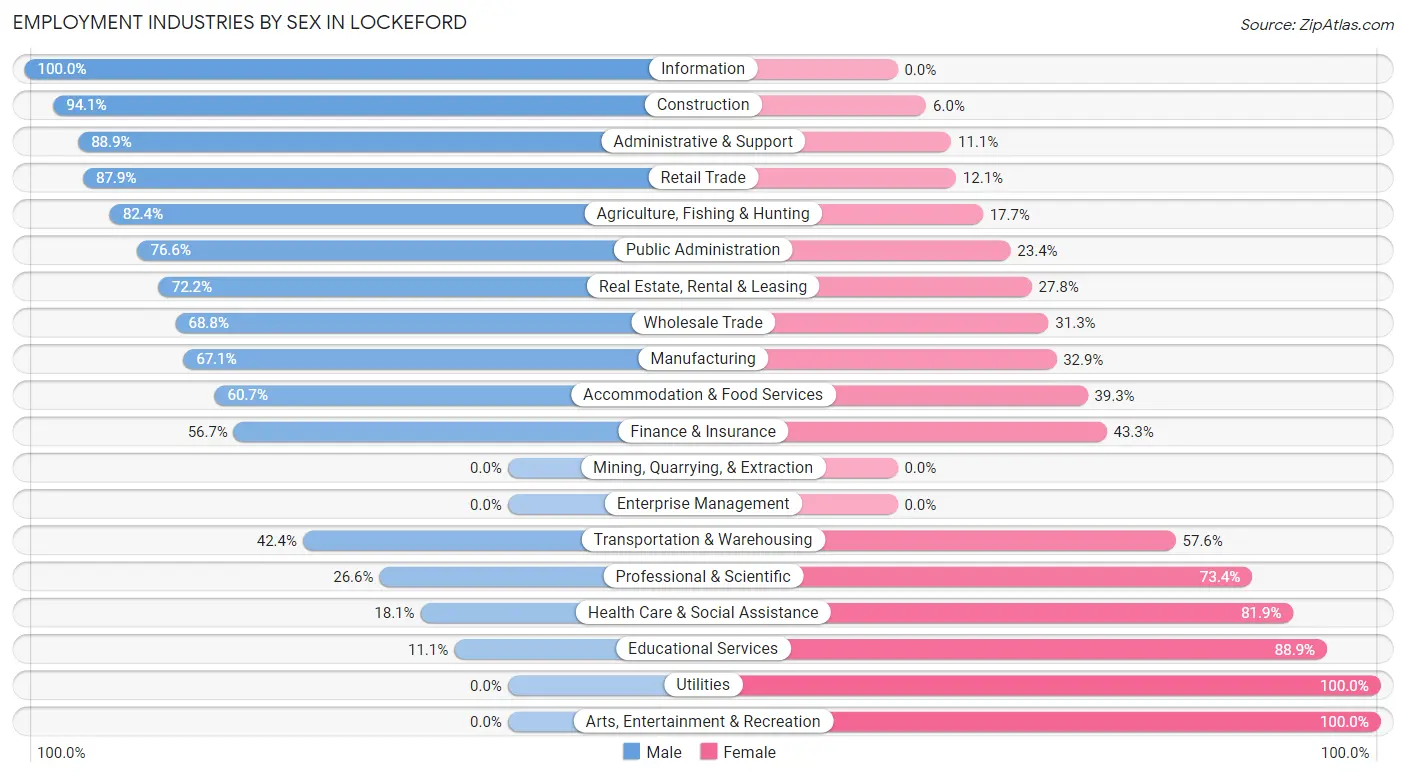
Employment Industries by Sex in Lockeford
The Lockeford industries that see more men than women are Information (100.0%), Construction (94.1%), and Administrative & Support (88.9%), whereas the industries that tend to have a higher number of women are Utilities (100.0%), Arts, Entertainment & Recreation (100.0%), and Educational Services (88.9%).
| Industry | Male | Female |
| Agriculture, Fishing & Hunting | 154 (82.4%) | 33 (17.6%) |
| Mining, Quarrying, & Extraction | 0 (0.0%) | 0 (0.0%) |
| Construction | 253 (94.1%) | 16 (5.9%) |
| Manufacturing | 47 (67.1%) | 23 (32.9%) |
| Wholesale Trade | 11 (68.8%) | 5 (31.2%) |
| Retail Trade | 109 (87.9%) | 15 (12.1%) |
| Transportation & Warehousing | 14 (42.4%) | 19 (57.6%) |
| Utilities | 0 (0.0%) | 28 (100.0%) |
| Information | 25 (100.0%) | 0 (0.0%) |
| Finance & Insurance | 38 (56.7%) | 29 (43.3%) |
| Real Estate, Rental & Leasing | 26 (72.2%) | 10 (27.8%) |
| Professional & Scientific | 21 (26.6%) | 58 (73.4%) |
| Enterprise Management | 0 (0.0%) | 0 (0.0%) |
| Administrative & Support | 136 (88.9%) | 17 (11.1%) |
| Educational Services | 19 (11.1%) | 152 (88.9%) |
| Health Care & Social Assistance | 49 (18.1%) | 222 (81.9%) |
| Arts, Entertainment & Recreation | 0 (0.0%) | 13 (100.0%) |
| Accommodation & Food Services | 54 (60.7%) | 35 (39.3%) |
| Public Administration | 95 (76.6%) | 29 (23.4%) |
| Total | 1,064 (59.4%) | 727 (40.6%) |
Education in Lockeford
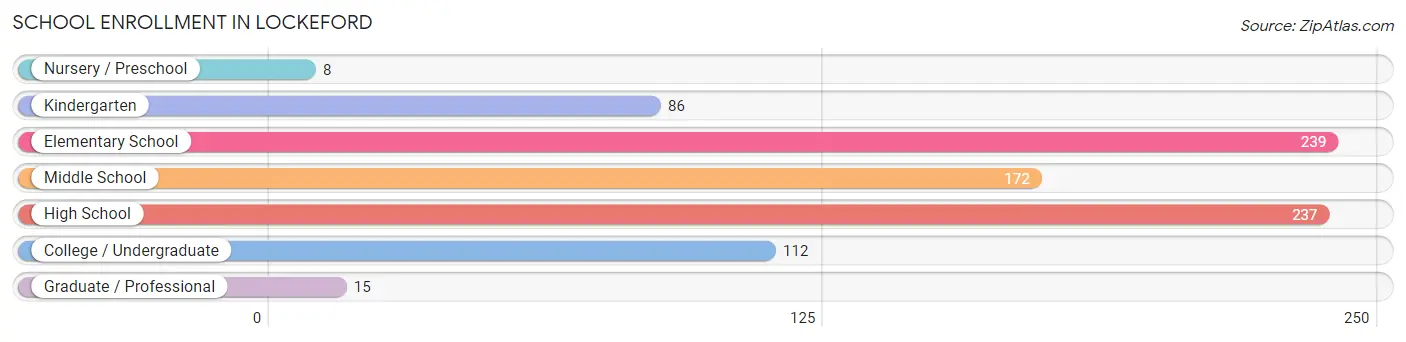
School Enrollment in Lockeford
The most common levels of schooling among the 869 students in Lockeford are elementary school (239 | 27.5%), high school (237 | 27.3%), and middle school (172 | 19.8%).
| School Level | # Students | % Students |
| Nursery / Preschool | 8 | 0.9% |
| Kindergarten | 86 | 9.9% |
| Elementary School | 239 | 27.5% |
| Middle School | 172 | 19.8% |
| High School | 237 | 27.3% |
| College / Undergraduate | 112 | 12.9% |
| Graduate / Professional | 15 | 1.7% |
| Total | 869 | 100.0% |
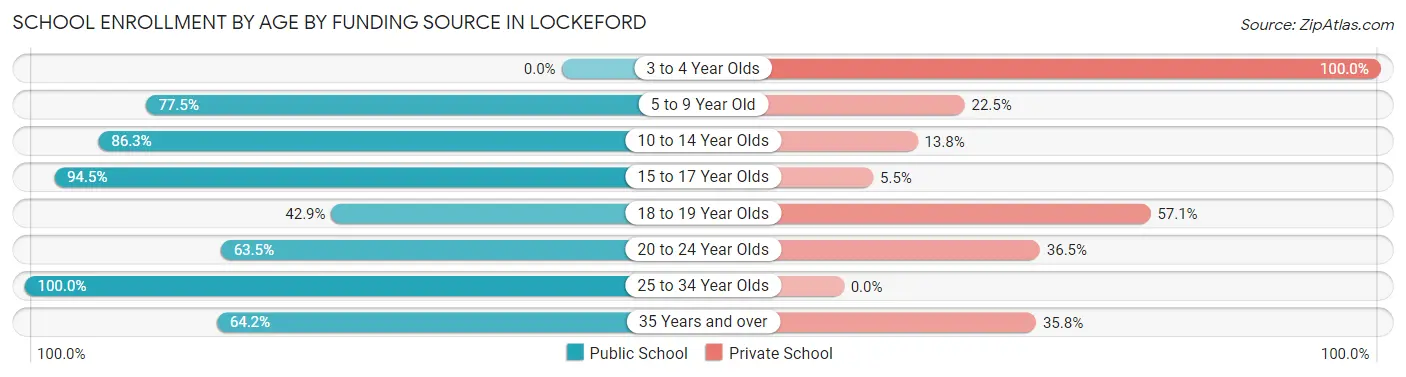
School Enrollment by Age by Funding Source in Lockeford
Out of a total of 869 students who are enrolled in schools in Lockeford, 172 (19.8%) attend a private institution, while the remaining 697 (80.2%) are enrolled in public schools. The age group of 3 to 4 year olds has the highest likelihood of being enrolled in private schools, with 8 (100.0% in the age bracket) enrolled. Conversely, the age group of 25 to 34 year olds has the lowest likelihood of being enrolled in a private school, with 11 (100.0% in the age bracket) attending a public institution.
| Age Bracket | Public School | Private School |
| 3 to 4 Year Olds | 0 (0.0%) | 8 (100.0%) |
| 5 to 9 Year Old | 234 (77.5%) | 68 (22.5%) |
| 10 to 14 Year Olds | 232 (86.3%) | 37 (13.8%) |
| 15 to 17 Year Olds | 138 (94.5%) | 8 (5.5%) |
| 18 to 19 Year Olds | 6 (42.9%) | 8 (57.1%) |
| 20 to 24 Year Olds | 33 (63.5%) | 19 (36.5%) |
| 25 to 34 Year Olds | 11 (100.0%) | 0 (0.0%) |
| 35 Years and over | 43 (64.2%) | 24 (35.8%) |
| Total | 697 (80.2%) | 172 (19.8%) |
Educational Attainment by Field of Study in Lockeford
Business (210 | 27.4%), engineering (187 | 24.4%), science & technology (169 | 22.1%), liberal arts & history (58 | 7.6%), and education (43 | 5.6%) are the most common fields of study among 766 individuals in Lockeford who have obtained a bachelor's degree or higher.
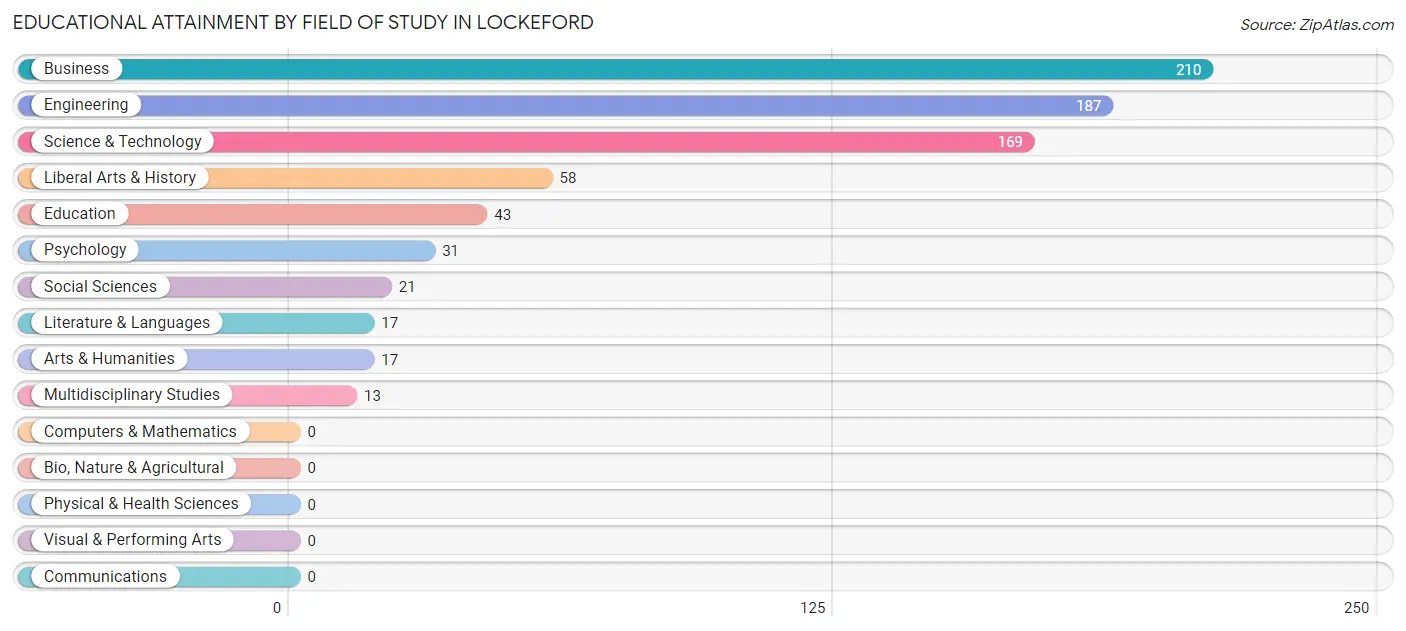
| Field of Study | # Graduates | % Graduates |
| Computers & Mathematics | 0 | 0.0% |
| Bio, Nature & Agricultural | 0 | 0.0% |
| Physical & Health Sciences | 0 | 0.0% |
| Psychology | 31 | 4.1% |
| Social Sciences | 21 | 2.7% |
| Engineering | 187 | 24.4% |
| Multidisciplinary Studies | 13 | 1.7% |
| Science & Technology | 169 | 22.1% |
| Business | 210 | 27.4% |
| Education | 43 | 5.6% |
| Literature & Languages | 17 | 2.2% |
| Liberal Arts & History | 58 | 7.6% |
| Visual & Performing Arts | 0 | 0.0% |
| Communications | 0 | 0.0% |
| Arts & Humanities | 17 | 2.2% |
| Total | 766 | 100.0% |
Transportation & Commute in Lockeford
Vehicle Availability by Sex in Lockeford
The most prevalent vehicle ownership categories in Lockeford are males with 3 vehicles (426, accounting for 39.2%) and females with 3 vehicles (263, making up 61.3%).
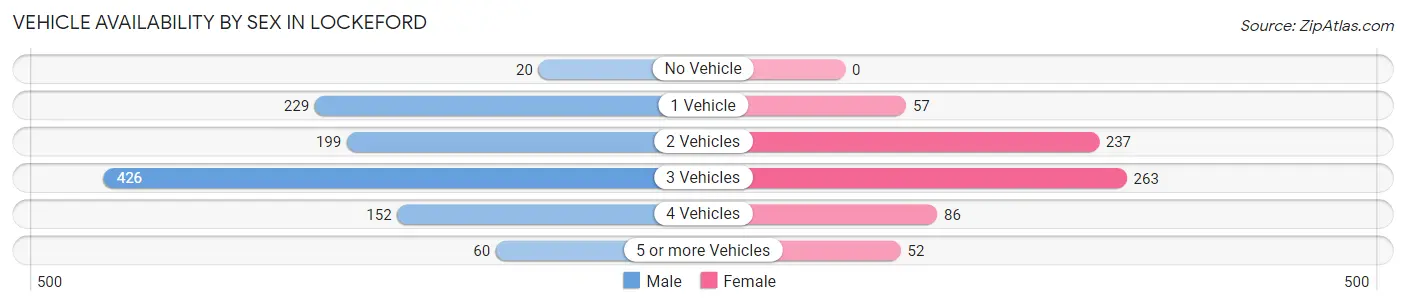
| Vehicles Available | Male | Female |
| No Vehicle | 20 (1.8%) | 0 (0.0%) |
| 1 Vehicle | 229 (21.1%) | 57 (8.2%) |
| 2 Vehicles | 199 (18.3%) | 237 (34.1%) |
| 3 Vehicles | 426 (39.2%) | 263 (37.8%) |
| 4 Vehicles | 152 (14.0%) | 86 (12.4%) |
| 5 or more Vehicles | 60 (5.5%) | 52 (7.5%) |
| Total | 1,086 (100.0%) | 695 (100.0%) |
Commute Time in Lockeford
The most frequently occuring commute durations in Lockeford are 30 to 34 minutes (303 commuters, 18.0%), 25 to 29 minutes (216 commuters, 12.8%), and 5 to 9 minutes (204 commuters, 12.1%).
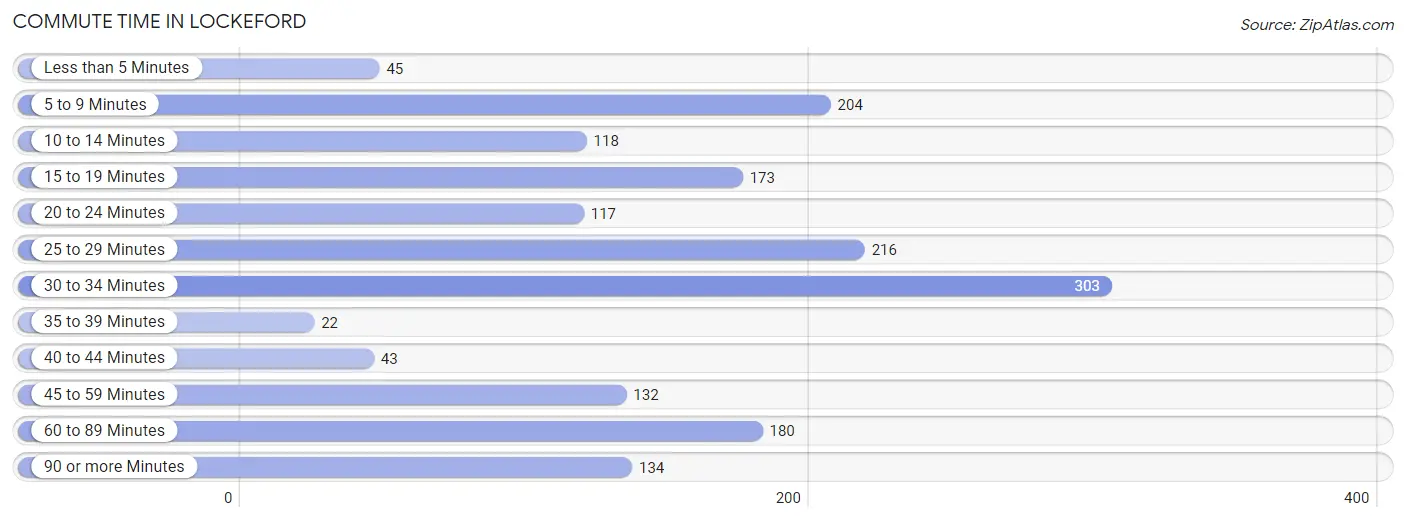
| Commute Time | # Commuters | % Commuters |
| Less than 5 Minutes | 45 | 2.7% |
| 5 to 9 Minutes | 204 | 12.1% |
| 10 to 14 Minutes | 118 | 7.0% |
| 15 to 19 Minutes | 173 | 10.2% |
| 20 to 24 Minutes | 117 | 6.9% |
| 25 to 29 Minutes | 216 | 12.8% |
| 30 to 34 Minutes | 303 | 18.0% |
| 35 to 39 Minutes | 22 | 1.3% |
| 40 to 44 Minutes | 43 | 2.5% |
| 45 to 59 Minutes | 132 | 7.8% |
| 60 to 89 Minutes | 180 | 10.7% |
| 90 or more Minutes | 134 | 7.9% |
Commute Time by Sex in Lockeford
The most common commute times in Lockeford are 5 to 9 minutes (175 commuters, 16.7%) for males and 30 to 34 minutes (163 commuters, 25.5%) for females.
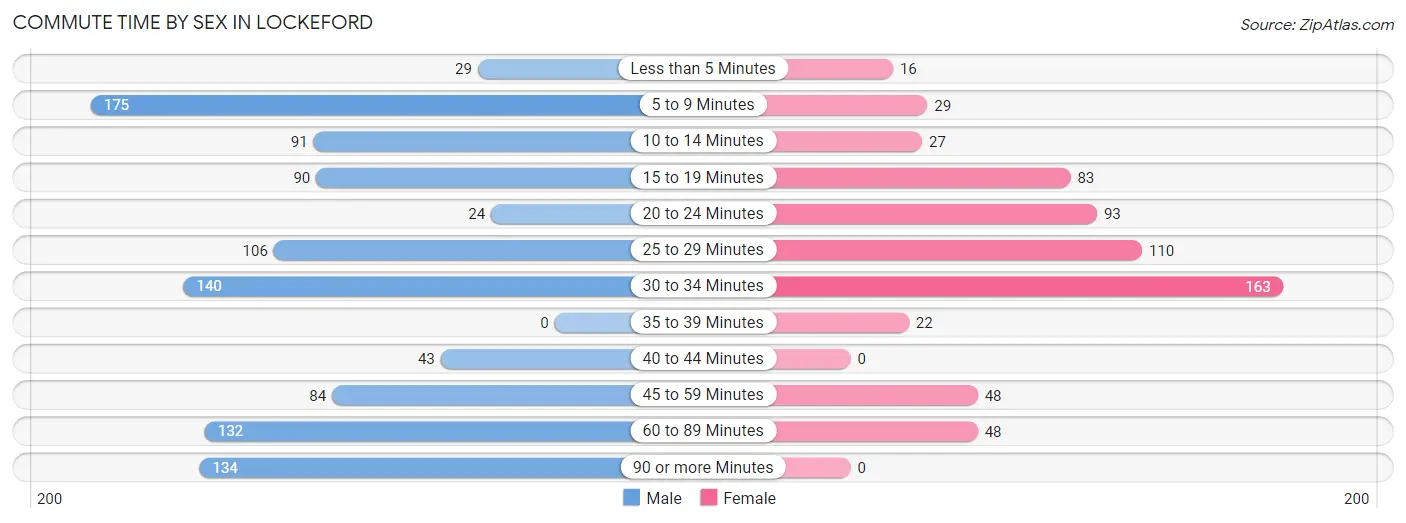
| Commute Time | Male | Female |
| Less than 5 Minutes | 29 (2.8%) | 16 (2.5%) |
| 5 to 9 Minutes | 175 (16.7%) | 29 (4.5%) |
| 10 to 14 Minutes | 91 (8.7%) | 27 (4.2%) |
| 15 to 19 Minutes | 90 (8.6%) | 83 (13.0%) |
| 20 to 24 Minutes | 24 (2.3%) | 93 (14.5%) |
| 25 to 29 Minutes | 106 (10.1%) | 110 (17.2%) |
| 30 to 34 Minutes | 140 (13.4%) | 163 (25.5%) |
| 35 to 39 Minutes | 0 (0.0%) | 22 (3.4%) |
| 40 to 44 Minutes | 43 (4.1%) | 0 (0.0%) |
| 45 to 59 Minutes | 84 (8.0%) | 48 (7.5%) |
| 60 to 89 Minutes | 132 (12.6%) | 48 (7.5%) |
| 90 or more Minutes | 134 (12.8%) | 0 (0.0%) |
Time of Departure to Work by Sex in Lockeford
The most frequent times of departure to work in Lockeford are 7:30 AM to 7:59 AM (178, 17.0%) for males and 7:00 AM to 7:29 AM (203, 31.8%) for females.
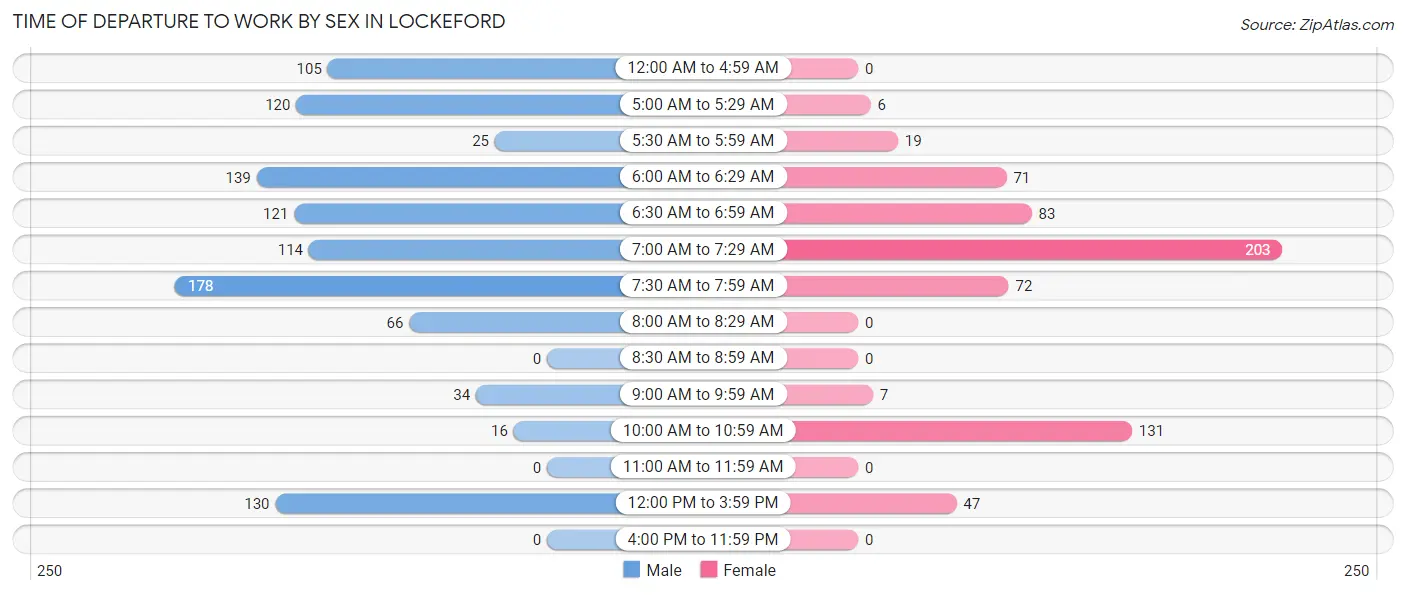
| Time of Departure | Male | Female |
| 12:00 AM to 4:59 AM | 105 (10.0%) | 0 (0.0%) |
| 5:00 AM to 5:29 AM | 120 (11.5%) | 6 (0.9%) |
| 5:30 AM to 5:59 AM | 25 (2.4%) | 19 (3.0%) |
| 6:00 AM to 6:29 AM | 139 (13.3%) | 71 (11.1%) |
| 6:30 AM to 6:59 AM | 121 (11.6%) | 83 (13.0%) |
| 7:00 AM to 7:29 AM | 114 (10.9%) | 203 (31.8%) |
| 7:30 AM to 7:59 AM | 178 (17.0%) | 72 (11.3%) |
| 8:00 AM to 8:29 AM | 66 (6.3%) | 0 (0.0%) |
| 8:30 AM to 8:59 AM | 0 (0.0%) | 0 (0.0%) |
| 9:00 AM to 9:59 AM | 34 (3.2%) | 7 (1.1%) |
| 10:00 AM to 10:59 AM | 16 (1.5%) | 131 (20.5%) |
| 11:00 AM to 11:59 AM | 0 (0.0%) | 0 (0.0%) |
| 12:00 PM to 3:59 PM | 130 (12.4%) | 47 (7.4%) |
| 4:00 PM to 11:59 PM | 0 (0.0%) | 0 (0.0%) |
| Total | 1,048 (100.0%) | 639 (100.0%) |
Housing Occupancy in Lockeford
Occupancy by Ownership in Lockeford
Of the total 1,506 dwellings in Lockeford, owner-occupied units account for 1,263 (83.9%), while renter-occupied units make up 243 (16.1%).
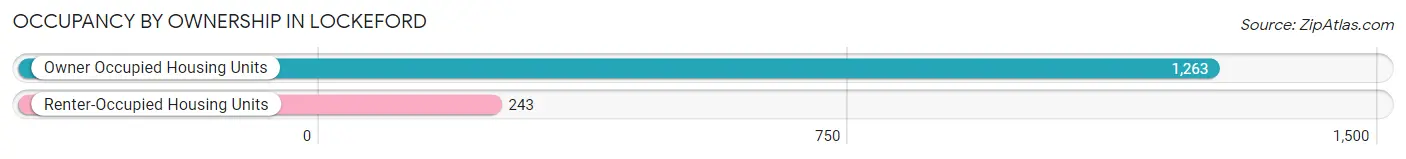
| Occupancy | # Housing Units | % Housing Units |
| Owner Occupied Housing Units | 1,263 | 83.9% |
| Renter-Occupied Housing Units | 243 | 16.1% |
| Total Occupied Housing Units | 1,506 | 100.0% |
Occupancy by Household Size in Lockeford
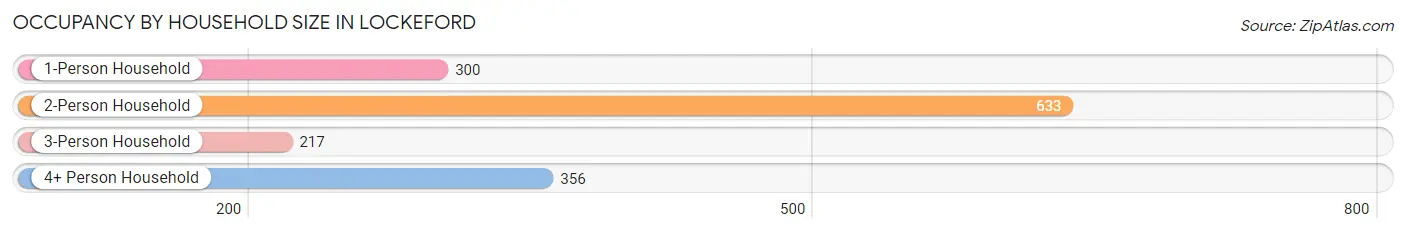
| Household Size | # Housing Units | % Housing Units |
| 1-Person Household | 300 | 19.9% |
| 2-Person Household | 633 | 42.0% |
| 3-Person Household | 217 | 14.4% |
| 4+ Person Household | 356 | 23.6% |
| Total Housing Units | 1,506 | 100.0% |
Occupancy by Ownership by Household Size in Lockeford
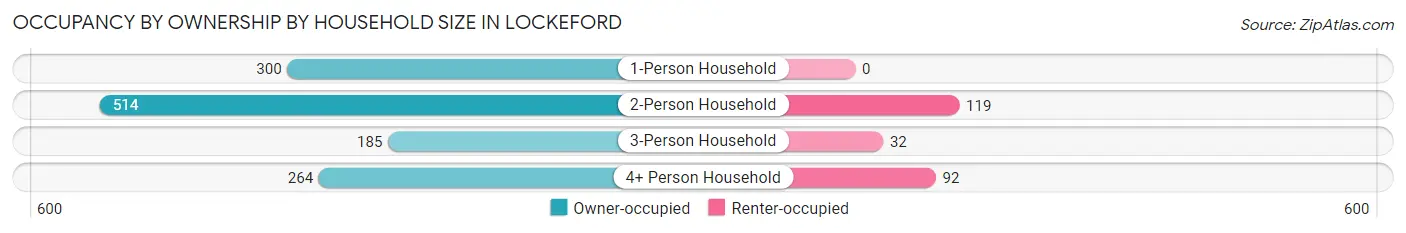
| Household Size | Owner-occupied | Renter-occupied |
| 1-Person Household | 300 (100.0%) | 0 (0.0%) |
| 2-Person Household | 514 (81.2%) | 119 (18.8%) |
| 3-Person Household | 185 (85.3%) | 32 (14.7%) |
| 4+ Person Household | 264 (74.2%) | 92 (25.8%) |
| Total Housing Units | 1,263 (83.9%) | 243 (16.1%) |
Occupancy by Educational Attainment in Lockeford
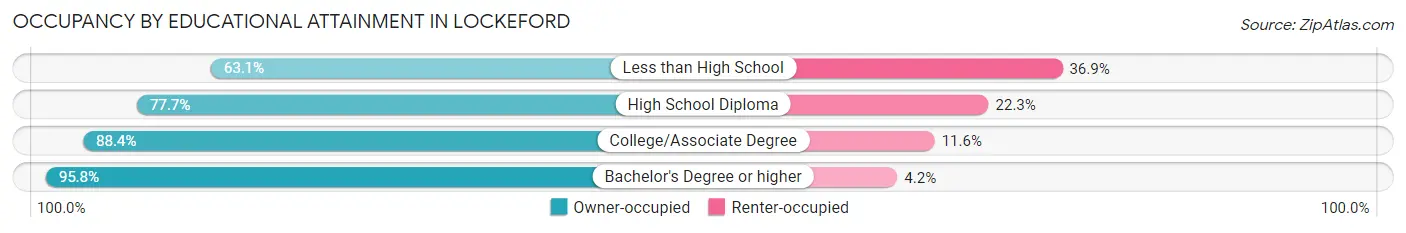
| Household Size | Owner-occupied | Renter-occupied |
| Less than High School | 99 (63.1%) | 58 (36.9%) |
| High School Diploma | 373 (77.7%) | 107 (22.3%) |
| College/Associate Degree | 495 (88.4%) | 65 (11.6%) |
| Bachelor's Degree or higher | 296 (95.8%) | 13 (4.2%) |
Occupancy by Age of Householder in Lockeford
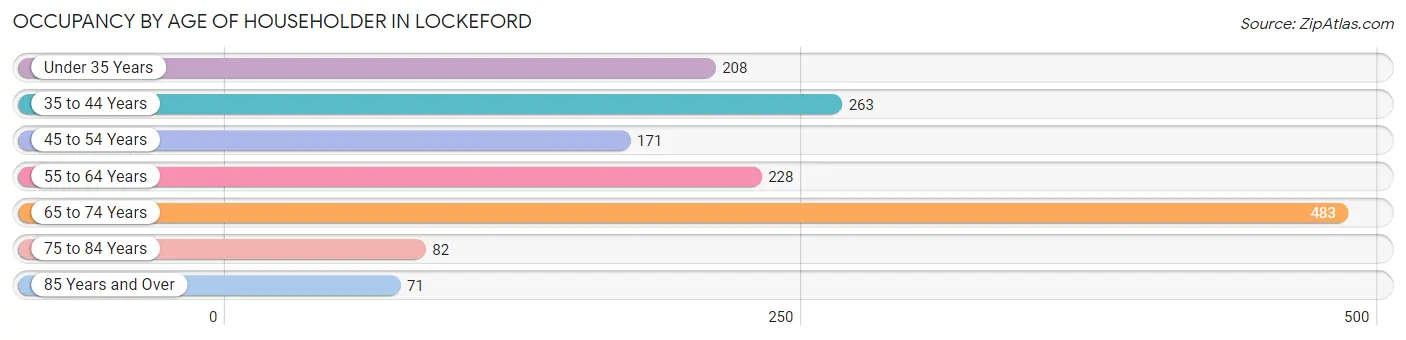
| Age Bracket | # Households | % Households |
| Under 35 Years | 208 | 13.8% |
| 35 to 44 Years | 263 | 17.5% |
| 45 to 54 Years | 171 | 11.4% |
| 55 to 64 Years | 228 | 15.1% |
| 65 to 74 Years | 483 | 32.1% |
| 75 to 84 Years | 82 | 5.4% |
| 85 Years and Over | 71 | 4.7% |
| Total | 1,506 | 100.0% |
Housing Finances in Lockeford
Median Income by Occupancy in Lockeford
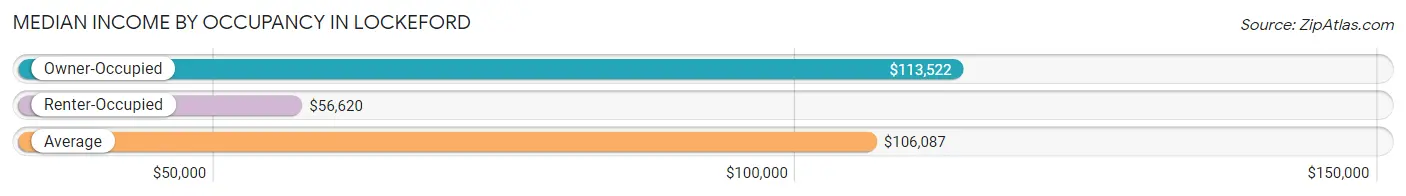
| Occupancy Type | # Households | Median Income |
| Owner-Occupied | 1,263 (83.9%) | $113,522 |
| Renter-Occupied | 243 (16.1%) | $56,620 |
| Average | 1,506 (100.0%) | $106,087 |
Occupancy by Householder Income Bracket in Lockeford
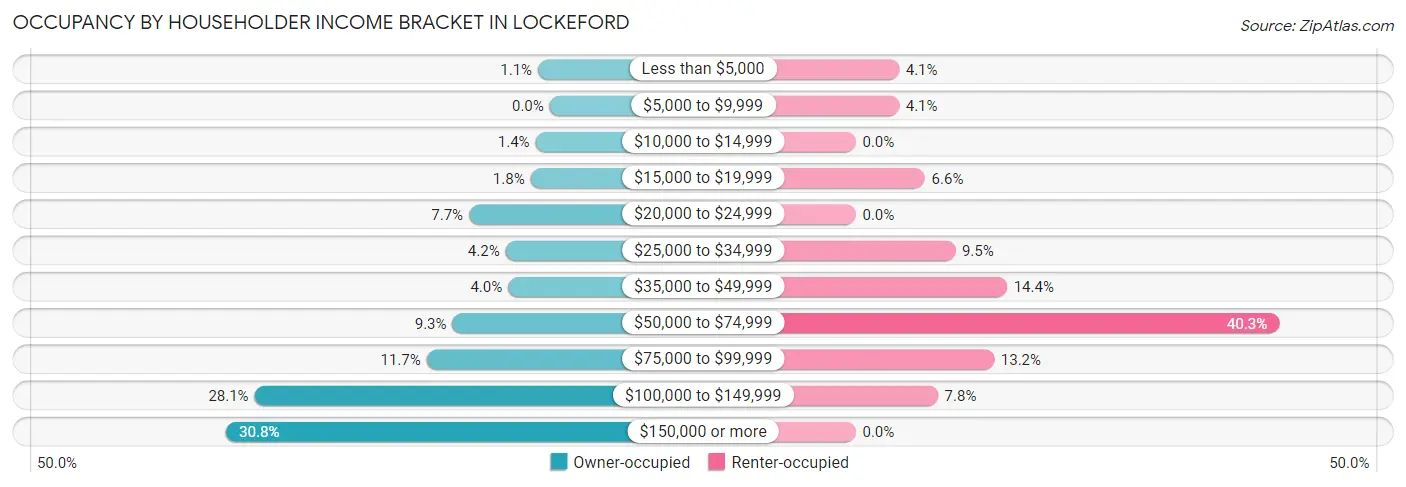
| Income Bracket | Owner-occupied | Renter-occupied |
| Less than $5,000 | 14 (1.1%) | 10 (4.1%) |
| $5,000 to $9,999 | 0 (0.0%) | 10 (4.1%) |
| $10,000 to $14,999 | 17 (1.3%) | 0 (0.0%) |
| $15,000 to $19,999 | 23 (1.8%) | 16 (6.6%) |
| $20,000 to $24,999 | 97 (7.7%) | 0 (0.0%) |
| $25,000 to $34,999 | 53 (4.2%) | 23 (9.5%) |
| $35,000 to $49,999 | 50 (4.0%) | 35 (14.4%) |
| $50,000 to $74,999 | 117 (9.3%) | 98 (40.3%) |
| $75,000 to $99,999 | 148 (11.7%) | 32 (13.2%) |
| $100,000 to $149,999 | 355 (28.1%) | 19 (7.8%) |
| $150,000 or more | 389 (30.8%) | 0 (0.0%) |
| Total | 1,263 (100.0%) | 243 (100.0%) |
Monthly Housing Cost Tiers in Lockeford
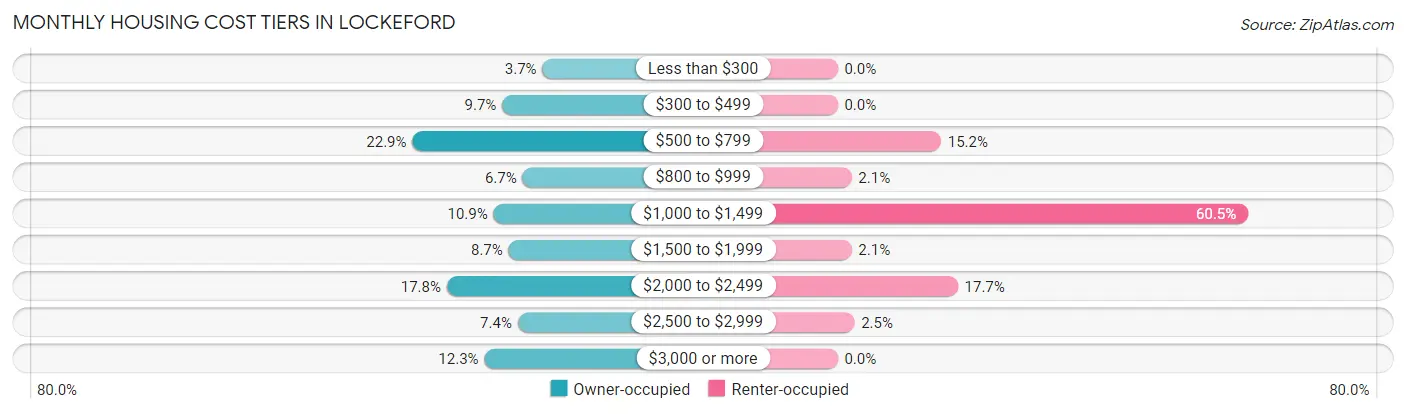
| Monthly Cost | Owner-occupied | Renter-occupied |
| Less than $300 | 47 (3.7%) | 0 (0.0%) |
| $300 to $499 | 122 (9.7%) | 0 (0.0%) |
| $500 to $799 | 289 (22.9%) | 37 (15.2%) |
| $800 to $999 | 84 (6.7%) | 5 (2.1%) |
| $1,000 to $1,499 | 138 (10.9%) | 147 (60.5%) |
| $1,500 to $1,999 | 110 (8.7%) | 5 (2.1%) |
| $2,000 to $2,499 | 225 (17.8%) | 43 (17.7%) |
| $2,500 to $2,999 | 93 (7.4%) | 6 (2.5%) |
| $3,000 or more | 155 (12.3%) | 0 (0.0%) |
| Total | 1,263 (100.0%) | 243 (100.0%) |
Physical Housing Characteristics in Lockeford
Housing Structures in Lockeford
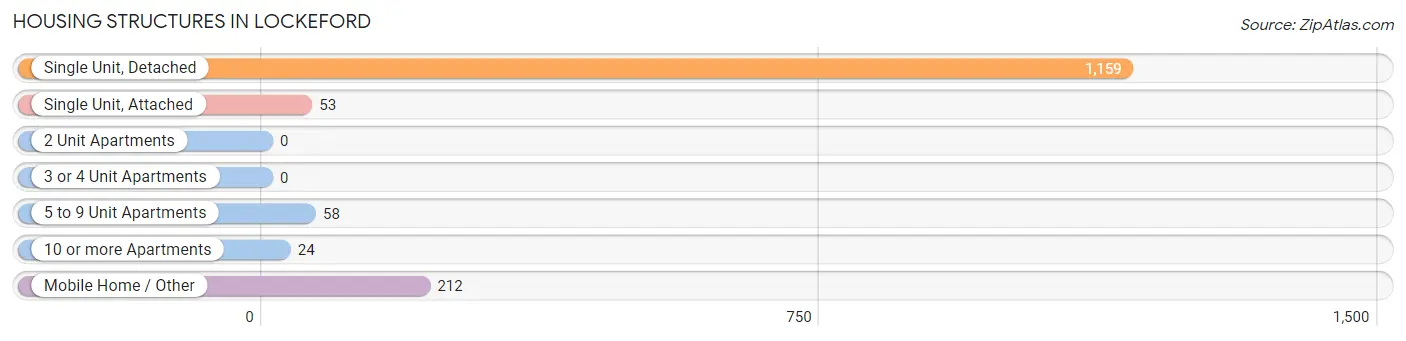
| Structure Type | # Housing Units | % Housing Units |
| Single Unit, Detached | 1,159 | 77.0% |
| Single Unit, Attached | 53 | 3.5% |
| 2 Unit Apartments | 0 | 0.0% |
| 3 or 4 Unit Apartments | 0 | 0.0% |
| 5 to 9 Unit Apartments | 58 | 3.8% |
| 10 or more Apartments | 24 | 1.6% |
| Mobile Home / Other | 212 | 14.1% |
| Total | 1,506 | 100.0% |
Housing Structures by Occupancy in Lockeford
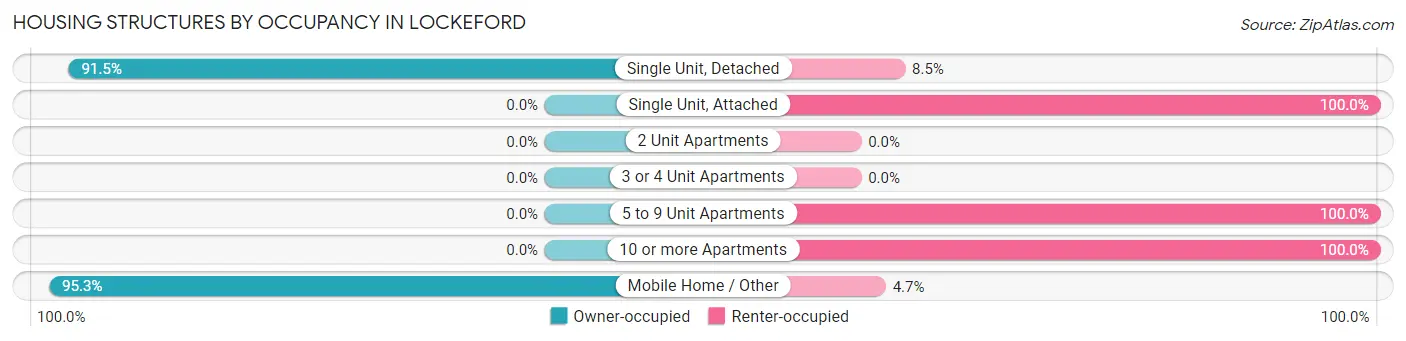
| Structure Type | Owner-occupied | Renter-occupied |
| Single Unit, Detached | 1,061 (91.5%) | 98 (8.5%) |
| Single Unit, Attached | 0 (0.0%) | 53 (100.0%) |
| 2 Unit Apartments | 0 (0.0%) | 0 (0.0%) |
| 3 or 4 Unit Apartments | 0 (0.0%) | 0 (0.0%) |
| 5 to 9 Unit Apartments | 0 (0.0%) | 58 (100.0%) |
| 10 or more Apartments | 0 (0.0%) | 24 (100.0%) |
| Mobile Home / Other | 202 (95.3%) | 10 (4.7%) |
| Total | 1,263 (83.9%) | 243 (16.1%) |
Housing Structures by Number of Rooms in Lockeford
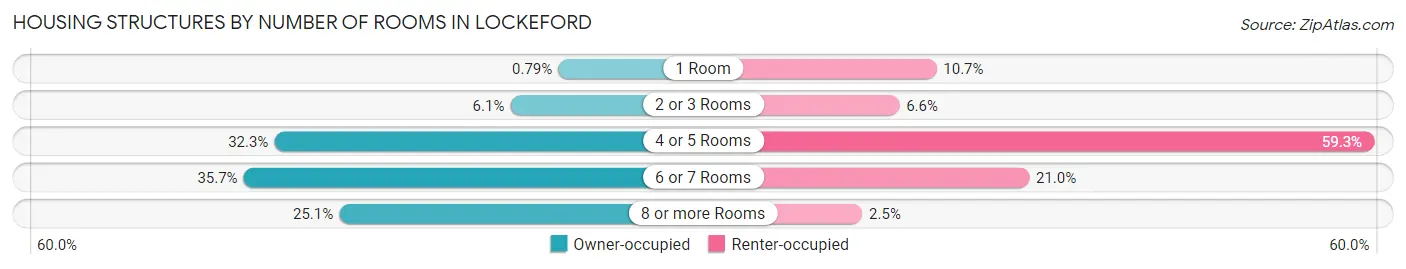
| Number of Rooms | Owner-occupied | Renter-occupied |
| 1 Room | 10 (0.8%) | 26 (10.7%) |
| 2 or 3 Rooms | 77 (6.1%) | 16 (6.6%) |
| 4 or 5 Rooms | 408 (32.3%) | 144 (59.3%) |
| 6 or 7 Rooms | 451 (35.7%) | 51 (21.0%) |
| 8 or more Rooms | 317 (25.1%) | 6 (2.5%) |
| Total | 1,263 (100.0%) | 243 (100.0%) |
Housing Structure by Heating Type in Lockeford
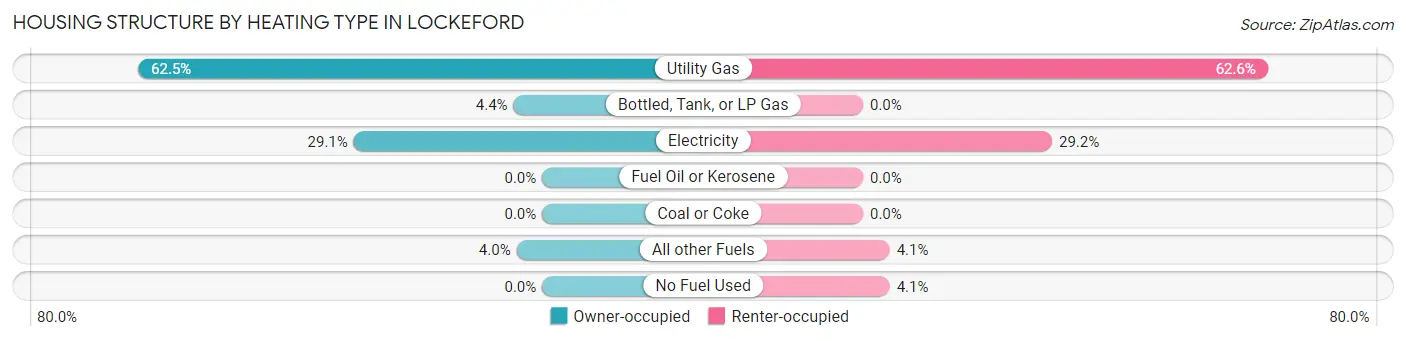
| Heating Type | Owner-occupied | Renter-occupied |
| Utility Gas | 789 (62.5%) | 152 (62.5%) |
| Bottled, Tank, or LP Gas | 56 (4.4%) | 0 (0.0%) |
| Electricity | 368 (29.1%) | 71 (29.2%) |
| Fuel Oil or Kerosene | 0 (0.0%) | 0 (0.0%) |
| Coal or Coke | 0 (0.0%) | 0 (0.0%) |
| All other Fuels | 50 (4.0%) | 10 (4.1%) |
| No Fuel Used | 0 (0.0%) | 10 (4.1%) |
| Total | 1,263 (100.0%) | 243 (100.0%) |
Household Vehicle Usage in Lockeford
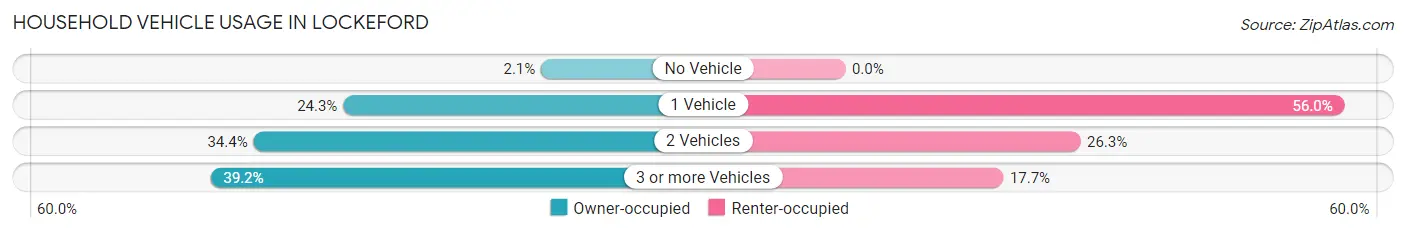
| Vehicles per Household | Owner-occupied | Renter-occupied |
| No Vehicle | 27 (2.1%) | 0 (0.0%) |
| 1 Vehicle | 307 (24.3%) | 136 (56.0%) |
| 2 Vehicles | 434 (34.4%) | 64 (26.3%) |
| 3 or more Vehicles | 495 (39.2%) | 43 (17.7%) |
| Total | 1,263 (100.0%) | 243 (100.0%) |
Real Estate & Mortgages in Lockeford
Real Estate and Mortgage Overview in Lockeford
| Characteristic | Without Mortgage | With Mortgage |
| Housing Units | 598 | 665 |
| Median Property Value | $350,000 | $516,200 |
| Median Household Income | $86,944 | $208 |
| Monthly Housing Costs | $709 | $155 |
| Real Estate Taxes | $3,179 | $11 |
Property Value by Mortgage Status in Lockeford
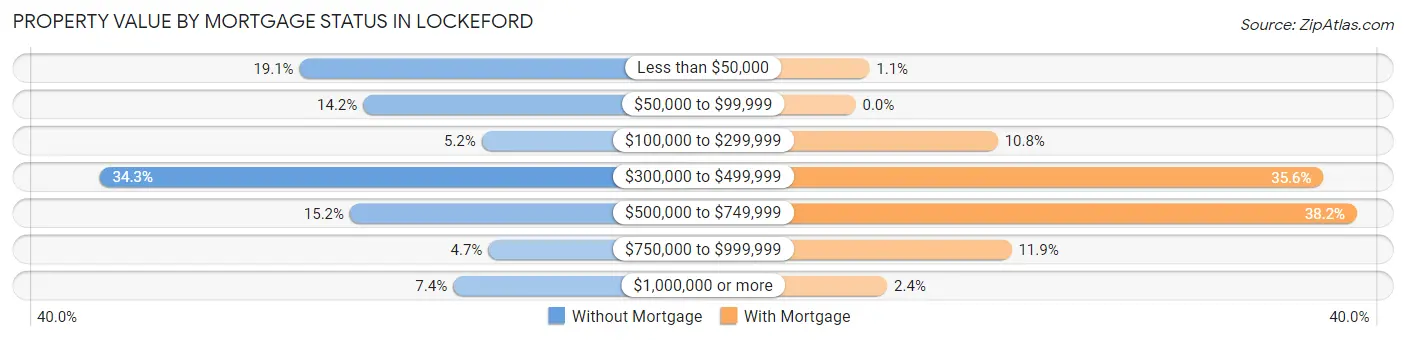
| Property Value | Without Mortgage | With Mortgage |
| Less than $50,000 | 114 (19.1%) | 7 (1.1%) |
| $50,000 to $99,999 | 85 (14.2%) | 0 (0.0%) |
| $100,000 to $299,999 | 31 (5.2%) | 72 (10.8%) |
| $300,000 to $499,999 | 205 (34.3%) | 237 (35.6%) |
| $500,000 to $749,999 | 91 (15.2%) | 254 (38.2%) |
| $750,000 to $999,999 | 28 (4.7%) | 79 (11.9%) |
| $1,000,000 or more | 44 (7.4%) | 16 (2.4%) |
| Total | 598 (100.0%) | 665 (100.0%) |
Household Income by Mortgage Status in Lockeford
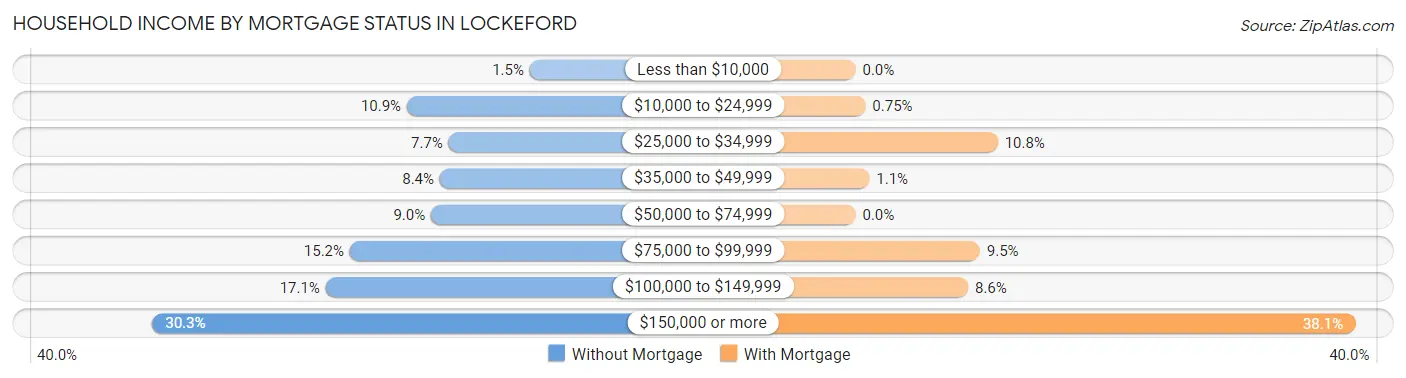
| Household Income | Without Mortgage | With Mortgage |
| Less than $10,000 | 9 (1.5%) | 0 (0.0%) |
| $10,000 to $24,999 | 65 (10.9%) | 5 (0.7%) |
| $25,000 to $34,999 | 46 (7.7%) | 72 (10.8%) |
| $35,000 to $49,999 | 50 (8.4%) | 7 (1.1%) |
| $50,000 to $74,999 | 54 (9.0%) | 0 (0.0%) |
| $75,000 to $99,999 | 91 (15.2%) | 63 (9.5%) |
| $100,000 to $149,999 | 102 (17.1%) | 57 (8.6%) |
| $150,000 or more | 181 (30.3%) | 253 (38.1%) |
| Total | 598 (100.0%) | 665 (100.0%) |
Property Value to Household Income Ratio in Lockeford
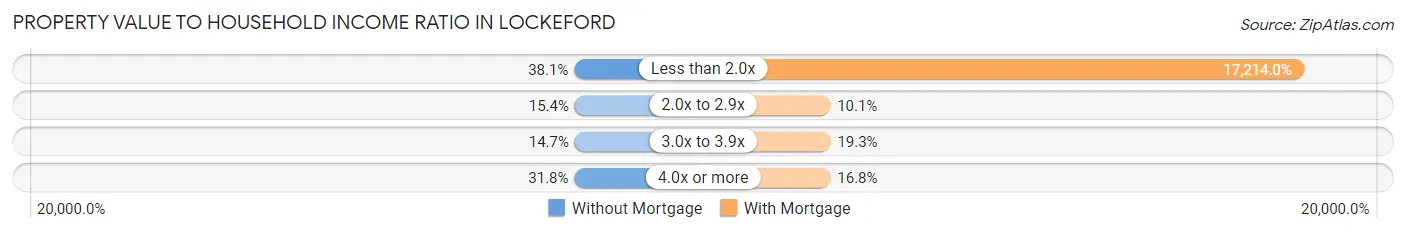
| Value-to-Income Ratio | Without Mortgage | With Mortgage |
| Less than 2.0x | 228 (38.1%) | 114,473 (17,214.0%) |
| 2.0x to 2.9x | 92 (15.4%) | 67 (10.1%) |
| 3.0x to 3.9x | 88 (14.7%) | 128 (19.3%) |
| 4.0x or more | 190 (31.8%) | 112 (16.8%) |
| Total | 598 (100.0%) | 665 (100.0%) |
Real Estate Taxes by Mortgage Status in Lockeford
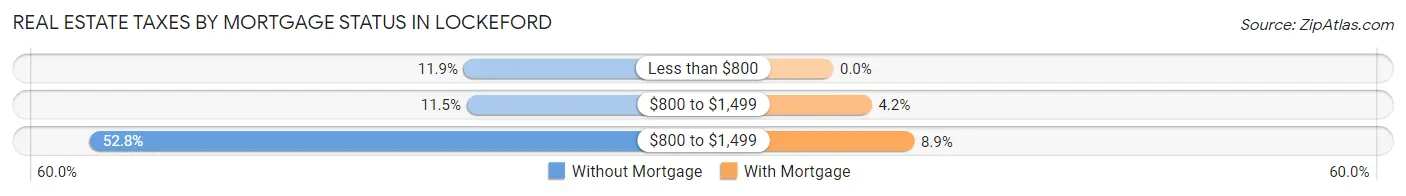
| Property Taxes | Without Mortgage | With Mortgage |
| Less than $800 | 71 (11.9%) | 0 (0.0%) |
| $800 to $1,499 | 69 (11.5%) | 28 (4.2%) |
| $800 to $1,499 | 316 (52.8%) | 59 (8.9%) |
| Total | 598 (100.0%) | 665 (100.0%) |
Health & Disability in Lockeford
Health Insurance Coverage by Age in Lockeford
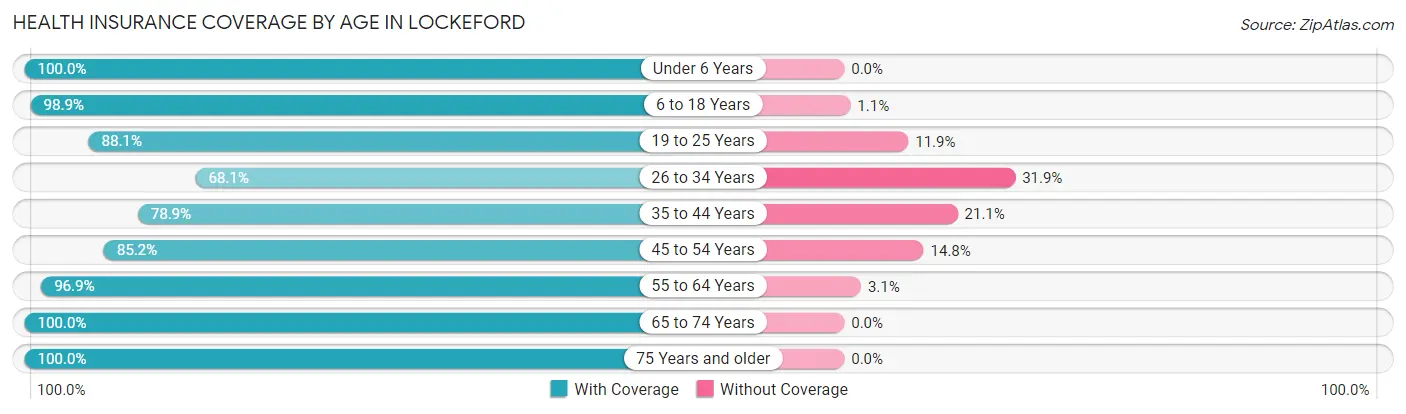
| Age Bracket | With Coverage | Without Coverage |
| Under 6 Years | 309 (100.0%) | 0 (0.0%) |
| 6 to 18 Years | 693 (98.9%) | 8 (1.1%) |
| 19 to 25 Years | 236 (88.1%) | 32 (11.9%) |
| 26 to 34 Years | 295 (68.1%) | 138 (31.9%) |
| 35 to 44 Years | 433 (78.9%) | 116 (21.1%) |
| 45 to 54 Years | 311 (85.2%) | 54 (14.8%) |
| 55 to 64 Years | 498 (96.9%) | 16 (3.1%) |
| 65 to 74 Years | 704 (100.0%) | 0 (0.0%) |
| 75 Years and older | 250 (100.0%) | 0 (0.0%) |
| Total | 3,729 (91.1%) | 364 (8.9%) |
Health Insurance Coverage by Citizenship Status in Lockeford
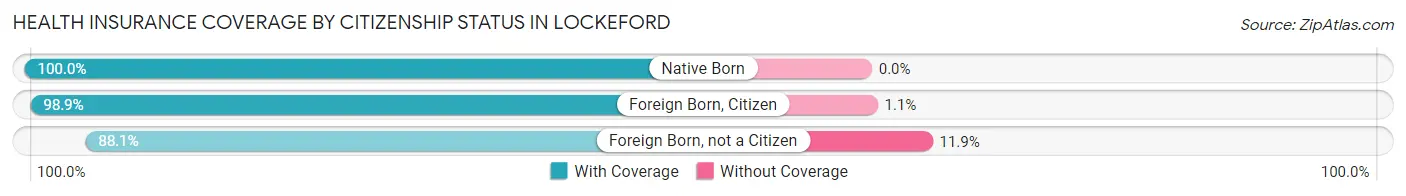
| Citizenship Status | With Coverage | Without Coverage |
| Native Born | 309 (100.0%) | 0 (0.0%) |
| Foreign Born, Citizen | 693 (98.9%) | 8 (1.1%) |
| Foreign Born, not a Citizen | 236 (88.1%) | 32 (11.9%) |
Health Insurance Coverage by Household Income in Lockeford
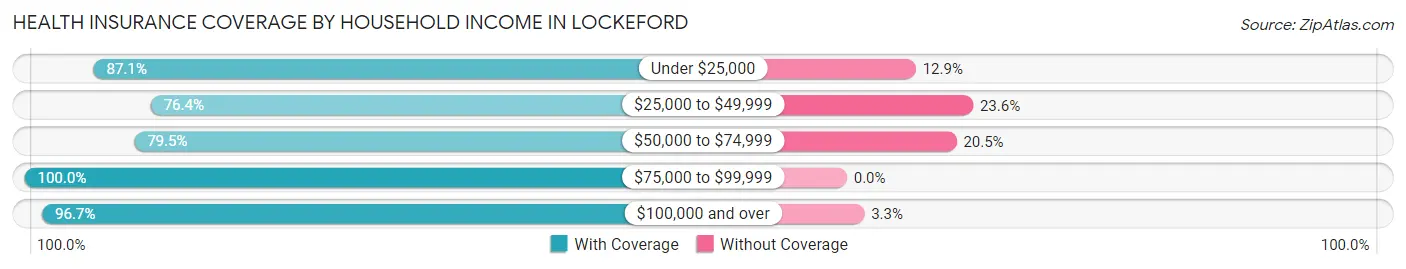
| Household Income | With Coverage | Without Coverage |
| Under $25,000 | 283 (87.1%) | 42 (12.9%) |
| $25,000 to $49,999 | 394 (76.4%) | 122 (23.6%) |
| $50,000 to $74,999 | 503 (79.5%) | 130 (20.5%) |
| $75,000 to $99,999 | 460 (100.0%) | 0 (0.0%) |
| $100,000 and over | 2,071 (96.7%) | 70 (3.3%) |
Public vs Private Health Insurance Coverage by Age in Lockeford
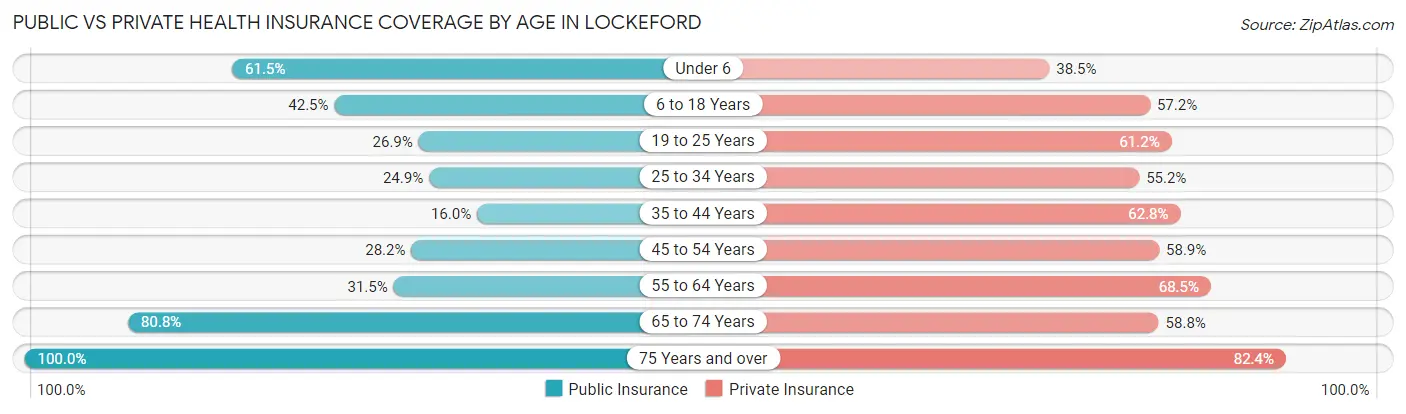
| Age Bracket | Public Insurance | Private Insurance |
| Under 6 | 190 (61.5%) | 119 (38.5%) |
| 6 to 18 Years | 298 (42.5%) | 401 (57.2%) |
| 19 to 25 Years | 72 (26.9%) | 164 (61.2%) |
| 25 to 34 Years | 108 (24.9%) | 239 (55.2%) |
| 35 to 44 Years | 88 (16.0%) | 345 (62.8%) |
| 45 to 54 Years | 103 (28.2%) | 215 (58.9%) |
| 55 to 64 Years | 162 (31.5%) | 352 (68.5%) |
| 65 to 74 Years | 569 (80.8%) | 414 (58.8%) |
| 75 Years and over | 250 (100.0%) | 206 (82.4%) |
| Total | 1,840 (45.0%) | 2,455 (60.0%) |
Disability Status by Sex by Age in Lockeford
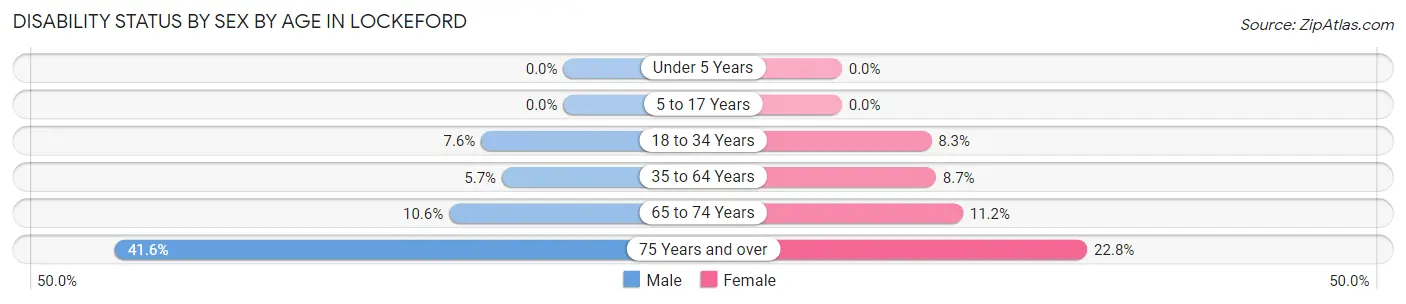
| Age Bracket | Male | Female |
| Under 5 Years | 0 (0.0%) | 0 (0.0%) |
| 5 to 17 Years | 0 (0.0%) | 0 (0.0%) |
| 18 to 34 Years | 36 (7.6%) | 19 (8.3%) |
| 35 to 64 Years | 37 (5.7%) | 68 (8.7%) |
| 65 to 74 Years | 35 (10.6%) | 42 (11.2%) |
| 75 Years and over | 62 (41.6%) | 23 (22.8%) |
Disability Class by Sex by Age in Lockeford
Disability Class: Hearing Difficulty
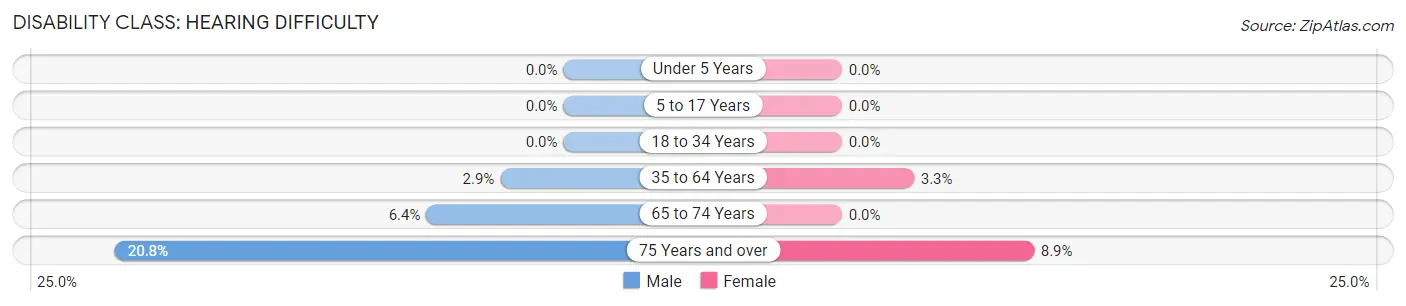
| Age Bracket | Male | Female |
| Under 5 Years | 0 (0.0%) | 0 (0.0%) |
| 5 to 17 Years | 0 (0.0%) | 0 (0.0%) |
| 18 to 34 Years | 0 (0.0%) | 0 (0.0%) |
| 35 to 64 Years | 19 (2.9%) | 26 (3.3%) |
| 65 to 74 Years | 21 (6.4%) | 0 (0.0%) |
| 75 Years and over | 31 (20.8%) | 9 (8.9%) |
Disability Class: Vision Difficulty
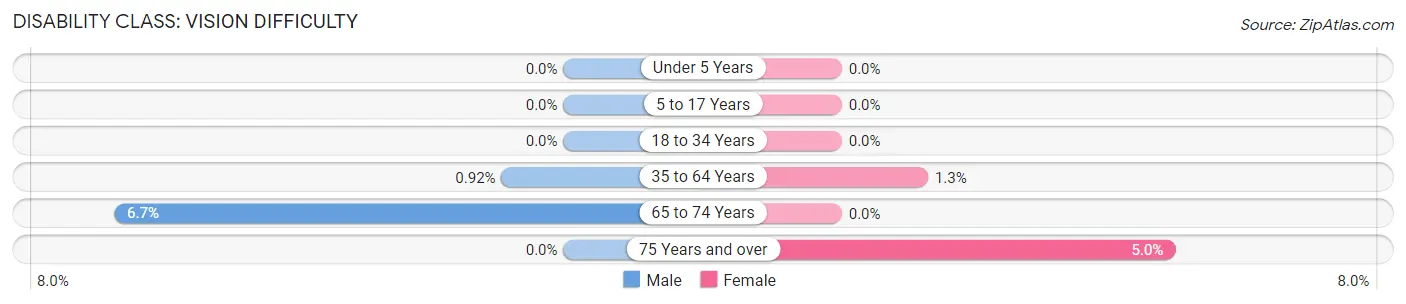
| Age Bracket | Male | Female |
| Under 5 Years | 0 (0.0%) | 0 (0.0%) |
| 5 to 17 Years | 0 (0.0%) | 0 (0.0%) |
| 18 to 34 Years | 0 (0.0%) | 0 (0.0%) |
| 35 to 64 Years | 6 (0.9%) | 10 (1.3%) |
| 65 to 74 Years | 22 (6.7%) | 0 (0.0%) |
| 75 Years and over | 0 (0.0%) | 5 (5.0%) |
Disability Class: Cognitive Difficulty
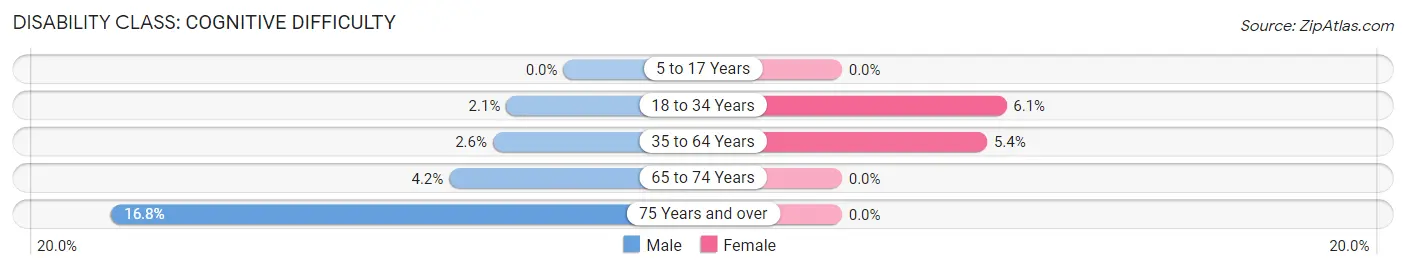
| Age Bracket | Male | Female |
| 5 to 17 Years | 0 (0.0%) | 0 (0.0%) |
| 18 to 34 Years | 10 (2.1%) | 14 (6.1%) |
| 35 to 64 Years | 17 (2.6%) | 42 (5.4%) |
| 65 to 74 Years | 14 (4.2%) | 0 (0.0%) |
| 75 Years and over | 25 (16.8%) | 0 (0.0%) |
Disability Class: Ambulatory Difficulty
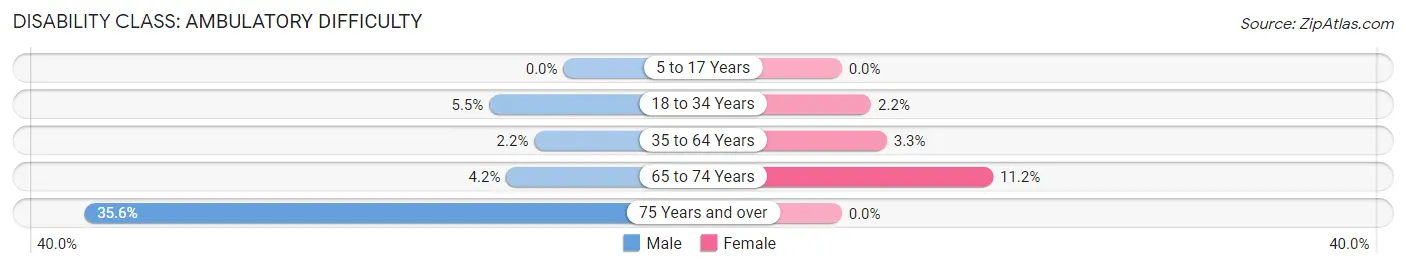
| Age Bracket | Male | Female |
| 5 to 17 Years | 0 (0.0%) | 0 (0.0%) |
| 18 to 34 Years | 26 (5.5%) | 5 (2.2%) |
| 35 to 64 Years | 14 (2.2%) | 26 (3.3%) |
| 65 to 74 Years | 14 (4.2%) | 42 (11.2%) |
| 75 Years and over | 53 (35.6%) | 0 (0.0%) |
Disability Class: Self-Care Difficulty
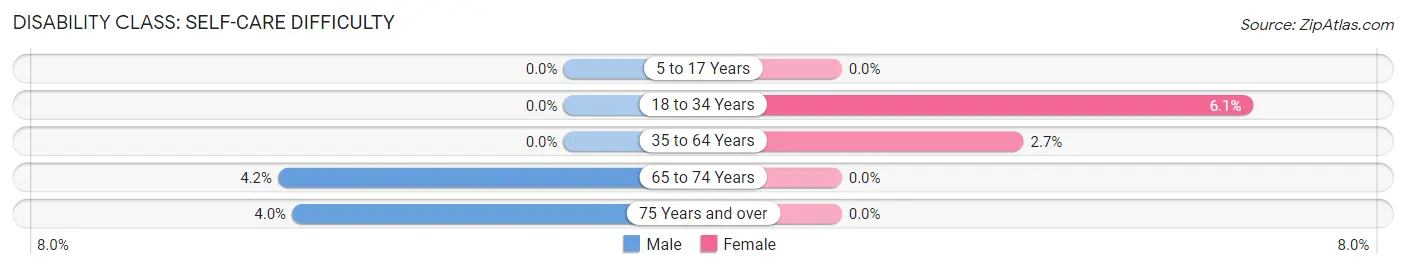
| Age Bracket | Male | Female |
| 5 to 17 Years | 0 (0.0%) | 0 (0.0%) |
| 18 to 34 Years | 0 (0.0%) | 14 (6.1%) |
| 35 to 64 Years | 0 (0.0%) | 21 (2.7%) |
| 65 to 74 Years | 14 (4.2%) | 0 (0.0%) |
| 75 Years and over | 6 (4.0%) | 0 (0.0%) |
Technology Access in Lockeford
Computing Device Access in Lockeford
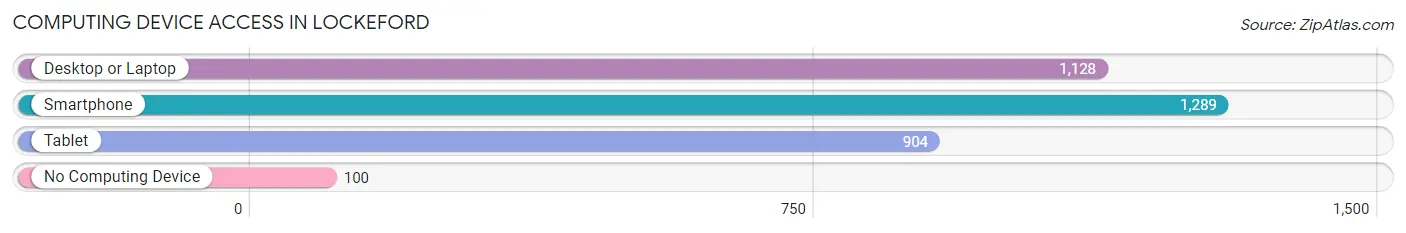
| Device Type | # Households | % Households |
| Desktop or Laptop | 1,128 | 74.9% |
| Smartphone | 1,289 | 85.6% |
| Tablet | 904 | 60.0% |
| No Computing Device | 100 | 6.6% |
| Total | 1,506 | 100.0% |
Internet Access in Lockeford
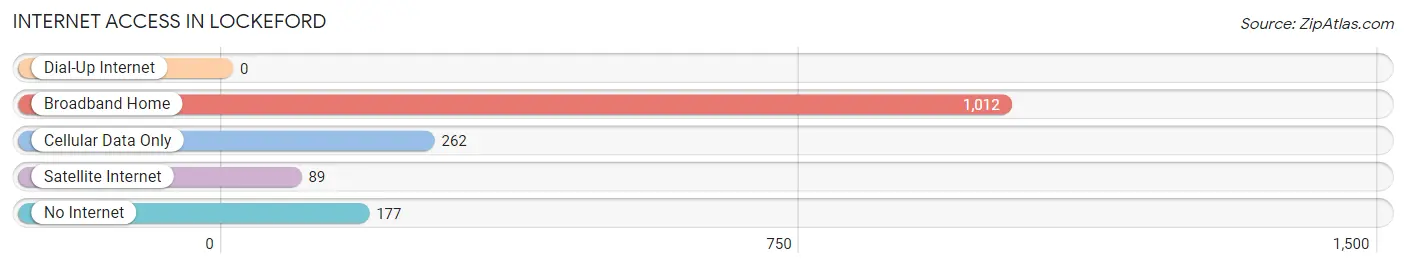
| Internet Type | # Households | % Households |
| Dial-Up Internet | 0 | 0.0% |
| Broadband Home | 1,012 | 67.2% |
| Cellular Data Only | 262 | 17.4% |
| Satellite Internet | 89 | 5.9% |
| No Internet | 177 | 11.7% |
| Total | 1,506 | 100.0% |
Lockeford Summary
Lockeford is a small unincorporated community located in San Joaquin County, California. It is situated in the Central Valley, approximately 20 miles south of Stockton and 40 miles east of Sacramento. The population of Lockeford was estimated to be 2,845 in 2019.
History
The area now known as Lockeford was originally inhabited by the Yokut Native American tribe. The first European settlers arrived in the area in the mid-1800s, and the town was officially founded in 1871 by George Locke, a rancher from Missouri. The town was named after him, and he established a post office in 1872.
In the late 1800s, Lockeford was a thriving agricultural community, with many farmers growing wheat, barley, and other crops. The town also had a blacksmith, a general store, and a hotel. In the early 1900s, the town began to decline as the railroad bypassed it and the population began to move away.
Geography
Lockeford is located in the Central Valley of California, approximately 20 miles south of Stockton and 40 miles east of Sacramento. The town is situated on the banks of the Mokelumne River, and is surrounded by rolling hills and farmland. The climate is mild, with hot summers and cool winters.
Economy
The economy of Lockeford is largely based on agriculture. The town is home to several wineries, and the surrounding area is known for its production of almonds, walnuts, and other crops. The town also has a few small businesses, including a gas station, a grocery store, and a few restaurants.
Demographics
As of 2019, the population of Lockeford was estimated to be 2,845. The racial makeup of the town was 79.3% White, 0.7% African American, 0.7% Native American, 0.7% Asian, 0.2% Pacific Islander, and 17.5% from other races. The median household income was $50,945, and the median age was 39.7 years.
Conclusion
Lockeford is a small unincorporated community located in San Joaquin County, California. It is situated in the Central Valley, approximately 20 miles south of Stockton and 40 miles east of Sacramento. The population of Lockeford was estimated to be 2,845 in 2019. The economy of Lockeford is largely based on agriculture, and the town is home to several wineries. The racial makeup of the town was 79.3% White, 0.7% African American, 0.7% Native American, 0.7% Asian, 0.2% Pacific Islander, and 17.5% from other races. The median household income was $50,945, and the median age was 39.7 years.
Common Questions
What is Per Capita Income in Lockeford?
Per Capita income in Lockeford is $48,432.
What is the Median Family Income in Lockeford?
Median Family Income in Lockeford is $112,589.
What is the Median Household income in Lockeford?
Median Household Income in Lockeford is $106,087.
What is Income or Wage Gap in Lockeford?
Income or Wage Gap in Lockeford is 6.9%.
Women in Lockeford earn 93.1 cents for every dollar earned by a man.
What is Inequality or Gini Index in Lockeford?
Inequality or Gini Index in Lockeford is 0.46.
What is the Total Population of Lockeford?
Total Population of Lockeford is 4,126.
What is the Total Male Population of Lockeford?
Total Male Population of Lockeford is 2,274.
What is the Total Female Population of Lockeford?
Total Female Population of Lockeford is 1,852.
What is the Ratio of Males per 100 Females in Lockeford?
There are 122.79 Males per 100 Females in Lockeford.
What is the Ratio of Females per 100 Males in Lockeford?
There are 81.44 Females per 100 Males in Lockeford.
What is the Median Population Age in Lockeford?
Median Population Age in Lockeford is 42.1 Years.
What is the Average Family Size in Lockeford
Average Family Size in Lockeford is 3.2 People.
What is the Average Household Size in Lockeford
Average Household Size in Lockeford is 2.7 People.
How Large is the Labor Force in Lockeford?
There are 1,943 People in the Labor Forcein in Lockeford.
What is the Percentage of People in the Labor Force in Lockeford?
60.0% of People are in the Labor Force in Lockeford.
What is the Unemployment Rate in Lockeford?
Unemployment Rate in Lockeford is 6.3%.