Cities with the Highest Percentage of Population with a Degree in Engineering in Washington
RELATED REPORTS & OPTIONS
Engineering
Washington
Compare Cities
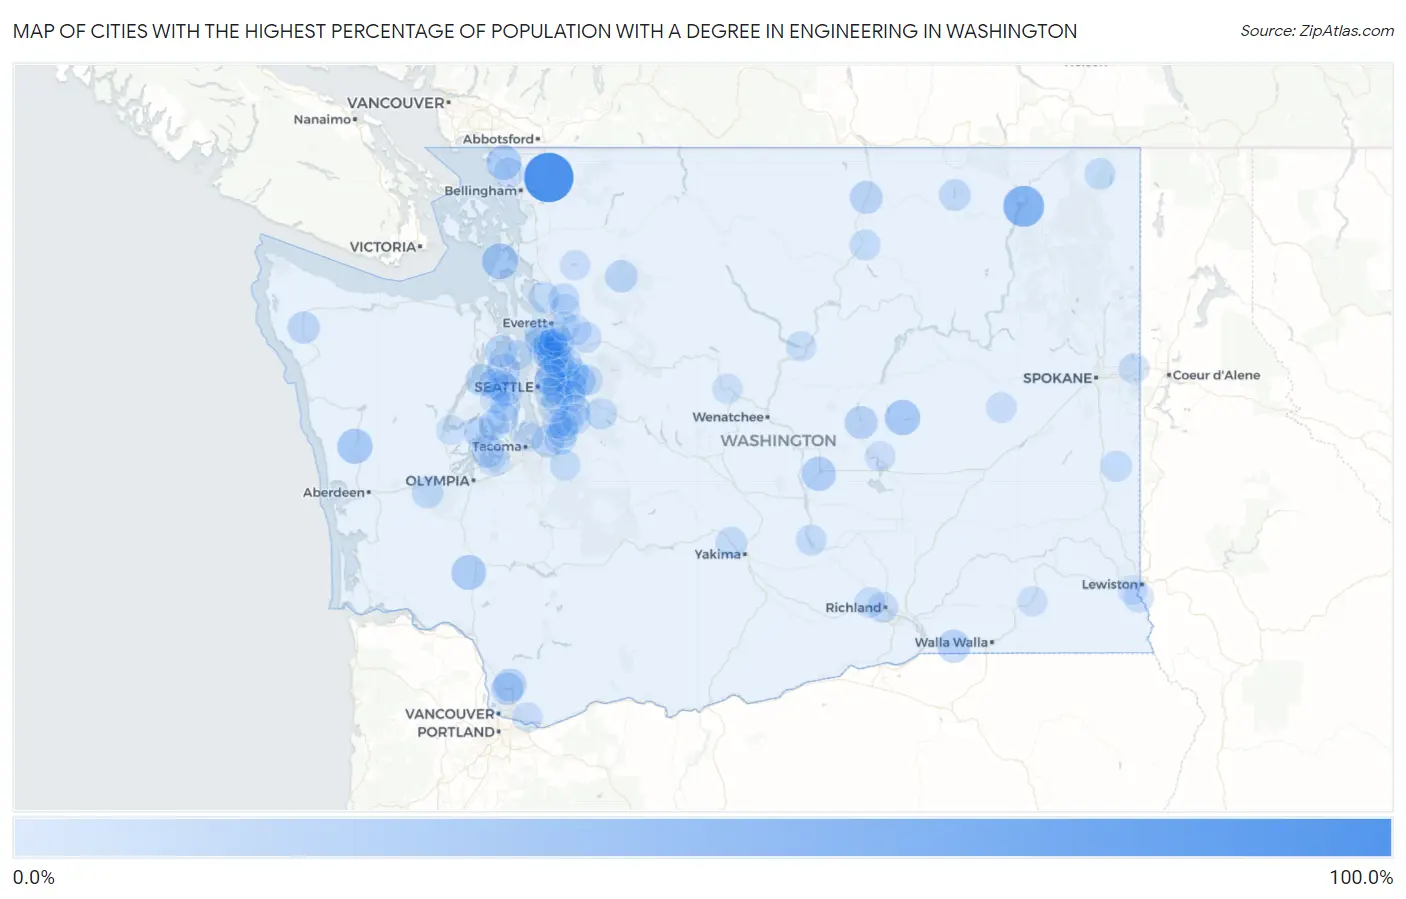
Map of Cities with the Highest Percentage of Population with a Degree in Engineering in Washington
0.0%
100.0%
Cities with the Highest Percentage of Population with a Degree in Engineering in Washington
| City | % Graduates | vs State | vs National | |
| 1. | Deming | 96.4% | 9.8%(+86.5)#1 | 7.6%(+88.7)#60 |
| 2. | Marcus | 57.7% | 9.8%(+47.9)#2 | 7.6%(+50.0)#131 |
| 3. | Pataha | 44.4% | 9.8%(+34.6)#3 | 7.6%(+36.8)#218 |
| 4. | Whidbey Island Station | 36.7% | 9.8%(+26.8)#4 | 7.6%(+29.0)#310 |
| 5. | Wilson Creek | 34.5% | 9.8%(+24.6)#5 | 7.6%(+26.8)#343 |
| 6. | Humptulips | 33.3% | 9.8%(+23.5)#6 | 7.6%(+25.7)#360 |
| 7. | Winlock | 31.6% | 9.8%(+21.8)#7 | 7.6%(+24.0)#402 |
| 8. | Custer | 31.0% | 9.8%(+21.2)#8 | 7.6%(+23.4)#413 |
| 9. | Beacon Hill | 30.2% | 9.8%(+20.4)#9 | 7.6%(+22.6)#435 |
| 10. | George | 29.4% | 9.8%(+19.6)#10 | 7.6%(+21.8)#462 |
| 11. | Bothell East | 26.2% | 9.8%(+16.4)#11 | 7.6%(+18.6)#586 |
| 12. | Ames Lake | 26.2% | 9.8%(+16.3)#12 | 7.6%(+18.5)#590 |
| 13. | Soap Lake | 24.5% | 9.8%(+14.7)#13 | 7.6%(+16.9)#695 |
| 14. | Touchet | 24.0% | 9.8%(+14.2)#14 | 7.6%(+16.4)#721 |
| 15. | Cherry Grove | 23.6% | 9.8%(+13.8)#15 | 7.6%(+16.0)#744 |
| 16. | Tonasket | 23.6% | 9.8%(+13.8)#16 | 7.6%(+16.0)#745 |
| 17. | Keyport | 23.4% | 9.8%(+13.6)#17 | 7.6%(+15.8)#754 |
| 18. | Longbranch | 22.6% | 9.8%(+12.7)#18 | 7.6%(+14.9)#802 |
| 19. | Dollars Corner | 22.6% | 9.8%(+12.7)#19 | 7.6%(+14.9)#803 |
| 20. | Union Hill Novelty Hill | 22.4% | 9.8%(+12.5)#20 | 7.6%(+14.7)#818 |
| 21. | Enetai | 22.2% | 9.8%(+12.4)#21 | 7.6%(+14.6)#824 |
| 22. | Darrington | 21.8% | 9.8%(+11.9)#22 | 7.6%(+14.1)#864 |
| 23. | Lofall | 21.7% | 9.8%(+11.9)#23 | 7.6%(+14.1)#865 |
| 24. | Algona | 21.4% | 9.8%(+11.5)#24 | 7.6%(+13.7)#908 |
| 25. | Redmond | 21.2% | 9.8%(+11.4)#25 | 7.6%(+13.6)#920 |
| 26. | Forks | 21.2% | 9.8%(+11.4)#26 | 7.6%(+13.5)#924 |
| 27. | Bellevue | 20.0% | 9.8%(+10.2)#27 | 7.6%(+12.4)#1,022 |
| 28. | Grapeview | 20.0% | 9.8%(+10.2)#28 | 7.6%(+12.4)#1,027 |
| 29. | Seabeck | 19.9% | 9.8%(+10.0)#29 | 7.6%(+12.2)#1,082 |
| 30. | Lake Holm | 19.8% | 9.8%(+10.0)#30 | 7.6%(+12.2)#1,084 |
| 31. | Burley | 19.8% | 9.8%(+9.92)#31 | 7.6%(+12.1)#1,091 |
| 32. | Malone | 19.5% | 9.8%(+9.71)#32 | 7.6%(+11.9)#1,105 |
| 33. | Curlew Lake | 19.2% | 9.8%(+9.33)#33 | 7.6%(+11.5)#1,147 |
| 34. | Tracyton | 18.9% | 9.8%(+9.09)#34 | 7.6%(+11.3)#1,171 |
| 35. | Sammamish | 18.8% | 9.8%(+9.01)#35 | 7.6%(+11.2)#1,183 |
| 36. | Clyde Hill | 18.6% | 9.8%(+8.72)#36 | 7.6%(+10.9)#1,207 |
| 37. | Issaquah | 18.5% | 9.8%(+8.71)#37 | 7.6%(+10.9)#1,208 |
| 38. | Mill Creek East | 18.5% | 9.8%(+8.62)#38 | 7.6%(+10.8)#1,219 |
| 39. | Newcastle | 18.4% | 9.8%(+8.54)#39 | 7.6%(+10.7)#1,228 |
| 40. | Alderwood Manor | 18.4% | 9.8%(+8.52)#40 | 7.6%(+10.7)#1,232 |
| 41. | Eschbach | 18.3% | 9.8%(+8.48)#41 | 7.6%(+10.7)#1,238 |
| 42. | Larch Way | 18.1% | 9.8%(+8.27)#42 | 7.6%(+10.5)#1,284 |
| 43. | Lake Goodwin | 17.4% | 9.8%(+7.59)#43 | 7.6%(+9.78)#1,367 |
| 44. | Wilderness Rim | 17.4% | 9.8%(+7.52)#44 | 7.6%(+9.70)#1,387 |
| 45. | Bothell West | 17.1% | 9.8%(+7.28)#45 | 7.6%(+9.47)#1,424 |
| 46. | Metaline | 16.7% | 9.8%(+6.83)#46 | 7.6%(+9.02)#1,531 |
| 47. | Sisco Heights | 16.6% | 9.8%(+6.80)#47 | 7.6%(+8.99)#1,539 |
| 48. | Clearview | 16.6% | 9.8%(+6.75)#48 | 7.6%(+8.94)#1,547 |
| 49. | Oakesdale | 16.5% | 9.8%(+6.64)#49 | 7.6%(+8.82)#1,572 |
| 50. | Stansberry Lake | 16.3% | 9.8%(+6.42)#50 | 7.6%(+8.61)#1,611 |
| 51. | Mirrormont | 16.2% | 9.8%(+6.37)#51 | 7.6%(+8.55)#1,622 |
| 52. | South Prairie | 16.0% | 9.8%(+6.17)#52 | 7.6%(+8.35)#1,651 |
| 53. | Lake Morton Berrydale | 16.0% | 9.8%(+6.16)#53 | 7.6%(+8.35)#1,656 |
| 54. | Mukilteo | 15.9% | 9.8%(+6.08)#54 | 7.6%(+8.26)#1,674 |
| 55. | Woodinville | 15.9% | 9.8%(+6.04)#55 | 7.6%(+8.22)#1,685 |
| 56. | Desert Aire | 15.8% | 9.8%(+5.95)#56 | 7.6%(+8.13)#1,713 |
| 57. | Cottage Lake | 15.8% | 9.8%(+5.94)#57 | 7.6%(+8.12)#1,714 |
| 58. | Kitsap Lake | 15.8% | 9.8%(+5.92)#58 | 7.6%(+8.11)#1,716 |
| 59. | Picnic Point | 15.7% | 9.8%(+5.88)#59 | 7.6%(+8.06)#1,731 |
| 60. | North Omak | 15.7% | 9.8%(+5.85)#60 | 7.6%(+8.04)#1,738 |
| 61. | Yarrow Point | 15.7% | 9.8%(+5.82)#61 | 7.6%(+8.01)#1,744 |
| 62. | Richland | 15.5% | 9.8%(+5.69)#62 | 7.6%(+7.88)#1,766 |
| 63. | Chico | 15.5% | 9.8%(+5.64)#63 | 7.6%(+7.83)#1,773 |
| 64. | Bothell | 15.4% | 9.8%(+5.54)#64 | 7.6%(+7.73)#1,800 |
| 65. | Shadow Lake | 15.2% | 9.8%(+5.39)#65 | 7.6%(+7.58)#1,824 |
| 66. | Carnation | 15.2% | 9.8%(+5.37)#66 | 7.6%(+7.55)#1,827 |
| 67. | West Richland | 14.7% | 9.8%(+4.88)#67 | 7.6%(+7.07)#1,928 |
| 68. | Otis Orchards East Farms | 14.4% | 9.8%(+4.57)#68 | 7.6%(+6.76)#1,995 |
| 69. | Woods Creek | 14.4% | 9.8%(+4.56)#69 | 7.6%(+6.75)#2,000 |
| 70. | Martha Lake | 14.2% | 9.8%(+4.41)#70 | 7.6%(+6.59)#2,082 |
| 71. | Lake Cavanaugh | 14.2% | 9.8%(+4.32)#71 | 7.6%(+6.50)#2,100 |
| 72. | Ferndale | 14.0% | 9.8%(+4.21)#72 | 7.6%(+6.39)#2,131 |
| 73. | Silver Firs | 14.0% | 9.8%(+4.20)#73 | 7.6%(+6.38)#2,135 |
| 74. | Anderson Island | 14.0% | 9.8%(+4.14)#74 | 7.6%(+6.32)#2,157 |
| 75. | Hobart | 13.9% | 9.8%(+4.11)#75 | 7.6%(+6.30)#2,165 |
| 76. | Lexington | 13.9% | 9.8%(+4.10)#76 | 7.6%(+6.28)#2,170 |
| 77. | Asotin | 13.9% | 9.8%(+4.09)#77 | 7.6%(+6.28)#2,172 |
| 78. | Harrington | 13.9% | 9.8%(+4.09)#78 | 7.6%(+6.28)#2,173 |
| 79. | Three Lakes | 13.9% | 9.8%(+4.07)#79 | 7.6%(+6.26)#2,174 |
| 80. | Eastmont | 13.4% | 9.8%(+3.54)#80 | 7.6%(+5.73)#2,347 |
| 81. | Fairwood Cdp King County | 13.4% | 9.8%(+3.53)#81 | 7.6%(+5.71)#2,352 |
| 82. | Moses Lake North | 13.3% | 9.8%(+3.50)#82 | 7.6%(+5.69)#2,359 |
| 83. | Chelan | 13.1% | 9.8%(+3.30)#83 | 7.6%(+5.49)#2,437 |
| 84. | Covington | 13.1% | 9.8%(+3.23)#84 | 7.6%(+5.42)#2,459 |
| 85. | Dash Point | 13.0% | 9.8%(+3.21)#85 | 7.6%(+5.40)#2,470 |
| 86. | Camas | 12.9% | 9.8%(+3.09)#86 | 7.6%(+5.28)#2,523 |
| 87. | Kirkland | 12.9% | 9.8%(+3.05)#87 | 7.6%(+5.23)#2,536 |
| 88. | Mill Creek | 12.9% | 9.8%(+3.02)#88 | 7.6%(+5.21)#2,547 |
| 89. | Renton | 12.8% | 9.8%(+2.98)#89 | 7.6%(+5.17)#2,557 |
| 90. | Lake Cassidy | 12.8% | 9.8%(+2.97)#90 | 7.6%(+5.16)#2,562 |
| 91. | Bremerton | 12.7% | 9.8%(+2.88)#91 | 7.6%(+5.07)#2,593 |
| 92. | Leavenworth | 12.7% | 9.8%(+2.86)#92 | 7.6%(+5.05)#2,606 |
| 93. | Bethel | 12.6% | 9.8%(+2.81)#93 | 7.6%(+4.99)#2,626 |
| 94. | Union | 12.6% | 9.8%(+2.78)#94 | 7.6%(+4.97)#2,632 |
| 95. | Bunk Foss | 12.4% | 9.8%(+2.59)#95 | 7.6%(+4.78)#2,727 |
| 96. | Mercer Island | 12.4% | 9.8%(+2.59)#96 | 7.6%(+4.77)#2,729 |
| 97. | Kingston | 12.4% | 9.8%(+2.59)#97 | 7.6%(+4.77)#2,730 |
| 98. | Dayton | 12.3% | 9.8%(+2.44)#98 | 7.6%(+4.63)#2,786 |
| 99. | Clarkston Heights Vineland | 12.2% | 9.8%(+2.34)#99 | 7.6%(+4.53)#2,818 |
| 100. | Kent | 12.1% | 9.8%(+2.30)#100 | 7.6%(+4.49)#2,837 |
Common Questions
What are the Top 10 Cities with the Highest Percentage of Population with a Degree in Engineering in Washington?
Top 10 Cities with the Highest Percentage of Population with a Degree in Engineering in Washington are:
#1
96.4%
#2
57.7%
#3
36.7%
#4
34.5%
#5
33.3%
#6
31.6%
#7
31.0%
#8
29.4%
#9
26.2%
#10
26.2%
What city has the Highest Percentage of Population with a Degree in Engineering in Washington?
Deming has the Highest Percentage of Population with a Degree in Engineering in Washington with 96.4%.
What is the Percentage of Population with a Degree in Engineering in the State of Washington?
Percentage of Population with a Degree in Engineering in Washington is 9.8%.
What is the Percentage of Population with a Degree in Engineering in the United States?
Percentage of Population with a Degree in Engineering in the United States is 7.6%.