Cities with the Highest Percentage of Population with a Degree in Engineering in New Hampshire
RELATED REPORTS & OPTIONS
Engineering
New Hampshire
Compare Cities
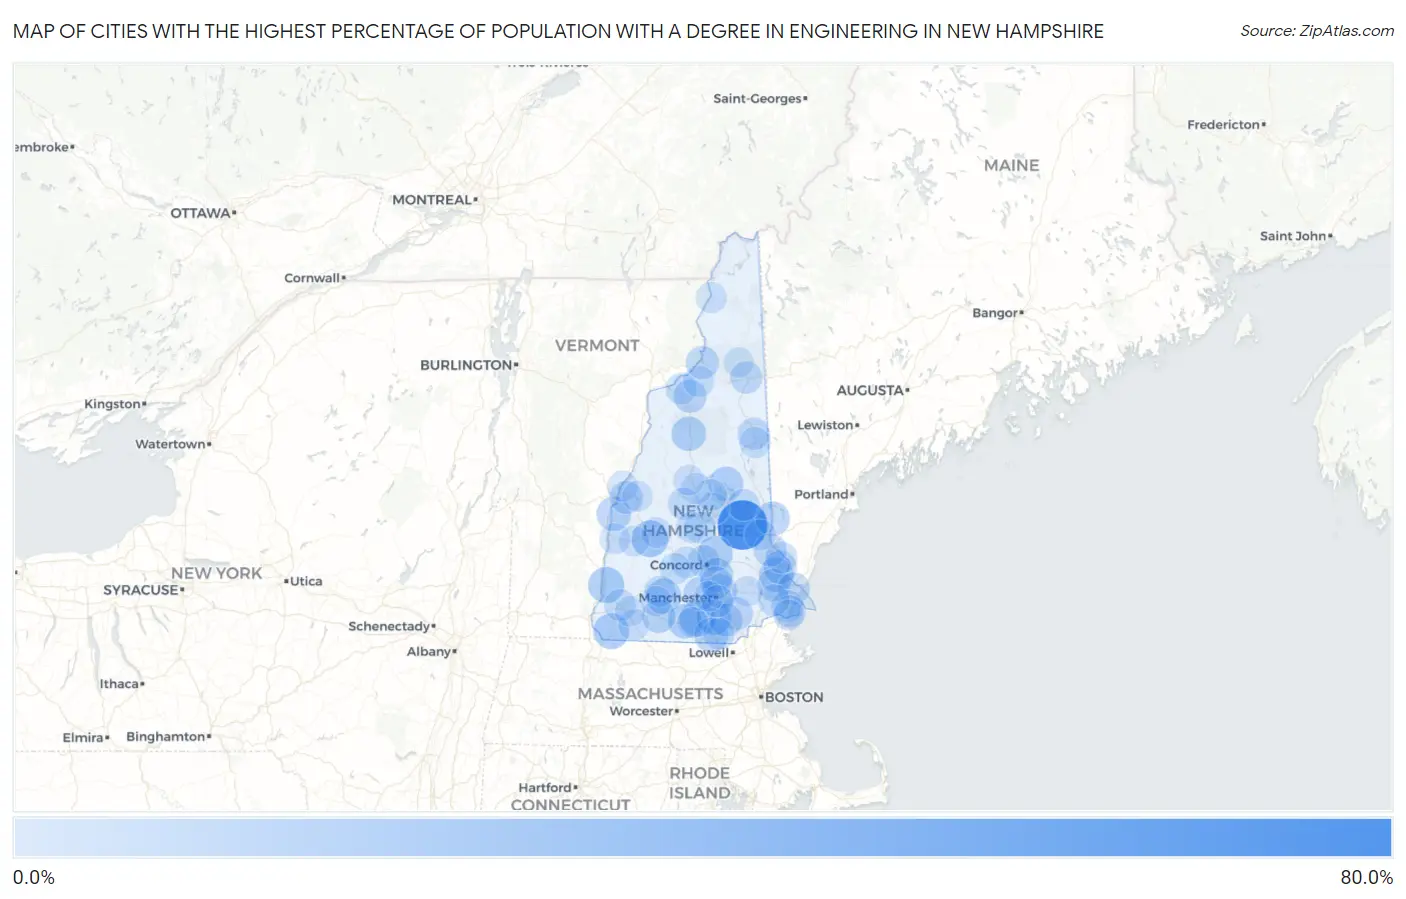
Map of Cities with the Highest Percentage of Population with a Degree in Engineering in New Hampshire
0.0%
80.0%
Cities with the Highest Percentage of Population with a Degree in Engineering in New Hampshire
| City | % Graduates | vs State | vs National | |
| 1. | Alton | 65.9% | 8.6%(+57.3)#1 | 7.6%(+58.2)#98 |
| 2. | Blodgett Landing | 21.4% | 8.6%(+12.9)#2 | 7.6%(+13.8)#902 |
| 3. | Walpole | 19.3% | 8.6%(+10.7)#3 | 7.6%(+11.6)#1,134 |
| 4. | Winchester | 18.2% | 8.6%(+9.61)#4 | 7.6%(+10.5)#1,252 |
| 5. | Amherst | 18.1% | 8.6%(+9.56)#5 | 7.6%(+10.5)#1,280 |
| 6. | Bennington | 16.4% | 8.6%(+7.79)#6 | 7.6%(+8.72)#1,588 |
| 7. | Loudon | 16.1% | 8.6%(+7.53)#7 | 7.6%(+8.46)#1,633 |
| 8. | East Merrimack | 14.6% | 8.6%(+6.01)#8 | 7.6%(+6.94)#1,960 |
| 9. | Wilton | 14.5% | 8.6%(+5.94)#9 | 7.6%(+6.87)#1,976 |
| 10. | Durham | 14.5% | 8.6%(+5.93)#10 | 7.6%(+6.85)#1,978 |
| 11. | North Woodstock | 14.4% | 8.6%(+5.86)#11 | 7.6%(+6.79)#1,987 |
| 12. | Milton Mills | 13.8% | 8.6%(+5.22)#12 | 7.6%(+6.15)#2,223 |
| 13. | Suissevale | 13.6% | 8.6%(+5.06)#13 | 7.6%(+5.99)#2,258 |
| 14. | Nashua | 13.5% | 8.6%(+4.94)#14 | 7.6%(+5.86)#2,306 |
| 15. | Plainfield | 13.3% | 8.6%(+4.76)#15 | 7.6%(+5.69)#2,375 |
| 16. | South Hooksett | 13.0% | 8.6%(+4.40)#16 | 7.6%(+5.33)#2,506 |
| 17. | Suncook | 11.9% | 8.6%(+3.30)#17 | 7.6%(+4.23)#2,946 |
| 18. | Peterborough | 11.0% | 8.6%(+2.42)#18 | 7.6%(+3.35)#3,402 |
| 19. | Dover | 10.4% | 8.6%(+1.83)#19 | 7.6%(+2.76)#3,784 |
| 20. | Goffstown | 10.2% | 8.6%(+1.59)#20 | 7.6%(+2.52)#3,961 |
| 21. | Lancaster | 9.9% | 8.6%(+1.37)#21 | 7.6%(+2.29)#4,135 |
| 22. | Bethlehem | 9.9% | 8.6%(+1.36)#22 | 7.6%(+2.28)#4,144 |
| 23. | Derry | 9.9% | 8.6%(+1.31)#23 | 7.6%(+2.23)#4,185 |
| 24. | Londonderry | 9.7% | 8.6%(+1.15)#24 | 7.6%(+2.08)#4,299 |
| 25. | Rochester | 9.2% | 8.6%(+0.599)#25 | 7.6%(+1.53)#4,740 |
| 26. | Lebanon | 8.9% | 8.6%(+0.357)#26 | 7.6%(+1.29)#4,996 |
| 27. | Klondike Corner | 8.9% | 8.6%(+0.338)#27 | 7.6%(+1.27)#5,013 |
| 28. | Newmarket | 7.9% | 8.6%(-0.645)#28 | 7.6%(+0.283)#6,048 |
| 29. | Portsmouth | 7.9% | 8.6%(-0.667)#29 | 7.6%(+0.261)#6,080 |
| 30. | Hampton | 7.2% | 8.6%(-1.38)#30 | 7.6%(-0.452)#6,993 |
| 31. | Concord | 7.1% | 8.6%(-1.45)#31 | 7.6%(-0.524)#7,113 |
| 32. | North Conway | 7.1% | 8.6%(-1.47)#32 | 7.6%(-0.541)#7,134 |
| 33. | Hooksett | 7.1% | 8.6%(-1.48)#33 | 7.6%(-0.549)#7,147 |
| 34. | Gorham | 6.8% | 8.6%(-1.75)#34 | 7.6%(-0.825)#7,514 |
| 35. | Bristol | 6.4% | 8.6%(-2.18)#35 | 7.6%(-1.26)#8,162 |
| 36. | Manchester | 6.3% | 8.6%(-2.25)#36 | 7.6%(-1.32)#8,254 |
| 37. | Wolfeboro | 6.2% | 8.6%(-2.37)#37 | 7.6%(-1.44)#8,484 |
| 38. | New Boston | 6.2% | 8.6%(-2.37)#38 | 7.6%(-1.45)#8,490 |
| 39. | Laconia | 6.2% | 8.6%(-2.42)#39 | 7.6%(-1.49)#8,567 |
| 40. | Keene | 5.4% | 8.6%(-3.21)#40 | 7.6%(-2.28)#9,888 |
| 41. | Somersworth | 5.3% | 8.6%(-3.26)#41 | 7.6%(-2.33)#9,985 |
| 42. | Hampton Beach | 5.3% | 8.6%(-3.30)#42 | 7.6%(-2.37)#10,050 |
| 43. | Tilton Northfield | 5.3% | 8.6%(-3.31)#43 | 7.6%(-2.38)#10,062 |
| 44. | Contoocook | 5.3% | 8.6%(-3.31)#44 | 7.6%(-2.38)#10,066 |
| 45. | Exeter | 5.3% | 8.6%(-3.33)#45 | 7.6%(-2.40)#10,107 |
| 46. | Hudson | 5.2% | 8.6%(-3.36)#46 | 7.6%(-2.43)#10,141 |
| 47. | Littleton | 4.6% | 8.6%(-3.98)#47 | 7.6%(-3.06)#11,259 |
| 48. | Meredith | 4.5% | 8.6%(-4.09)#48 | 7.6%(-3.16)#11,453 |
| 49. | Whitefield | 4.2% | 8.6%(-4.35)#49 | 7.6%(-3.43)#11,906 |
| 50. | Henniker | 3.9% | 8.6%(-4.65)#50 | 7.6%(-3.72)#12,431 |
| 51. | Conway | 3.8% | 8.6%(-4.73)#51 | 7.6%(-3.81)#12,576 |
| 52. | Franklin | 3.7% | 8.6%(-4.83)#52 | 7.6%(-3.90)#12,743 |
| 53. | Farmington | 3.7% | 8.6%(-4.87)#53 | 7.6%(-3.94)#12,816 |
| 54. | Antrim | 3.6% | 8.6%(-5.00)#54 | 7.6%(-4.08)#13,088 |
| 55. | Colebrook | 3.0% | 8.6%(-5.59)#55 | 7.6%(-4.66)#14,092 |
| 56. | Ashland | 3.0% | 8.6%(-5.62)#56 | 7.6%(-4.69)#14,153 |
| 57. | Troy | 2.9% | 8.6%(-5.72)#57 | 7.6%(-4.79)#14,333 |
| 58. | Hanover | 2.7% | 8.6%(-5.90)#58 | 7.6%(-4.97)#14,615 |
| 59. | Claremont | 2.4% | 8.6%(-6.16)#59 | 7.6%(-5.23)#15,021 |
| 60. | Plymouth | 2.1% | 8.6%(-6.44)#60 | 7.6%(-5.51)#15,462 |
| 61. | Seabrook Beach | 2.0% | 8.6%(-6.53)#61 | 7.6%(-5.60)#15,603 |
| 62. | New London | 1.9% | 8.6%(-6.70)#62 | 7.6%(-5.77)#15,877 |
| 63. | Milford | 1.9% | 8.6%(-6.71)#63 | 7.6%(-5.79)#15,899 |
| 64. | Enfield | 1.7% | 8.6%(-6.89)#64 | 7.6%(-5.96)#16,145 |
| 65. | Hancock | 1.5% | 8.6%(-7.07)#65 | 7.6%(-6.14)#16,413 |
| 66. | Newport | 1.4% | 8.6%(-7.17)#66 | 7.6%(-6.24)#16,531 |
| 67. | Raymond | 1.3% | 8.6%(-7.24)#67 | 7.6%(-6.32)#16,638 |
| 68. | Marlborough | 1.2% | 8.6%(-7.37)#68 | 7.6%(-6.45)#16,791 |
| 69. | Berlin | 1.2% | 8.6%(-7.39)#69 | 7.6%(-6.47)#16,816 |
| 70. | Pinardville | 0.65% | 8.6%(-7.93)#70 | 7.6%(-7.00)#17,273 |
1
Common Questions
What are the Top 10 Cities with the Highest Percentage of Population with a Degree in Engineering in New Hampshire?
Top 10 Cities with the Highest Percentage of Population with a Degree in Engineering in New Hampshire are:
#1
65.9%
#2
21.4%
#3
19.3%
#4
18.2%
#5
18.1%
#6
16.4%
#7
16.1%
#8
14.6%
#9
14.5%
#10
14.5%
What city has the Highest Percentage of Population with a Degree in Engineering in New Hampshire?
Alton has the Highest Percentage of Population with a Degree in Engineering in New Hampshire with 65.9%.
What is the Percentage of Population with a Degree in Engineering in the State of New Hampshire?
Percentage of Population with a Degree in Engineering in New Hampshire is 8.6%.
What is the Percentage of Population with a Degree in Engineering in the United States?
Percentage of Population with a Degree in Engineering in the United States is 7.6%.