Cities with the Highest Percentage of Population with a Degree in Engineering in Colorado
RELATED REPORTS & OPTIONS
Engineering
Colorado
Compare Cities
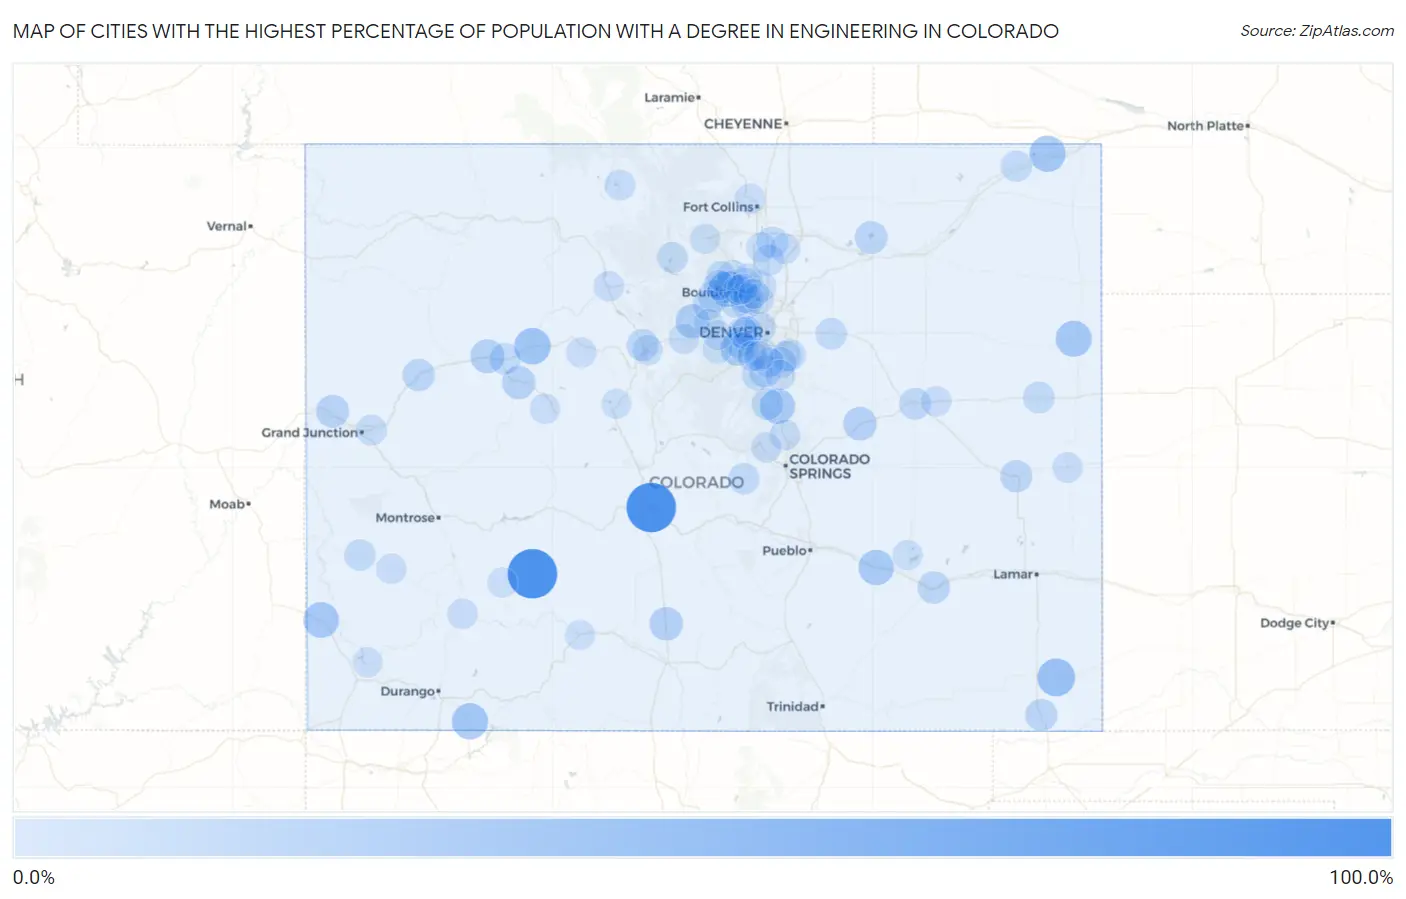
Map of Cities with the Highest Percentage of Population with a Degree in Engineering in Colorado
0.0%
100.0%
Cities with the Highest Percentage of Population with a Degree in Engineering in Colorado
| City | % Graduates | vs State | vs National | |
| 1. | Smeltertown | 100.0% | 8.3%(+91.7)#1 | 7.6%(+92.4)#38 |
| 2. | Cathedral | 100.0% | 8.3%(+91.7)#2 | 7.6%(+92.4)#57 |
| 3. | Vilas | 44.4% | 8.3%(+36.2)#3 | 7.6%(+36.8)#217 |
| 4. | Dotsero | 38.7% | 8.3%(+30.4)#4 | 7.6%(+31.0)#284 |
| 5. | Sedgwick | 37.5% | 8.3%(+29.2)#5 | 7.6%(+29.9)#296 |
| 6. | Southern Ute | 37.5% | 8.3%(+29.2)#6 | 7.6%(+29.9)#299 |
| 7. | Seven Hills | 36.8% | 8.3%(+28.6)#7 | 7.6%(+29.2)#309 |
| 8. | Idalia | 36.4% | 8.3%(+28.1)#8 | 7.6%(+28.7)#319 |
| 9. | Dove Creek | 35.0% | 8.3%(+26.7)#9 | 7.6%(+27.3)#335 |
| 10. | Fowler | 33.0% | 8.3%(+24.7)#10 | 7.6%(+25.3)#381 |
| 11. | Larkspur | 32.4% | 8.3%(+24.1)#11 | 7.6%(+24.7)#388 |
| 12. | Sierra Ridge | 29.3% | 8.3%(+21.0)#12 | 7.6%(+21.6)#466 |
| 13. | Indian Hills | 28.3% | 8.3%(+20.0)#13 | 7.6%(+20.6)#515 |
| 14. | St Mary S | 27.7% | 8.3%(+19.4)#14 | 7.6%(+20.0)#534 |
| 15. | Chacra | 27.3% | 8.3%(+19.1)#15 | 7.6%(+19.7)#544 |
| 16. | Somerset | 25.9% | 8.3%(+17.7)#16 | 7.6%(+18.3)#603 |
| 17. | Hooper | 25.0% | 8.3%(+16.7)#17 | 7.6%(+17.4)#662 |
| 18. | Ramah | 25.0% | 8.3%(+16.7)#18 | 7.6%(+17.4)#670 |
| 19. | Cope | 25.0% | 8.3%(+16.7)#19 | 7.6%(+17.4)#677 |
| 20. | Blue Valley | 24.4% | 8.3%(+16.1)#20 | 7.6%(+16.7)#701 |
| 21. | Mulford | 23.9% | 8.3%(+15.6)#21 | 7.6%(+16.3)#727 |
| 22. | Loma | 21.7% | 8.3%(+13.5)#22 | 7.6%(+14.1)#872 |
| 23. | Jackson Lake | 21.4% | 8.3%(+13.2)#23 | 7.6%(+13.8)#899 |
| 24. | Parachute | 20.0% | 8.3%(+11.7)#24 | 7.6%(+12.4)#1,026 |
| 25. | North La Junta | 20.0% | 8.3%(+11.7)#25 | 7.6%(+12.4)#1,038 |
| 26. | Kit Carson | 19.2% | 8.3%(+11.0)#26 | 7.6%(+11.6)#1,140 |
| 27. | Louviers | 18.9% | 8.3%(+10.6)#27 | 7.6%(+11.2)#1,179 |
| 28. | Campo | 18.8% | 8.3%(+10.5)#28 | 7.6%(+11.1)#1,196 |
| 29. | Silverthorne | 18.5% | 8.3%(+10.3)#29 | 7.6%(+10.9)#1,210 |
| 30. | Perry Park | 18.3% | 8.3%(+9.99)#30 | 7.6%(+10.6)#1,245 |
| 31. | Limon | 17.5% | 8.3%(+9.25)#31 | 7.6%(+9.86)#1,352 |
| 32. | West Pleasant View | 17.4% | 8.3%(+9.17)#32 | 7.6%(+9.78)#1,366 |
| 33. | Pine Brook Hill | 17.3% | 8.3%(+9.09)#33 | 7.6%(+9.70)#1,388 |
| 34. | St Ann Highlands | 17.1% | 8.3%(+8.85)#34 | 7.6%(+9.46)#1,425 |
| 35. | Sterling Ranch | 17.1% | 8.3%(+8.82)#35 | 7.6%(+9.43)#1,429 |
| 36. | Foxfield | 17.0% | 8.3%(+8.74)#36 | 7.6%(+9.35)#1,446 |
| 37. | Stratton | 16.7% | 8.3%(+8.41)#37 | 7.6%(+9.02)#1,502 |
| 38. | No Name | 16.4% | 8.3%(+8.13)#38 | 7.6%(+8.75)#1,584 |
| 39. | Johnstown | 16.1% | 8.3%(+7.83)#39 | 7.6%(+8.44)#1,638 |
| 40. | Bennett | 16.0% | 8.3%(+7.73)#40 | 7.6%(+8.34)#1,658 |
| 41. | Mountain View | 15.8% | 8.3%(+7.57)#41 | 7.6%(+8.18)#1,693 |
| 42. | Cripple Creek | 15.7% | 8.3%(+7.45)#42 | 7.6%(+8.07)#1,725 |
| 43. | Naturita | 15.6% | 8.3%(+7.36)#43 | 7.6%(+7.98)#1,748 |
| 44. | Crook | 15.4% | 8.3%(+7.12)#44 | 7.6%(+7.74)#1,797 |
| 45. | Mead | 15.4% | 8.3%(+7.10)#45 | 7.6%(+7.72)#1,801 |
| 46. | Crisman | 14.9% | 8.3%(+6.69)#46 | 7.6%(+7.30)#1,884 |
| 47. | Gunbarrel | 14.7% | 8.3%(+6.41)#47 | 7.6%(+7.02)#1,942 |
| 48. | Twin Lakes Cdp Adams County | 14.4% | 8.3%(+6.12)#48 | 7.6%(+6.74)#2,003 |
| 49. | Roxborough Park | 14.0% | 8.3%(+5.79)#49 | 7.6%(+6.40)#2,129 |
| 50. | Grand Lake | 14.0% | 8.3%(+5.71)#50 | 7.6%(+6.32)#2,158 |
| 51. | Eldorado Springs | 13.9% | 8.3%(+5.61)#51 | 7.6%(+6.23)#2,190 |
| 52. | Paragon Estates | 13.6% | 8.3%(+5.30)#52 | 7.6%(+5.92)#2,283 |
| 53. | Golden | 13.5% | 8.3%(+5.20)#53 | 7.6%(+5.82)#2,319 |
| 54. | Walden | 13.4% | 8.3%(+5.17)#54 | 7.6%(+5.79)#2,327 |
| 55. | Gleneagle | 13.4% | 8.3%(+5.12)#55 | 7.6%(+5.74)#2,343 |
| 56. | Columbine Valley | 13.2% | 8.3%(+4.98)#56 | 7.6%(+5.59)#2,399 |
| 57. | Dove Valley | 13.2% | 8.3%(+4.96)#57 | 7.6%(+5.57)#2,410 |
| 58. | Lone Tree | 13.2% | 8.3%(+4.91)#58 | 7.6%(+5.52)#2,419 |
| 59. | Clifton | 13.2% | 8.3%(+4.90)#59 | 7.6%(+5.51)#2,422 |
| 60. | Superior | 12.9% | 8.3%(+4.61)#60 | 7.6%(+5.23)#2,540 |
| 61. | Idledale | 12.6% | 8.3%(+4.36)#61 | 7.6%(+4.97)#2,631 |
| 62. | Silver Plume | 12.5% | 8.3%(+4.24)#62 | 7.6%(+4.85)#2,693 |
| 63. | Altona | 12.4% | 8.3%(+4.16)#63 | 7.6%(+4.77)#2,728 |
| 64. | Erie | 12.4% | 8.3%(+4.10)#64 | 7.6%(+4.72)#2,747 |
| 65. | Niwot | 12.2% | 8.3%(+3.95)#65 | 7.6%(+4.56)#2,807 |
| 66. | Kremmling | 11.9% | 8.3%(+3.67)#66 | 7.6%(+4.28)#2,920 |
| 67. | Cheyenne Wells | 11.9% | 8.3%(+3.64)#67 | 7.6%(+4.26)#2,930 |
| 68. | Norwood | 11.9% | 8.3%(+3.60)#68 | 7.6%(+4.22)#2,955 |
| 69. | Silverton | 11.8% | 8.3%(+3.57)#69 | 7.6%(+4.18)#2,975 |
| 70. | Highlands Ranch | 11.8% | 8.3%(+3.55)#70 | 7.6%(+4.17)#2,978 |
| 71. | Castle Pines | 11.8% | 8.3%(+3.55)#71 | 7.6%(+4.16)#2,979 |
| 72. | Genoa | 11.8% | 8.3%(+3.50)#72 | 7.6%(+4.12)#3,006 |
| 73. | Cascade Chipita Park | 11.7% | 8.3%(+3.48)#73 | 7.6%(+4.10)#3,013 |
| 74. | Milliken | 11.7% | 8.3%(+3.46)#74 | 7.6%(+4.07)#3,020 |
| 75. | Applewood | 11.6% | 8.3%(+3.34)#75 | 7.6%(+3.95)#3,076 |
| 76. | Edwards | 11.6% | 8.3%(+3.30)#76 | 7.6%(+3.92)#3,089 |
| 77. | Dillon | 11.6% | 8.3%(+3.29)#77 | 7.6%(+3.91)#3,094 |
| 78. | Louisville | 11.5% | 8.3%(+3.26)#78 | 7.6%(+3.88)#3,110 |
| 79. | Morrison | 11.4% | 8.3%(+3.17)#79 | 7.6%(+3.78)#3,157 |
| 80. | Jamestown | 11.4% | 8.3%(+3.17)#80 | 7.6%(+3.78)#3,161 |
| 81. | Broomfield | 11.4% | 8.3%(+3.16)#81 | 7.6%(+3.77)#3,163 |
| 82. | Gold Hill | 11.4% | 8.3%(+3.09)#82 | 7.6%(+3.71)#3,199 |
| 83. | Ordway | 11.3% | 8.3%(+3.07)#83 | 7.6%(+3.68)#3,208 |
| 84. | Boulder | 11.3% | 8.3%(+3.07)#84 | 7.6%(+3.68)#3,209 |
| 85. | Snowmass Village | 11.3% | 8.3%(+3.02)#85 | 7.6%(+3.64)#3,233 |
| 86. | Laporte | 11.3% | 8.3%(+3.01)#86 | 7.6%(+3.62)#3,238 |
| 87. | Berthoud | 11.2% | 8.3%(+2.89)#87 | 7.6%(+3.51)#3,298 |
| 88. | Rollinsville | 11.1% | 8.3%(+2.85)#88 | 7.6%(+3.46)#3,340 |
| 89. | Valmont | 11.1% | 8.3%(+2.85)#89 | 7.6%(+3.46)#3,349 |
| 90. | Ken Caryl | 11.1% | 8.3%(+2.85)#90 | 7.6%(+3.46)#3,354 |
| 91. | South Fork | 10.9% | 8.3%(+2.65)#91 | 7.6%(+3.26)#3,460 |
| 92. | Leadville North | 10.9% | 8.3%(+2.63)#92 | 7.6%(+3.25)#3,468 |
| 93. | Columbine | 10.8% | 8.3%(+2.51)#93 | 7.6%(+3.12)#3,544 |
| 94. | Black Hawk | 10.6% | 8.3%(+2.38)#94 | 7.6%(+2.99)#3,625 |
| 95. | Lake City | 10.6% | 8.3%(+2.33)#95 | 7.6%(+2.94)#3,655 |
| 96. | Lafayette | 10.5% | 8.3%(+2.25)#96 | 7.6%(+2.87)#3,716 |
| 97. | Dolores | 10.4% | 8.3%(+2.17)#97 | 7.6%(+2.78)#3,767 |
| 98. | Upper Bear Creek | 10.4% | 8.3%(+2.14)#98 | 7.6%(+2.76)#3,787 |
| 99. | Floyd Hill | 10.4% | 8.3%(+2.14)#99 | 7.6%(+2.75)#3,794 |
| 100. | Estes Park | 10.3% | 8.3%(+2.08)#100 | 7.6%(+2.70)#3,827 |
Common Questions
What are the Top 10 Cities with the Highest Percentage of Population with a Degree in Engineering in Colorado?
Top 10 Cities with the Highest Percentage of Population with a Degree in Engineering in Colorado are:
#1
100.0%
#2
100.0%
#3
44.4%
#4
38.7%
#5
37.5%
#6
37.5%
#7
36.8%
#8
36.4%
#9
35.0%
#10
33.0%
What city has the Highest Percentage of Population with a Degree in Engineering in Colorado?
Smeltertown has the Highest Percentage of Population with a Degree in Engineering in Colorado with 100.0%.
What is the Percentage of Population with a Degree in Engineering in the State of Colorado?
Percentage of Population with a Degree in Engineering in Colorado is 8.3%.
What is the Percentage of Population with a Degree in Engineering in the United States?
Percentage of Population with a Degree in Engineering in the United States is 7.6%.