Cities with the Highest Percentage of Population with a Degree in Engineering in Alaska
RELATED REPORTS & OPTIONS
Engineering
Alaska
Compare Cities
Map of Cities with the Highest Percentage of Population with a Degree in Engineering in Alaska
0.0%
100.0%
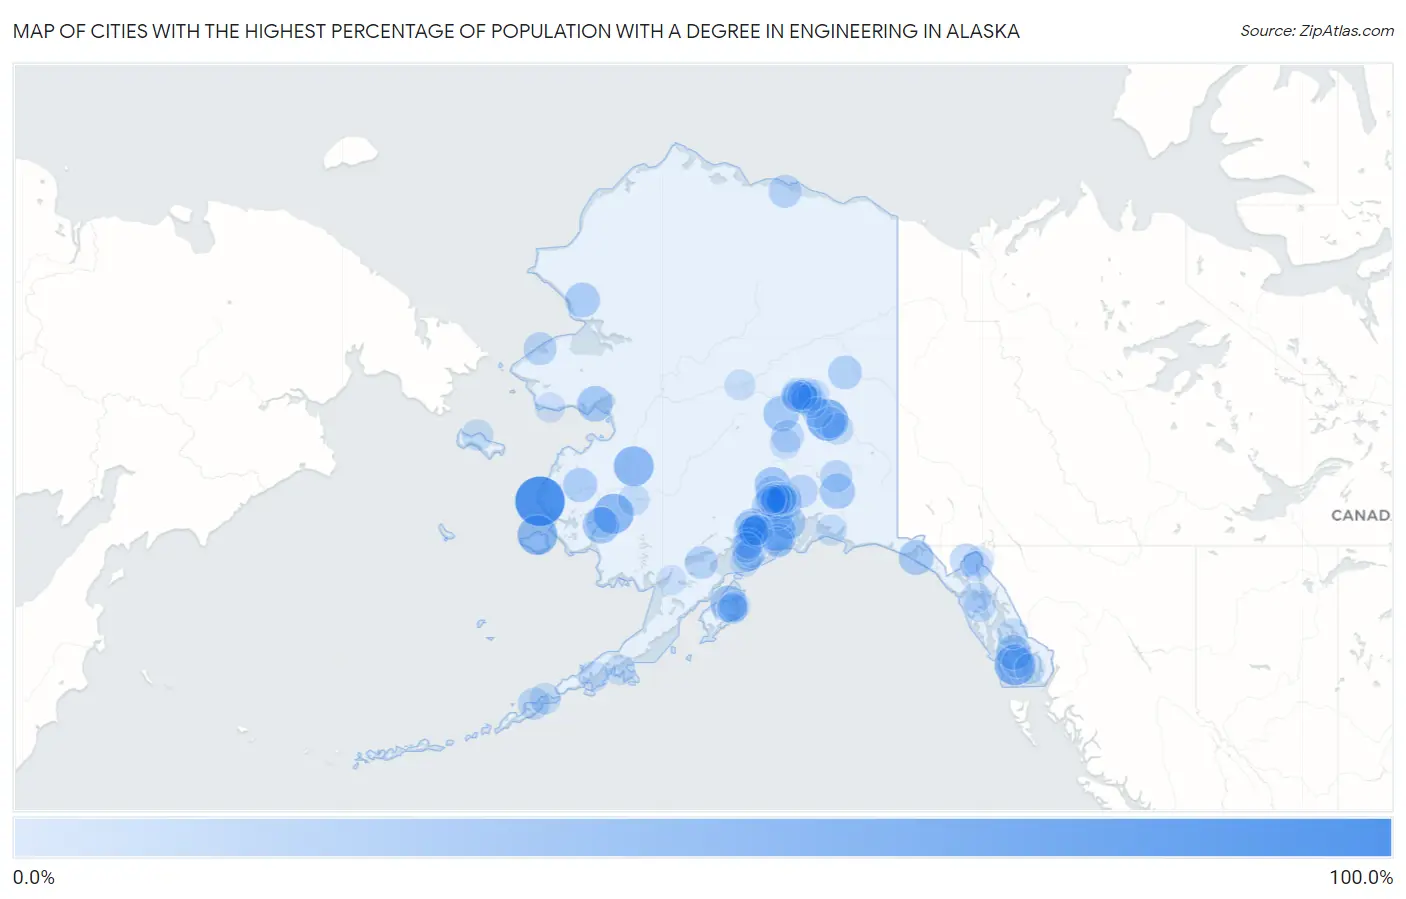
Cities with the Highest Percentage of Population with a Degree in Engineering in Alaska
| City | % Graduates | vs State | vs National | |
| 1. | Hooper Bay | 85.7% | 7.2% (+78.5)#1 | 7.6% (+78.1)#65 |
| 2. | Whitestone | 50.0% | 7.2% (+42.8)#2 | 7.6% (+42.4)#177 |
| 3. | Hollis | 47.1% | 7.2% (+39.9)#3 | 7.6% (+39.5)#196 |
| 4. | Tuluksak | 42.9% | 7.2% (+35.7)#4 | 7.6% (+35.2)#231 |
| 5. | Mekoryuk | 42.9% | 7.2% (+35.7)#5 | 7.6% (+35.2)#233 |
| 6. | Shageluk | 42.9% | 7.2% (+35.7)#6 | 7.6% (+35.2)#236 |
| 7. | Moose Pass | 38.6% | 7.2% (+31.4)#7 | 7.6% (+30.9)#287 |
| 8. | Napaskiak | 30.0% | 7.2% (+22.8)#8 | 7.6% (+22.4)#442 |
| 9. | Port Lions | 28.6% | 7.2% (+21.4)#9 | 7.6% (+20.9)#494 |
| 10. | Susitna North | 25.1% | 7.2% (+17.9)#10 | 7.6% (+17.5)#633 |
| 11. | Elim | 25.0% | 7.2% (+17.8)#11 | 7.6% (+17.4)#652 |
| 12. | Anderson | 25.0% | 7.2% (+17.8)#12 | 7.6% (+17.4)#663 |
| 13. | Willow Creek | 23.2% | 7.2% (+16.0)#13 | 7.6% (+15.5)#769 |
| 14. | Yakutat | 22.4% | 7.2% (+15.2)#14 | 7.6% (+14.8)#810 |
| 15. | Coffman Cove | 21.7% | 7.2% (+14.5)#15 | 7.6% (+14.1)#870 |
| 16. | Noatak | 21.4% | 7.2% (+14.2)#16 | 7.6% (+13.8)#890 |
| 17. | St Mary S | 19.0% | 7.2% (+11.8)#17 | 7.6% (+11.4)#1,153 |
| 18. | Point Mackenzie | 17.0% | 7.2% (+9.82)#18 | 7.6% (+9.37)#1,440 |
| 19. | Funny River | 16.8% | 7.2% (+9.57)#19 | 7.6% (+9.13)#1,482 |
| 20. | Whittier | 16.7% | 7.2% (+9.47)#20 | 7.6% (+9.02)#1,512 |
| 21. | Central | 16.7% | 7.2% (+9.47)#21 | 7.6% (+9.02)#1,534 |
| 22. | Knik River | 15.8% | 7.2% (+8.59)#22 | 7.6% (+8.14)#1,699 |
| 23. | Willow | 15.7% | 7.2% (+8.54)#23 | 7.6% (+8.09)#1,719 |
| 24. | Nikiski | 14.3% | 7.2% (+7.12)#24 | 7.6% (+6.67)#2,017 |
| 25. | Kokhanok | 14.3% | 7.2% (+7.08)#25 | 7.6% (+6.64)#2,058 |
| 26. | Prudhoe Bay | 13.9% | 7.2% (+6.70)#26 | 7.6% (+6.25)#2,180 |
| 27. | Shishmaref | 13.8% | 7.2% (+6.59)#27 | 7.6% (+6.15)#2,215 |
| 28. | Mosquito Lake | 13.7% | 7.2% (+6.52)#28 | 7.6% (+6.08)#2,238 |
| 29. | Glacier View | 13.5% | 7.2% (+6.31)#29 | 7.6% (+5.87)#2,302 |
| 30. | Bear Creek | 13.4% | 7.2% (+6.18)#30 | 7.6% (+5.74)#2,344 |
| 31. | Mill Bay | 13.1% | 7.2% (+5.93)#31 | 7.6% (+5.49)#2,434 |
| 32. | Salamatof | 12.6% | 7.2% (+5.42)#32 | 7.6% (+4.97)#2,630 |
| 33. | Denali Park | 12.2% | 7.2% (+4.98)#33 | 7.6% (+4.54)#2,814 |
| 34. | Gakona | 12.1% | 7.2% (+4.92)#34 | 7.6% (+4.47)#2,848 |
| 35. | Unalaska | 10.3% | 7.2% (+3.12)#35 | 7.6% (+2.67)#3,855 |
| 36. | College | 10.2% | 7.2% (+3.04)#36 | 7.6% (+2.59)#3,905 |
| 37. | Lazy Mountain | 9.4% | 7.2% (+2.24)#37 | 7.6% (+1.80)#4,517 |
| 38. | Tanaina | 9.2% | 7.2% (+2.01)#38 | 7.6% (+1.56)#4,715 |
| 39. | Deltana | 9.2% | 7.2% (+1.99)#39 | 7.6% (+1.55)#4,726 |
| 40. | Goldstream | 9.0% | 7.2% (+1.80)#40 | 7.6% (+1.35)#4,917 |
| 41. | Badger | 8.6% | 7.2% (+1.43)#41 | 7.6% (+0.983)#5,277 |
| 42. | Cohoe | 8.4% | 7.2% (+1.16)#42 | 7.6% (+0.719)#5,516 |
| 43. | Anchorage | 8.3% | 7.2% (+1.13)#43 | 7.6% (+0.680)#5,594 |
| 44. | Steele Creek | 8.3% | 7.2% (+1.11)#44 | 7.6% (+0.663)#5,608 |
| 45. | Tenakee Springs | 8.2% | 7.2% (+0.962)#45 | 7.6% (+0.516)#5,778 |
| 46. | Akutan | 8.1% | 7.2% (+0.923)#46 | 7.6% (+0.477)#5,811 |
| 47. | Delta Junction | 8.0% | 7.2% (+0.798)#47 | 7.6% (+0.352)#5,968 |
| 48. | Farm Loop | 7.6% | 7.2% (+0.356)#48 | 7.6% (-0.090)#6,526 |
| 49. | Eielson Afb | 7.5% | 7.2% (+0.287)#49 | 7.6% (-0.159)#6,614 |
| 50. | Aniak | 7.3% | 7.2% (+0.115)#50 | 7.6% (-0.330)#6,833 |
| 51. | Savoonga | 7.1% | 7.2% (-0.059)#51 | 7.6% (-0.505)#7,066 |
| 52. | Juneau City And Borough | 7.0% | 7.2% (-0.180)#52 | 7.6% (-0.626)#7,238 |
| 53. | Kalifornsky | 6.6% | 7.2% (-0.647)#53 | 7.6% (-1.09)#7,910 |
| 54. | Thorne Bay | 6.5% | 7.2% (-0.680)#54 | 7.6% (-1.13)#7,963 |
| 55. | South Lakes | 6.5% | 7.2% (-0.747)#55 | 7.6% (-1.19)#8,048 |
| 56. | Cordova | 6.4% | 7.2% (-0.784)#56 | 7.6% (-1.23)#8,120 |
| 57. | Sitka City And Borough | 6.2% | 7.2% (-1.04)#57 | 7.6% (-1.49)#8,568 |
| 58. | Chena Ridge | 6.1% | 7.2% (-1.12)#58 | 7.6% (-1.56)#8,697 |
| 59. | Kachemak | 6.0% | 7.2% (-1.18)#59 | 7.6% (-1.62)#8,800 |
| 60. | Ridgeway | 5.9% | 7.2% (-1.30)#60 | 7.6% (-1.75)#8,985 |
| 61. | Kodiak Station | 5.8% | 7.2% (-1.43)#61 | 7.6% (-1.88)#9,197 |
| 62. | Fairbanks | 5.8% | 7.2% (-1.43)#62 | 7.6% (-1.88)#9,205 |
| 63. | Pleasant Valley | 5.4% | 7.2% (-1.77)#63 | 7.6% (-2.21)#9,771 |
| 64. | Tanana | 5.3% | 7.2% (-1.94)#64 | 7.6% (-2.38)#10,094 |
| 65. | Seldovia | 5.3% | 7.2% (-1.94)#65 | 7.6% (-2.38)#10,096 |
| 66. | Palmer | 5.1% | 7.2% (-2.12)#66 | 7.6% (-2.56)#10,384 |
| 67. | Kodiak | 5.0% | 7.2% (-2.24)#67 | 7.6% (-2.68)#10,604 |
| 68. | Petersburg | 4.9% | 7.2% (-2.29)#68 | 7.6% (-2.74)#10,698 |
| 69. | Knik Fairview | 4.8% | 7.2% (-2.38)#69 | 7.6% (-2.83)#10,875 |
| 70. | North Pole | 4.8% | 7.2% (-2.42)#70 | 7.6% (-2.87)#10,945 |
| 71. | Harding Birch Lakes | 4.8% | 7.2% (-2.44)#71 | 7.6% (-2.89)#10,990 |
| 72. | Kenai | 4.7% | 7.2% (-2.47)#72 | 7.6% (-2.92)#11,034 |
| 73. | Homer | 4.7% | 7.2% (-2.48)#73 | 7.6% (-2.92)#11,045 |
| 74. | Ketchikan | 4.7% | 7.2% (-2.54)#74 | 7.6% (-2.98)#11,123 |
| 75. | Gateway | 4.6% | 7.2% (-2.61)#75 | 7.6% (-3.06)#11,264 |
| 76. | Fritz Creek | 4.4% | 7.2% (-2.77)#76 | 7.6% (-3.21)#11,544 |
| 77. | Soldotna | 4.4% | 7.2% (-2.78)#77 | 7.6% (-3.22)#11,568 |
| 78. | Bethel | 4.4% | 7.2% (-2.82)#78 | 7.6% (-3.27)#11,644 |
| 79. | Butte | 4.4% | 7.2% (-2.84)#79 | 7.6% (-3.28)#11,667 |
| 80. | Sand Point | 4.3% | 7.2% (-2.95)#80 | 7.6% (-3.39)#11,846 |
| 81. | Ninilchik | 4.1% | 7.2% (-3.06)#81 | 7.6% (-3.51)#12,070 |
| 82. | Seward | 4.1% | 7.2% (-3.08)#82 | 7.6% (-3.52)#12,096 |
| 83. | Meadow Lakes | 4.1% | 7.2% (-3.12)#83 | 7.6% (-3.57)#12,178 |
| 84. | Sterling | 4.0% | 7.2% (-3.20)#84 | 7.6% (-3.64)#12,293 |
| 85. | Cantwell | 4.0% | 7.2% (-3.20)#85 | 7.6% (-3.65)#12,317 |
| 86. | North Lakes | 3.9% | 7.2% (-3.26)#86 | 7.6% (-3.70)#12,412 |
| 87. | Ester | 3.8% | 7.2% (-3.45)#87 | 7.6% (-3.89)#12,731 |
| 88. | Big Lake | 3.7% | 7.2% (-3.47)#88 | 7.6% (-3.91)#12,765 |
| 89. | Womens Bay | 3.6% | 7.2% (-3.64)#89 | 7.6% (-4.09)#13,131 |
| 90. | Skagway | 3.5% | 7.2% (-3.67)#90 | 7.6% (-4.12)#13,175 |
| 91. | King Cove | 3.5% | 7.2% (-3.67)#91 | 7.6% (-4.12)#13,176 |
| 92. | Hoonah | 3.4% | 7.2% (-3.80)#92 | 7.6% (-4.25)#13,388 |
| 93. | Happy Valley | 3.3% | 7.2% (-3.90)#93 | 7.6% (-4.34)#13,547 |
| 94. | Wasilla | 3.0% | 7.2% (-4.21)#94 | 7.6% (-4.66)#14,082 |
| 95. | Nome | 2.9% | 7.2% (-4.26)#95 | 7.6% (-4.71)#14,166 |
| 96. | Haines | 2.9% | 7.2% (-4.26)#96 | 7.6% (-4.71)#14,174 |
| 97. | Houston | 2.4% | 7.2% (-4.79)#97 | 7.6% (-5.24)#15,029 |
| 98. | Naknek | 2.2% | 7.2% (-5.05)#98 | 7.6% (-5.50)#15,447 |
| 99. | Farmers Loop | 1.9% | 7.2% (-5.27)#99 | 7.6% (-5.72)#15,783 |
| 100. | Wrangell City And Borough | 1.9% | 7.2% (-5.32)#100 | 7.6% (-5.77)#15,868 |
Common Questions
What are the Top 10 Cities with the Highest Percentage of Population with a Degree in Engineering in Alaska?
Top 10 Cities with the Highest Percentage of Population with a Degree in Engineering in Alaska are:
#1
85.7%
#2
50.0%
#3
47.1%
#4
42.9%
#5
42.9%
#6
42.9%
#7
38.6%
#8
30.0%
#9
28.6%
#10
25.1%
What city has the Highest Percentage of Population with a Degree in Engineering in Alaska?
Hooper Bay has the Highest Percentage of Population with a Degree in Engineering in Alaska with 85.7%.
What is the Percentage of Population with a Degree in Engineering in the State of Alaska?
Percentage of Population with a Degree in Engineering in Alaska is 7.2%.
What is the Percentage of Population with a Degree in Engineering in the United States?
Percentage of Population with a Degree in Engineering in the United States is 7.6%.