Cities with the Highest Percentage of Population with a Degree in Engineering in Utah
RELATED REPORTS & OPTIONS
Engineering
Utah
Compare Cities
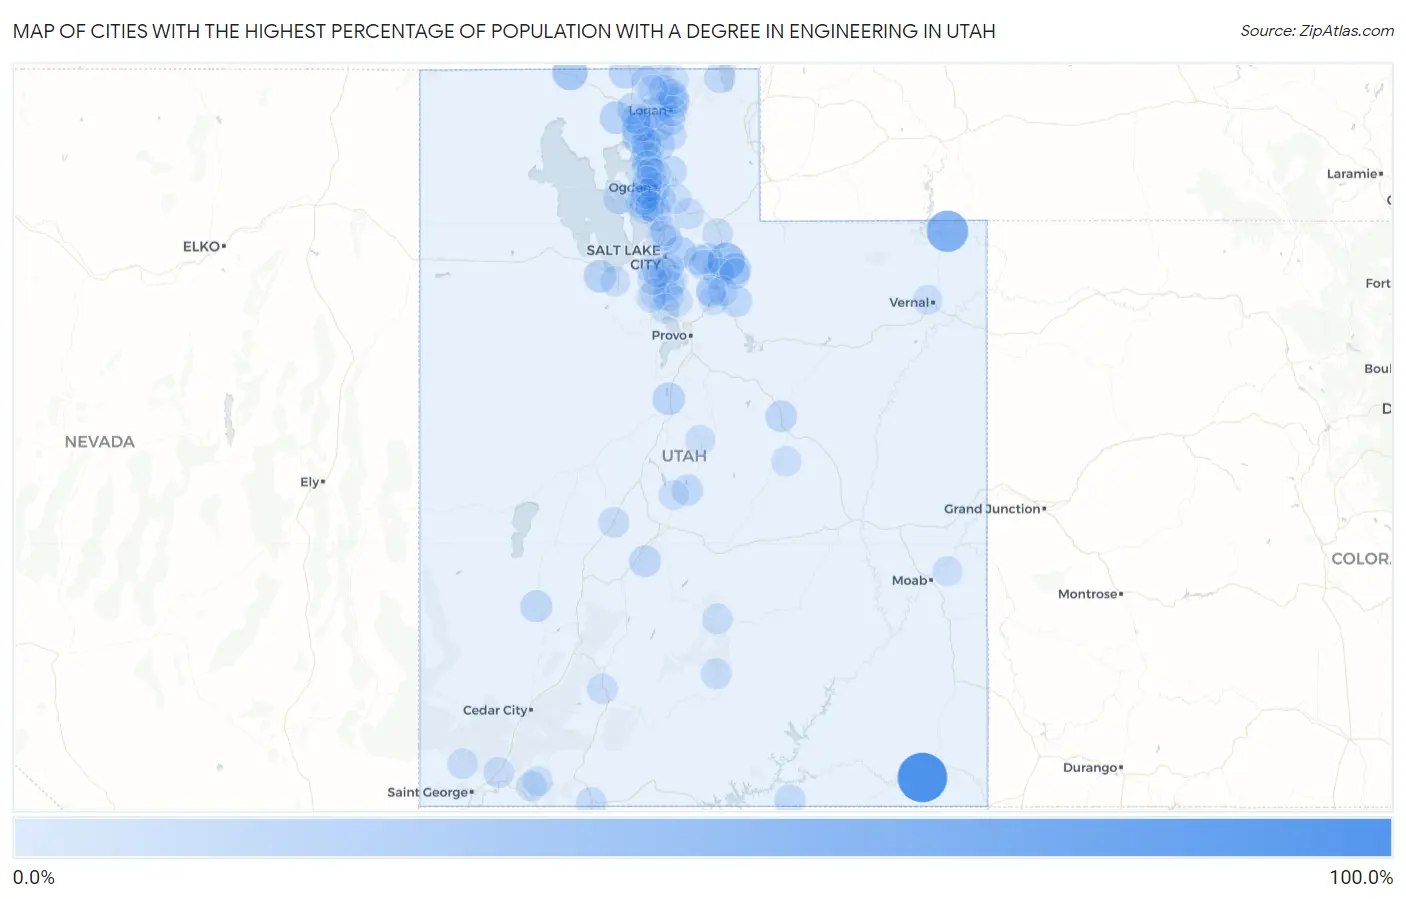
Map of Cities with the Highest Percentage of Population with a Degree in Engineering in Utah
0.0%
100.0%
Cities with the Highest Percentage of Population with a Degree in Engineering in Utah
| City | % Graduates | vs State | vs National | |
| 1. | Tselakai Dezza | 100.0% | 6.8%(+93.2)#1 | 7.6%(+92.4)#42 |
| 2. | Dutch John | 60.0% | 6.8%(+53.2)#2 | 7.6%(+52.4)#126 |
| 3. | Peoa | 40.0% | 6.8%(+33.2)#3 | 7.6%(+32.4)#271 |
| 4. | Snowville | 31.2% | 6.8%(+24.4)#4 | 7.6%(+23.5)#411 |
| 5. | Thatcher | 20.5% | 6.8%(+13.7)#5 | 7.6%(+12.8)#996 |
| 6. | Corinne | 19.4% | 6.8%(+12.6)#6 | 7.6%(+11.7)#1,119 |
| 7. | Grantsville | 19.1% | 6.8%(+12.3)#7 | 7.6%(+11.5)#1,150 |
| 8. | Emigration Canyon | 19.0% | 6.8%(+12.2)#8 | 7.6%(+11.4)#1,163 |
| 9. | Mona | 18.1% | 6.8%(+11.3)#9 | 7.6%(+10.4)#1,291 |
| 10. | Honeyville | 17.5% | 6.8%(+10.8)#10 | 7.6%(+9.87)#1,351 |
| 11. | Marion | 17.4% | 6.8%(+10.6)#11 | 7.6%(+9.74)#1,374 |
| 12. | Portage | 16.7% | 6.8%(+9.90)#12 | 7.6%(+9.02)#1,524 |
| 13. | Perry | 15.6% | 6.8%(+8.87)#13 | 7.6%(+8.00)#1,745 |
| 14. | Mantua | 15.2% | 6.8%(+8.47)#14 | 7.6%(+7.60)#1,819 |
| 15. | Milford | 15.2% | 6.8%(+8.39)#15 | 7.6%(+7.52)#1,831 |
| 16. | Annabella | 15.0% | 6.8%(+8.19)#16 | 7.6%(+7.31)#1,882 |
| 17. | Bear River City | 14.9% | 6.8%(+8.14)#17 | 7.6%(+7.26)#1,893 |
| 18. | Timber Lakes | 14.3% | 6.8%(+7.52)#18 | 7.6%(+6.64)#2,026 |
| 19. | Helper | 14.3% | 6.8%(+7.48)#19 | 7.6%(+6.60)#2,075 |
| 20. | Willard | 13.5% | 6.8%(+6.72)#20 | 7.6%(+5.84)#2,311 |
| 21. | West Point | 13.2% | 6.8%(+6.43)#21 | 7.6%(+5.55)#2,414 |
| 22. | Sterling | 13.2% | 6.8%(+6.39)#22 | 7.6%(+5.51)#2,426 |
| 23. | Garland | 13.0% | 6.8%(+6.26)#23 | 7.6%(+5.38)#2,488 |
| 24. | Mendon | 12.6% | 6.8%(+5.81)#24 | 7.6%(+4.94)#2,640 |
| 25. | Wolf Creek | 12.5% | 6.8%(+5.75)#25 | 7.6%(+4.87)#2,656 |
| 26. | Garden City | 12.4% | 6.8%(+5.63)#26 | 7.6%(+4.75)#2,737 |
| 27. | Navajo Mountain | 12.0% | 6.8%(+5.23)#27 | 7.6%(+4.35)#2,888 |
| 28. | Hideout | 11.9% | 6.8%(+5.13)#28 | 7.6%(+4.26)#2,929 |
| 29. | Silver Summit | 11.2% | 6.8%(+4.38)#29 | 7.6%(+3.51)#3,297 |
| 30. | North Logan | 11.1% | 6.8%(+4.34)#30 | 7.6%(+3.46)#3,315 |
| 31. | Hooper | 11.0% | 6.8%(+4.20)#31 | 7.6%(+3.32)#3,422 |
| 32. | Cornish | 10.6% | 6.8%(+3.84)#32 | 7.6%(+2.96)#3,642 |
| 33. | Boulder | 10.5% | 6.8%(+3.71)#33 | 7.6%(+2.84)#3,733 |
| 34. | Murray | 10.5% | 6.8%(+3.70)#34 | 7.6%(+2.82)#3,739 |
| 35. | Leeds | 10.2% | 6.8%(+3.45)#35 | 7.6%(+2.57)#3,924 |
| 36. | Benson | 10.1% | 6.8%(+3.30)#36 | 7.6%(+2.42)#4,025 |
| 37. | Uintah | 10.0% | 6.8%(+3.26)#37 | 7.6%(+2.38)#4,046 |
| 38. | Morgan | 10.0% | 6.8%(+3.24)#38 | 7.6%(+2.37)#4,049 |
| 39. | West Haven | 10.0% | 6.8%(+3.24)#39 | 7.6%(+2.36)#4,053 |
| 40. | Summit Park | 9.9% | 6.8%(+3.17)#40 | 7.6%(+2.29)#4,138 |
| 41. | Hyde Park | 9.9% | 6.8%(+3.14)#41 | 7.6%(+2.26)#4,159 |
| 42. | Kanab | 9.9% | 6.8%(+3.12)#42 | 7.6%(+2.24)#4,175 |
| 43. | South Willard | 9.9% | 6.8%(+3.11)#43 | 7.6%(+2.23)#4,182 |
| 44. | Wellsville | 9.8% | 6.8%(+3.06)#44 | 7.6%(+2.19)#4,228 |
| 45. | Kamas | 9.7% | 6.8%(+2.92)#45 | 7.6%(+2.05)#4,314 |
| 46. | Fillmore | 9.7% | 6.8%(+2.92)#46 | 7.6%(+2.04)#4,319 |
| 47. | Coalville | 9.6% | 6.8%(+2.80)#47 | 7.6%(+1.92)#4,411 |
| 48. | Nibley | 9.5% | 6.8%(+2.72)#48 | 7.6%(+1.84)#4,486 |
| 49. | Riverdale | 9.5% | 6.8%(+2.71)#49 | 7.6%(+1.83)#4,496 |
| 50. | Paradise | 9.3% | 6.8%(+2.50)#50 | 7.6%(+1.62)#4,665 |
| 51. | Plain City | 9.3% | 6.8%(+2.49)#51 | 7.6%(+1.61)#4,673 |
| 52. | Rockville | 9.1% | 6.8%(+2.32)#52 | 7.6%(+1.44)#4,818 |
| 53. | Sandy | 9.1% | 6.8%(+2.28)#53 | 7.6%(+1.41)#4,854 |
| 54. | Torrey | 9.0% | 6.8%(+2.20)#54 | 7.6%(+1.33)#4,947 |
| 55. | Dammeron Valley | 8.8% | 6.8%(+2.06)#55 | 7.6%(+1.19)#5,082 |
| 56. | North Ogden | 8.8% | 6.8%(+2.05)#56 | 7.6%(+1.17)#5,103 |
| 57. | Cottonwood Heights | 8.8% | 6.8%(+2.04)#57 | 7.6%(+1.16)#5,111 |
| 58. | Panguitch | 8.5% | 6.8%(+1.70)#58 | 7.6%(+0.827)#5,425 |
| 59. | Alpine | 8.3% | 6.8%(+1.51)#59 | 7.6%(+0.627)#5,640 |
| 60. | Snyderville | 8.3% | 6.8%(+1.49)#60 | 7.6%(+0.614)#5,652 |
| 61. | Brigham City | 8.2% | 6.8%(+1.47)#61 | 7.6%(+0.594)#5,680 |
| 62. | River Heights | 8.2% | 6.8%(+1.47)#62 | 7.6%(+0.592)#5,682 |
| 63. | Elwood | 8.2% | 6.8%(+1.43)#63 | 7.6%(+0.556)#5,728 |
| 64. | Interlaken | 8.2% | 6.8%(+1.39)#64 | 7.6%(+0.516)#5,779 |
| 65. | Layton | 8.2% | 6.8%(+1.38)#65 | 7.6%(+0.503)#5,788 |
| 66. | Amalga | 8.1% | 6.8%(+1.29)#66 | 7.6%(+0.417)#5,885 |
| 67. | Draper | 8.1% | 6.8%(+1.29)#67 | 7.6%(+0.409)#5,897 |
| 68. | Ogden | 8.0% | 6.8%(+1.24)#68 | 7.6%(+0.364)#5,948 |
| 69. | Pleasant View | 8.0% | 6.8%(+1.23)#69 | 7.6%(+0.352)#5,959 |
| 70. | Clarkston | 7.9% | 6.8%(+1.12)#70 | 7.6%(+0.247)#6,102 |
| 71. | Smithfield | 7.8% | 6.8%(+1.07)#71 | 7.6%(+0.194)#6,163 |
| 72. | Kaysville | 7.8% | 6.8%(+1.04)#72 | 7.6%(+0.164)#6,200 |
| 73. | Riverton | 7.7% | 6.8%(+0.910)#73 | 7.6%(+0.033)#6,382 |
| 74. | Richmond | 7.7% | 6.8%(+0.881)#74 | 7.6%(+0.004)#6,414 |
| 75. | Newton | 7.6% | 6.8%(+0.806)#75 | 7.6%(-0.072)#6,507 |
| 76. | Millcreek | 7.5% | 6.8%(+0.760)#76 | 7.6%(-0.118)#6,553 |
| 77. | Erda | 7.4% | 6.8%(+0.669)#77 | 7.6%(-0.209)#6,662 |
| 78. | Syracuse | 7.4% | 6.8%(+0.668)#78 | 7.6%(-0.210)#6,664 |
| 79. | Charleston | 7.4% | 6.8%(+0.638)#79 | 7.6%(-0.240)#6,709 |
| 80. | Mountain Green | 7.4% | 6.8%(+0.608)#80 | 7.6%(-0.270)#6,750 |
| 81. | Roy | 7.4% | 6.8%(+0.589)#81 | 7.6%(-0.288)#6,778 |
| 82. | Bountiful | 7.4% | 6.8%(+0.589)#82 | 7.6%(-0.289)#6,779 |
| 83. | Marriott Slaterville | 7.3% | 6.8%(+0.547)#83 | 7.6%(-0.330)#6,826 |
| 84. | Clinton | 7.3% | 6.8%(+0.512)#84 | 7.6%(-0.365)#6,882 |
| 85. | Heber | 7.3% | 6.8%(+0.492)#85 | 7.6%(-0.386)#6,906 |
| 86. | Clearfield | 7.2% | 6.8%(+0.478)#86 | 7.6%(-0.400)#6,919 |
| 87. | West Valley City | 7.2% | 6.8%(+0.471)#87 | 7.6%(-0.406)#6,931 |
| 88. | Midway | 7.2% | 6.8%(+0.460)#88 | 7.6%(-0.418)#6,947 |
| 89. | Lehi | 7.2% | 6.8%(+0.439)#89 | 7.6%(-0.439)#6,976 |
| 90. | Herriman | 7.2% | 6.8%(+0.428)#90 | 7.6%(-0.450)#6,992 |
| 91. | West Bountiful | 7.2% | 6.8%(+0.393)#91 | 7.6%(-0.484)#7,037 |
| 92. | West Jordan | 7.1% | 6.8%(+0.378)#92 | 7.6%(-0.500)#7,050 |
| 93. | Maeser | 7.1% | 6.8%(+0.373)#93 | 7.6%(-0.505)#7,053 |
| 94. | Moroni | 7.1% | 6.8%(+0.373)#94 | 7.6%(-0.505)#7,062 |
| 95. | Castle Valley | 7.1% | 6.8%(+0.373)#95 | 7.6%(-0.505)#7,073 |
| 96. | Taylorsville | 7.1% | 6.8%(+0.330)#96 | 7.6%(-0.548)#7,145 |
| 97. | Springdale | 7.1% | 6.8%(+0.306)#97 | 7.6%(-0.572)#7,175 |
| 98. | Elmo | 7.0% | 6.8%(+0.248)#98 | 7.6%(-0.630)#7,247 |
| 99. | Centerville | 7.0% | 6.8%(+0.231)#99 | 7.6%(-0.647)#7,270 |
| 100. | Gunnison | 7.0% | 6.8%(+0.195)#100 | 7.6%(-0.682)#7,319 |
Common Questions
What are the Top 10 Cities with the Highest Percentage of Population with a Degree in Engineering in Utah?
Top 10 Cities with the Highest Percentage of Population with a Degree in Engineering in Utah are:
#1
100.0%
#2
60.0%
#3
40.0%
#4
31.2%
#5
20.5%
#6
19.4%
#7
19.1%
#8
19.0%
#9
18.1%
#10
17.5%
What city has the Highest Percentage of Population with a Degree in Engineering in Utah?
Tselakai Dezza has the Highest Percentage of Population with a Degree in Engineering in Utah with 100.0%.
What is the Percentage of Population with a Degree in Engineering in the State of Utah?
Percentage of Population with a Degree in Engineering in Utah is 6.8%.
What is the Percentage of Population with a Degree in Engineering in the United States?
Percentage of Population with a Degree in Engineering in the United States is 7.6%.