Cities with the Highest Percentage of Population with a Degree in Engineering in Ohio
RELATED REPORTS & OPTIONS
Engineering
Ohio
Compare Cities
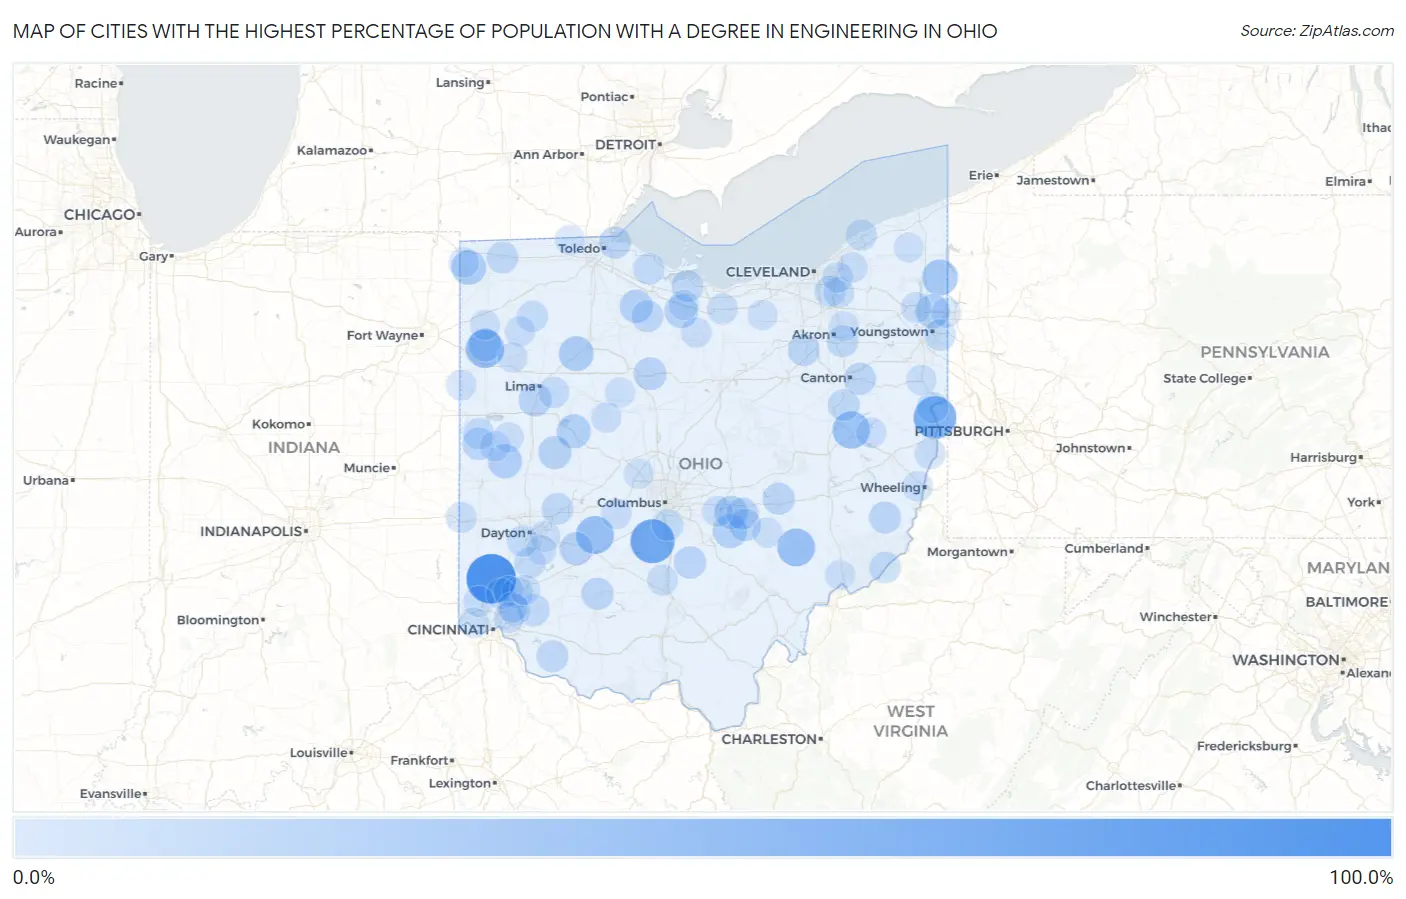
Map of Cities with the Highest Percentage of Population with a Degree in Engineering in Ohio
0.0%
100.0%
Cities with the Highest Percentage of Population with a Degree in Engineering in Ohio
| City | % Graduates | vs State | vs National | |
| 1. | Williamsdale | 100.0% | 7.4%(+92.6)#1 | 7.6%(+92.4)#3 |
| 2. | Darbyville | 75.0% | 7.4%(+67.6)#2 | 7.6%(+67.4)#76 |
| 3. | Stratton | 68.4% | 7.4%(+61.0)#3 | 7.6%(+60.8)#85 |
| 4. | Scott | 50.0% | 7.4%(+42.6)#4 | 7.6%(+42.4)#166 |
| 5. | South Solon | 48.0% | 7.4%(+40.6)#5 | 7.6%(+40.4)#192 |
| 6. | Mcconnelsville | 46.9% | 7.4%(+39.5)#6 | 7.6%(+39.2)#201 |
| 7. | Barnhill | 45.5% | 7.4%(+38.1)#7 | 7.6%(+37.8)#210 |
| 8. | Kinsman Center | 38.5% | 7.4%(+31.1)#8 | 7.6%(+30.8)#288 |
| 9. | Rawson | 33.3% | 7.4%(+26.0)#9 | 7.6%(+25.7)#356 |
| 10. | Blakeslee | 33.3% | 7.4%(+26.0)#10 | 7.6%(+25.7)#374 |
| 11. | Vienna Center | 31.0% | 7.4%(+23.6)#11 | 7.6%(+23.3)#414 |
| 12. | Russia | 30.6% | 7.4%(+23.3)#12 | 7.6%(+23.0)#426 |
| 13. | Bidwell | 30.4% | 7.4%(+23.0)#13 | 7.6%(+22.8)#430 |
| 14. | Huntsville | 30.2% | 7.4%(+22.9)#14 | 7.6%(+22.6)#433 |
| 15. | Maria Stein | 29.8% | 7.4%(+22.5)#15 | 7.6%(+22.2)#452 |
| 16. | Rushville | 29.3% | 7.4%(+21.9)#16 | 7.6%(+21.6)#467 |
| 17. | Flat Rock | 28.6% | 7.4%(+21.2)#17 | 7.6%(+20.9)#488 |
| 18. | Burgoon | 27.8% | 7.4%(+20.4)#18 | 7.6%(+20.1)#528 |
| 19. | Thornville | 27.7% | 7.4%(+20.3)#19 | 7.6%(+20.0)#533 |
| 20. | Quincy | 27.3% | 7.4%(+19.9)#20 | 7.6%(+19.6)#547 |
| 21. | Haviland | 26.9% | 7.4%(+19.5)#21 | 7.6%(+19.3)#561 |
| 22. | Shawnee Hills | 26.8% | 7.4%(+19.5)#22 | 7.6%(+19.2)#568 |
| 23. | Cridersville | 26.0% | 7.4%(+18.6)#23 | 7.6%(+18.3)#599 |
| 24. | Nevada | 25.0% | 7.4%(+17.6)#24 | 7.6%(+17.4)#645 |
| 25. | Burkettsville | 23.8% | 7.4%(+16.4)#25 | 7.6%(+16.2)#735 |
| 26. | Somerset | 22.8% | 7.4%(+15.5)#26 | 7.6%(+15.2)#787 |
| 27. | Tarlton | 22.6% | 7.4%(+15.2)#27 | 7.6%(+14.9)#799 |
| 28. | East Canton | 22.4% | 7.4%(+15.0)#28 | 7.6%(+14.7)#816 |
| 29. | Glenford | 22.2% | 7.4%(+14.8)#29 | 7.6%(+14.6)#832 |
| 30. | Highland | 22.2% | 7.4%(+14.8)#30 | 7.6%(+14.6)#842 |
| 31. | Wilson | 22.2% | 7.4%(+14.8)#31 | 7.6%(+14.6)#844 |
| 32. | Harbor View | 22.2% | 7.4%(+14.8)#32 | 7.6%(+14.6)#845 |
| 33. | Rittman | 22.1% | 7.4%(+14.7)#33 | 7.6%(+14.4)#851 |
| 34. | North Zanesville | 22.0% | 7.4%(+14.7)#34 | 7.6%(+14.4)#852 |
| 35. | Fort Seneca | 21.4% | 7.4%(+14.1)#35 | 7.6%(+13.8)#900 |
| 36. | Hamersville | 21.1% | 7.4%(+13.7)#36 | 7.6%(+13.4)#935 |
| 37. | Goshen | 21.0% | 7.4%(+13.6)#37 | 7.6%(+13.4)#944 |
| 38. | West Unity | 21.0% | 7.4%(+13.6)#38 | 7.6%(+13.3)#948 |
| 39. | Zoar | 20.8% | 7.4%(+13.5)#39 | 7.6%(+13.2)#966 |
| 40. | Castalia | 20.8% | 7.4%(+13.4)#40 | 7.6%(+13.2)#968 |
| 41. | Woodsdale | 20.8% | 7.4%(+13.4)#41 | 7.6%(+13.1)#976 |
| 42. | Sawyerwood | 20.4% | 7.4%(+13.0)#42 | 7.6%(+12.8)#999 |
| 43. | Donnelsville | 20.4% | 7.4%(+13.0)#43 | 7.6%(+12.8)#1,001 |
| 44. | Kingsville | 20.3% | 7.4%(+13.0)#44 | 7.6%(+12.7)#1,007 |
| 45. | Lockbourne | 20.0% | 7.4%(+12.6)#45 | 7.6%(+12.4)#1,045 |
| 46. | Oak Harbor | 19.8% | 7.4%(+12.4)#46 | 7.6%(+12.2)#1,086 |
| 47. | Five Points | 19.5% | 7.4%(+12.2)#47 | 7.6%(+11.9)#1,106 |
| 48. | St Henry | 19.4% | 7.4%(+12.0)#48 | 7.6%(+11.7)#1,122 |
| 49. | Matamoras | 19.4% | 7.4%(+12.0)#49 | 7.6%(+11.7)#1,123 |
| 50. | Wellsville | 19.3% | 7.4%(+11.9)#50 | 7.6%(+11.7)#1,126 |
| 51. | Campbell | 18.9% | 7.4%(+11.5)#51 | 7.6%(+11.2)#1,181 |
| 52. | New Bavaria | 18.8% | 7.4%(+11.4)#52 | 7.6%(+11.1)#1,198 |
| 53. | Moraine | 18.7% | 7.4%(+11.3)#53 | 7.6%(+11.0)#1,205 |
| 54. | Grand River | 18.5% | 7.4%(+11.1)#54 | 7.6%(+10.9)#1,212 |
| 55. | Westminster | 18.0% | 7.4%(+10.6)#55 | 7.6%(+10.4)#1,297 |
| 56. | Mason | 17.8% | 7.4%(+10.4)#56 | 7.6%(+10.1)#1,320 |
| 57. | Walton Hills | 17.6% | 7.4%(+10.2)#57 | 7.6%(+9.96)#1,337 |
| 58. | Andersonville | 17.3% | 7.4%(+9.93)#58 | 7.6%(+9.66)#1,394 |
| 59. | New Paris | 17.0% | 7.4%(+9.59)#59 | 7.6%(+9.32)#1,450 |
| 60. | Millersport | 16.7% | 7.4%(+9.29)#60 | 7.6%(+9.02)#1,500 |
| 61. | Glenwillow | 16.7% | 7.4%(+9.29)#61 | 7.6%(+9.02)#1,501 |
| 62. | Collins | 16.7% | 7.4%(+9.29)#62 | 7.6%(+9.02)#1,510 |
| 63. | New Alexandria | 16.7% | 7.4%(+9.29)#63 | 7.6%(+9.02)#1,517 |
| 64. | Remington | 16.6% | 7.4%(+9.22)#64 | 7.6%(+8.95)#1,546 |
| 65. | Woodmere | 16.6% | 7.4%(+9.19)#65 | 7.6%(+8.92)#1,552 |
| 66. | Dunlap | 16.5% | 7.4%(+9.13)#66 | 7.6%(+8.85)#1,562 |
| 67. | Beckett Ridge | 16.3% | 7.4%(+8.94)#67 | 7.6%(+8.66)#1,597 |
| 68. | Morgandale | 16.0% | 7.4%(+8.63)#68 | 7.6%(+8.35)#1,646 |
| 69. | Wetherington | 16.0% | 7.4%(+8.60)#69 | 7.6%(+8.32)#1,662 |
| 70. | Beavercreek | 15.9% | 7.4%(+8.52)#70 | 7.6%(+8.25)#1,680 |
| 71. | Wolfhurst | 15.7% | 7.4%(+8.29)#71 | 7.6%(+8.02)#1,742 |
| 72. | London | 15.5% | 7.4%(+8.15)#72 | 7.6%(+7.88)#1,767 |
| 73. | Holiday Lakes | 15.5% | 7.4%(+8.09)#73 | 7.6%(+7.82)#1,776 |
| 74. | Willshire | 15.4% | 7.4%(+8.01)#74 | 7.6%(+7.74)#1,791 |
| 75. | Madeira | 15.0% | 7.4%(+7.66)#75 | 7.6%(+7.38)#1,865 |
| 76. | Chesterland | 15.0% | 7.4%(+7.63)#76 | 7.6%(+7.36)#1,870 |
| 77. | Mount Victory | 15.0% | 7.4%(+7.63)#77 | 7.6%(+7.35)#1,873 |
| 78. | Osgood | 15.0% | 7.4%(+7.63)#78 | 7.6%(+7.35)#1,875 |
| 79. | Edon | 14.8% | 7.4%(+7.41)#79 | 7.6%(+7.14)#1,915 |
| 80. | Montgomery | 14.7% | 7.4%(+7.34)#80 | 7.6%(+7.07)#1,929 |
| 81. | Bowerston | 14.7% | 7.4%(+7.33)#81 | 7.6%(+7.06)#1,933 |
| 82. | Lisbon | 14.7% | 7.4%(+7.31)#82 | 7.6%(+7.04)#1,939 |
| 83. | Continental | 14.7% | 7.4%(+7.29)#83 | 7.6%(+7.02)#1,943 |
| 84. | Minster | 14.5% | 7.4%(+7.15)#84 | 7.6%(+6.88)#1,973 |
| 85. | Ottoville | 14.5% | 7.4%(+7.12)#85 | 7.6%(+6.85)#1,979 |
| 86. | West Hill | 14.3% | 7.4%(+6.96)#86 | 7.6%(+6.69)#2,013 |
| 87. | Paulding | 14.3% | 7.4%(+6.91)#87 | 7.6%(+6.64)#2,019 |
| 88. | Berkey | 14.3% | 7.4%(+6.91)#88 | 7.6%(+6.64)#2,044 |
| 89. | Marseilles | 14.3% | 7.4%(+6.91)#89 | 7.6%(+6.64)#2,064 |
| 90. | Bellbrook | 14.2% | 7.4%(+6.85)#90 | 7.6%(+6.57)#2,084 |
| 91. | Mack | 14.2% | 7.4%(+6.84)#91 | 7.6%(+6.57)#2,087 |
| 92. | Bellevue | 14.1% | 7.4%(+6.72)#92 | 7.6%(+6.45)#2,115 |
| 93. | Crooksville | 14.0% | 7.4%(+6.58)#93 | 7.6%(+6.31)#2,160 |
| 94. | South Lebanon | 13.9% | 7.4%(+6.52)#94 | 7.6%(+6.25)#2,181 |
| 95. | Rock Creek | 13.9% | 7.4%(+6.51)#95 | 7.6%(+6.24)#2,185 |
| 96. | Suffield | 13.9% | 7.4%(+6.49)#96 | 7.6%(+6.21)#2,198 |
| 97. | Pheasant Run | 13.8% | 7.4%(+6.47)#97 | 7.6%(+6.20)#2,203 |
| 98. | New California | 13.8% | 7.4%(+6.43)#98 | 7.6%(+6.16)#2,208 |
| 99. | Munroe Falls | 13.8% | 7.4%(+6.41)#99 | 7.6%(+6.14)#2,227 |
| 100. | Devola | 13.8% | 7.4%(+6.39)#100 | 7.6%(+6.12)#2,229 |
Common Questions
What are the Top 10 Cities with the Highest Percentage of Population with a Degree in Engineering in Ohio?
Top 10 Cities with the Highest Percentage of Population with a Degree in Engineering in Ohio are:
#1
100.0%
#2
75.0%
#3
68.4%
#4
50.0%
#5
48.0%
#6
46.9%
#7
45.5%
#8
38.5%
#9
33.3%
#10
33.3%
What city has the Highest Percentage of Population with a Degree in Engineering in Ohio?
Williamsdale has the Highest Percentage of Population with a Degree in Engineering in Ohio with 100.0%.
What is the Percentage of Population with a Degree in Engineering in the State of Ohio?
Percentage of Population with a Degree in Engineering in Ohio is 7.4%.
What is the Percentage of Population with a Degree in Engineering in the United States?
Percentage of Population with a Degree in Engineering in the United States is 7.6%.