Cities with the Highest Percentage of Population with a Degree in Engineering in North Dakota
RELATED REPORTS & OPTIONS
Engineering
North Dakota
Compare Cities
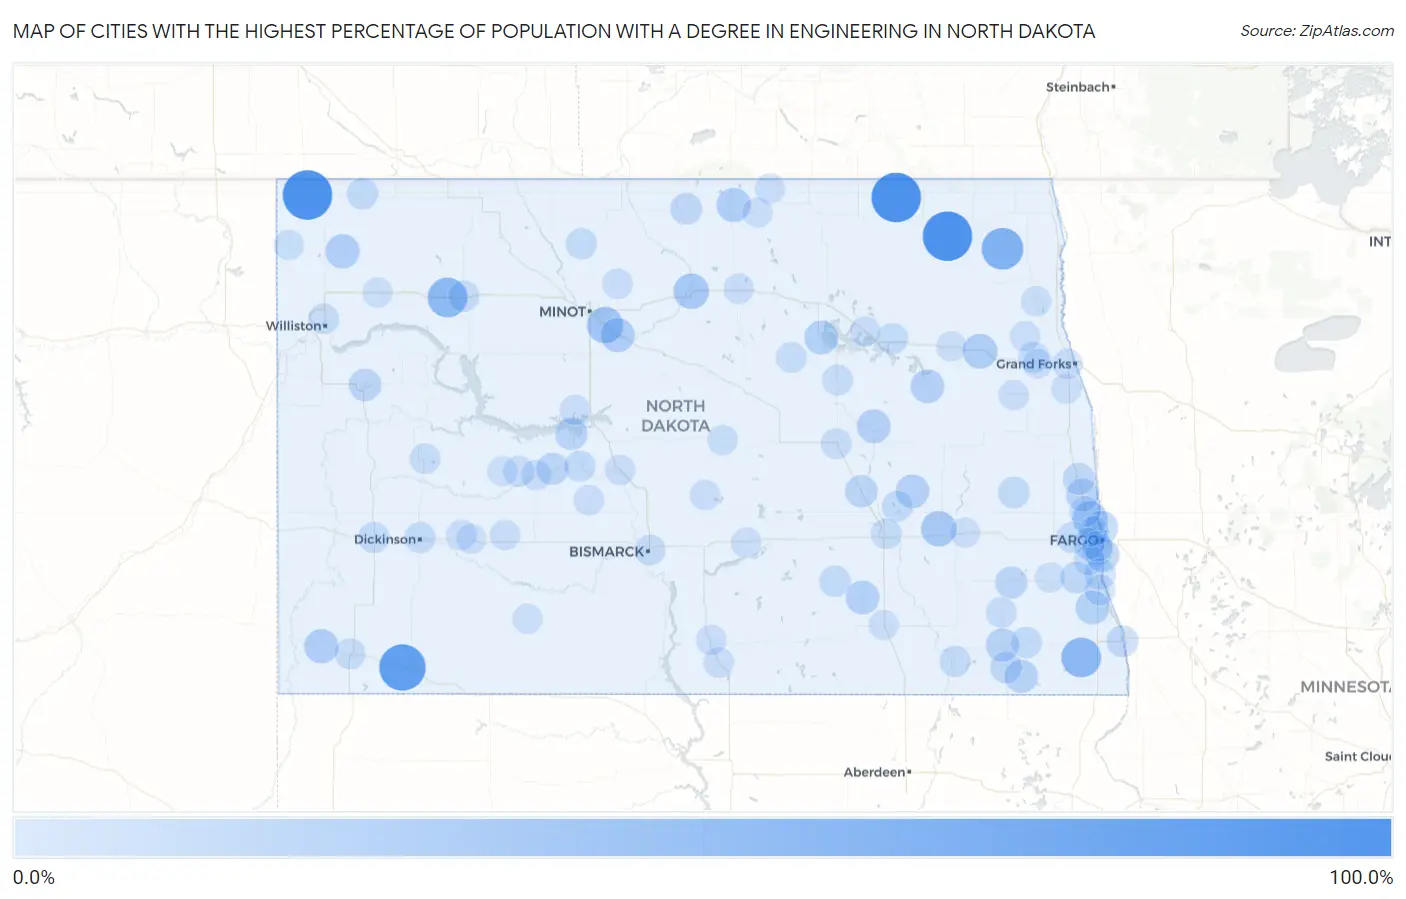
Map of Cities with the Highest Percentage of Population with a Degree in Engineering in North Dakota
0.0%
100.0%
Cities with the Highest Percentage of Population with a Degree in Engineering in North Dakota
| City | % Graduates | vs State | vs National | |
| 1. | Osnabrock | 100.0% | 5.2%(+94.8)#1 | 7.6%(+92.4)#24 |
| 2. | Fortuna | 100.0% | 5.2%(+94.8)#2 | 7.6%(+92.4)#50 |
| 3. | Wales | 100.0% | 5.2%(+94.8)#3 | 7.6%(+92.4)#59 |
| 4. | Reeder | 83.3% | 5.2%(+78.1)#4 | 7.6%(+75.7)#70 |
| 5. | Crystal | 59.4% | 5.2%(+54.1)#5 | 7.6%(+51.7)#127 |
| 6. | Ross | 50.0% | 5.2%(+44.8)#6 | 7.6%(+42.4)#168 |
| 7. | Mantador | 50.0% | 5.2%(+44.8)#7 | 7.6%(+42.4)#178 |
| 8. | Logan | 33.3% | 5.2%(+28.1)#8 | 7.6%(+25.7)#359 |
| 9. | Sanborn | 28.6% | 5.2%(+23.3)#9 | 7.6%(+20.9)#493 |
| 10. | Towner | 28.3% | 5.2%(+23.1)#10 | 7.6%(+20.7)#512 |
| 11. | Brooktree Park | 25.3% | 5.2%(+20.1)#11 | 7.6%(+17.7)#628 |
| 12. | Niagara | 25.0% | 5.2%(+19.8)#12 | 7.6%(+17.4)#681 |
| 13. | Rhame | 23.1% | 5.2%(+17.8)#13 | 7.6%(+15.4)#775 |
| 14. | Alamo | 23.1% | 5.2%(+17.8)#14 | 7.6%(+15.4)#779 |
| 15. | East Dunseith | 22.7% | 5.2%(+17.5)#15 | 7.6%(+15.1)#791 |
| 16. | Sawyer | 22.5% | 5.2%(+17.3)#16 | 7.6%(+14.9)#807 |
| 17. | Minnewaukan | 20.8% | 5.2%(+15.5)#17 | 7.6%(+13.1)#977 |
| 18. | Colfax | 20.7% | 5.2%(+15.4)#18 | 7.6%(+13.0)#987 |
| 19. | Pekin | 20.0% | 5.2%(+14.8)#19 | 7.6%(+12.4)#1,066 |
| 20. | Grace City | 20.0% | 5.2%(+14.8)#20 | 7.6%(+12.4)#1,068 |
| 21. | Jud | 20.0% | 5.2%(+14.8)#21 | 7.6%(+12.4)#1,069 |
| 22. | Wimbledon | 19.2% | 5.2%(+14.0)#22 | 7.6%(+11.6)#1,143 |
| 23. | Briarwood | 19.0% | 5.2%(+13.8)#23 | 7.6%(+11.4)#1,160 |
| 24. | Gwinner | 18.4% | 5.2%(+13.1)#24 | 7.6%(+10.7)#1,225 |
| 25. | Rutland | 18.2% | 5.2%(+12.9)#25 | 7.6%(+10.5)#1,275 |
| 26. | North River | 18.2% | 5.2%(+12.9)#26 | 7.6%(+10.5)#1,277 |
| 27. | Gardner | 15.4% | 5.2%(+10.1)#27 | 7.6%(+7.74)#1,798 |
| 28. | Watford City | 15.3% | 5.2%(+10.0)#28 | 7.6%(+7.64)#1,808 |
| 29. | Pick City | 14.3% | 5.2%(+9.04)#29 | 7.6%(+6.64)#2,060 |
| 30. | Pingree | 14.3% | 5.2%(+9.04)#30 | 7.6%(+6.64)#2,067 |
| 31. | Hazen | 13.1% | 5.2%(+7.81)#31 | 7.6%(+5.40)#2,465 |
| 32. | Enderlin | 12.8% | 5.2%(+7.57)#32 | 7.6%(+5.17)#2,554 |
| 33. | Grandin | 11.8% | 5.2%(+6.52)#33 | 7.6%(+4.12)#3,004 |
| 34. | Kindred | 11.4% | 5.2%(+6.15)#34 | 7.6%(+3.75)#3,170 |
| 35. | Forman | 11.3% | 5.2%(+6.07)#35 | 7.6%(+3.67)#3,215 |
| 36. | Bottineau | 10.8% | 5.2%(+5.59)#36 | 7.6%(+3.19)#3,501 |
| 37. | Wahpeton | 10.8% | 5.2%(+5.53)#37 | 7.6%(+3.13)#3,536 |
| 38. | Page | 10.5% | 5.2%(+5.28)#38 | 7.6%(+2.88)#3,710 |
| 39. | Prairie Rose | 10.0% | 5.2%(+4.75)#39 | 7.6%(+2.35)#4,104 |
| 40. | Oxbow | 9.9% | 5.2%(+4.69)#40 | 7.6%(+2.29)#4,141 |
| 41. | Mapleton | 9.8% | 5.2%(+4.52)#41 | 7.6%(+2.12)#4,269 |
| 42. | Crosby | 9.1% | 5.2%(+3.84)#42 | 7.6%(+1.44)#4,796 |
| 43. | Gackle | 9.1% | 5.2%(+3.84)#43 | 7.6%(+1.44)#4,812 |
| 44. | West Fargo | 8.9% | 5.2%(+3.62)#44 | 7.6%(+1.22)#5,052 |
| 45. | Stanley | 8.8% | 5.2%(+3.59)#45 | 7.6%(+1.19)#5,076 |
| 46. | Milnor | 8.8% | 5.2%(+3.58)#46 | 7.6%(+1.18)#5,092 |
| 47. | Grand Forks Afb | 8.7% | 5.2%(+3.41)#47 | 7.6%(+1.01)#5,247 |
| 48. | Stanton | 8.6% | 5.2%(+3.32)#48 | 7.6%(+0.924)#5,332 |
| 49. | Belfield | 8.3% | 5.2%(+3.09)#49 | 7.6%(+0.686)#5,559 |
| 50. | Lansford | 8.3% | 5.2%(+3.09)#50 | 7.6%(+0.686)#5,580 |
| 51. | Crary | 8.3% | 5.2%(+3.09)#51 | 7.6%(+0.686)#5,589 |
| 52. | Dickinson | 7.9% | 5.2%(+2.63)#52 | 7.6%(+0.230)#6,120 |
| 53. | Spiritwood Lake | 7.8% | 5.2%(+2.57)#53 | 7.6%(+0.165)#6,199 |
| 54. | Oakes | 7.5% | 5.2%(+2.25)#54 | 7.6%(-0.155)#6,610 |
| 55. | Zap | 7.1% | 5.2%(+1.90)#55 | 7.6%(-0.505)#7,091 |
| 56. | Bowman | 6.9% | 5.2%(+1.70)#56 | 7.6%(-0.703)#7,352 |
| 57. | Maddock | 6.8% | 5.2%(+1.60)#57 | 7.6%(-0.798)#7,480 |
| 58. | Lisbon | 6.6% | 5.2%(+1.38)#58 | 7.6%(-1.02)#7,804 |
| 59. | Jamestown | 6.6% | 5.2%(+1.34)#59 | 7.6%(-1.06)#7,868 |
| 60. | Bismarck | 6.5% | 5.2%(+1.24)#60 | 7.6%(-1.16)#8,011 |
| 61. | Sheyenne | 6.5% | 5.2%(+1.20)#61 | 7.6%(-1.20)#8,068 |
| 62. | Killdeer | 6.2% | 5.2%(+1.00)#62 | 7.6%(-1.40)#8,392 |
| 63. | Christine | 6.1% | 5.2%(+0.814)#63 | 7.6%(-1.59)#8,756 |
| 64. | Williston | 6.0% | 5.2%(+0.705)#64 | 7.6%(-1.70)#8,906 |
| 65. | Carrington | 5.9% | 5.2%(+0.694)#65 | 7.6%(-1.71)#8,928 |
| 66. | Deering | 5.6% | 5.2%(+0.309)#66 | 7.6%(-2.09)#9,585 |
| 67. | Taylor | 5.4% | 5.2%(+0.110)#67 | 7.6%(-2.29)#9,916 |
| 68. | Grand Forks | 5.4% | 5.2%(+0.103)#68 | 7.6%(-2.30)#9,926 |
| 69. | Strasburg | 5.3% | 5.2%(+0.016)#69 | 7.6%(-2.38)#10,079 |
| 70. | Wing | 5.3% | 5.2%(+0.016)#70 | 7.6%(-2.38)#10,093 |
| 71. | Goodrich | 5.3% | 5.2%(+0.016)#71 | 7.6%(-2.38)#10,100 |
| 72. | Argusville | 5.2% | 5.2%(-0.030)#72 | 7.6%(-2.43)#10,144 |
| 73. | Center | 5.0% | 5.2%(-0.247)#73 | 7.6%(-2.65)#10,539 |
| 74. | Beulah | 4.9% | 5.2%(-0.324)#74 | 7.6%(-2.72)#10,672 |
| 75. | Devils Lake | 4.9% | 5.2%(-0.337)#75 | 7.6%(-2.74)#10,696 |
| 76. | Horace | 4.9% | 5.2%(-0.381)#76 | 7.6%(-2.78)#10,785 |
| 77. | Northwood | 4.8% | 5.2%(-0.428)#77 | 7.6%(-2.83)#10,869 |
| 78. | Linton | 4.8% | 5.2%(-0.462)#78 | 7.6%(-2.86)#10,938 |
| 79. | Reile S Acres | 4.8% | 5.2%(-0.469)#79 | 7.6%(-2.87)#10,949 |
| 80. | Washburn | 4.8% | 5.2%(-0.485)#80 | 7.6%(-2.89)#10,971 |
| 81. | Fargo | 4.8% | 5.2%(-0.490)#81 | 7.6%(-2.89)#11,002 |
| 82. | Rugby | 4.7% | 5.2%(-0.577)#82 | 7.6%(-2.98)#11,110 |
| 83. | Gilby | 4.4% | 5.2%(-0.803)#83 | 7.6%(-3.20)#11,528 |
| 84. | Garrison | 4.4% | 5.2%(-0.842)#84 | 7.6%(-3.24)#11,597 |
| 85. | Grenora | 4.3% | 5.2%(-0.992)#85 | 7.6%(-3.39)#11,855 |
| 86. | Steele | 4.2% | 5.2%(-1.08)#86 | 7.6%(-3.48)#12,014 |
| 87. | Hebron | 4.2% | 5.2%(-1.08)#87 | 7.6%(-3.48)#12,016 |
| 88. | Minto | 4.2% | 5.2%(-1.08)#88 | 7.6%(-3.48)#12,022 |
| 89. | St John | 4.0% | 5.2%(-1.25)#89 | 7.6%(-3.65)#12,316 |
| 90. | Shell Valley | 3.7% | 5.2%(-1.54)#90 | 7.6%(-3.94)#12,828 |
| 91. | Elgin | 3.7% | 5.2%(-1.54)#91 | 7.6%(-3.94)#12,835 |
| 92. | Michigan City | 3.7% | 5.2%(-1.54)#92 | 7.6%(-3.94)#12,849 |
| 93. | Golden Valley | 3.6% | 5.2%(-1.61)#93 | 7.6%(-4.01)#12,976 |
| 94. | Thompson | 3.6% | 5.2%(-1.63)#94 | 7.6%(-4.03)#13,002 |
| 95. | Edgeley | 3.6% | 5.2%(-1.68)#95 | 7.6%(-4.08)#13,094 |
| 96. | Leonard | 3.5% | 5.2%(-1.74)#96 | 7.6%(-4.14)#13,216 |
| 97. | Ray | 3.4% | 5.2%(-1.80)#97 | 7.6%(-4.20)#13,302 |
| 98. | Richardton | 3.4% | 5.2%(-1.83)#98 | 7.6%(-4.23)#13,357 |
| 99. | Emerado | 3.3% | 5.2%(-1.91)#99 | 7.6%(-4.31)#13,508 |
| 100. | Valley City | 3.3% | 5.2%(-1.97)#100 | 7.6%(-4.37)#13,607 |
Common Questions
What are the Top 10 Cities with the Highest Percentage of Population with a Degree in Engineering in North Dakota?
Top 10 Cities with the Highest Percentage of Population with a Degree in Engineering in North Dakota are:
What city has the Highest Percentage of Population with a Degree in Engineering in North Dakota?
Osnabrock has the Highest Percentage of Population with a Degree in Engineering in North Dakota with 100.0%.
What is the Percentage of Population with a Degree in Engineering in the State of North Dakota?
Percentage of Population with a Degree in Engineering in North Dakota is 5.2%.
What is the Percentage of Population with a Degree in Engineering in the United States?
Percentage of Population with a Degree in Engineering in the United States is 7.6%.