Homewood Canyon, CA Map & Demographics
Homewood Canyon Map
Homewood Canyon Overview
$39,032
PER CAPITA INCOME
0.36
INEQUALITY / GINI INDEX
224
TOTAL POPULATION
102
MALE POPULATION
122
FEMALE POPULATION
83.61
MALES / 100 FEMALES
119.61
FEMALES / 100 MALES
50.3
MEDIAN AGE
3.3
AVG FAMILY SIZE
3.0
AVG HOUSEHOLD SIZE
155
LABOR FORCE [ PEOPLE ]
69.2%
PERCENT IN LABOR FORCE
Income in Homewood Canyon
Income Overview in Homewood Canyon
| Characteristic | Number | Measure |
| Per Capita Income | 224 | $39,032 |
| Median Family Income | 64 | $0 |
| Mean Family Income | 64 | $85,947 |
| Median Household Income | 75 | $0 |
| Mean Household Income | 75 | $84,300 |
| Income Deficit | 64 | $0 |
| Wage / Income Gap (%) | 224 | 0.00% |
| Wage / Income Gap ($) | 224 | 100.00¢ per $1 |
| Gini / Inequality Index | 224 | 0.36 |
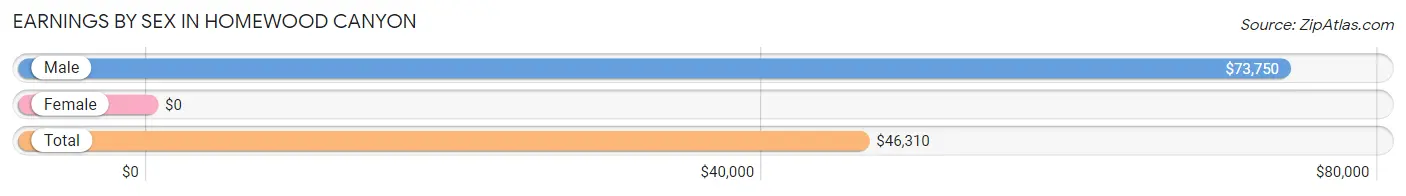
Earnings by Sex in Homewood Canyon
| Sex | Number | Average Earnings |
| Male | 65 (41.9%) | $73,750 |
| Female | 90 (58.1%) | $0 |
| Total | 155 (100.0%) | $46,310 |
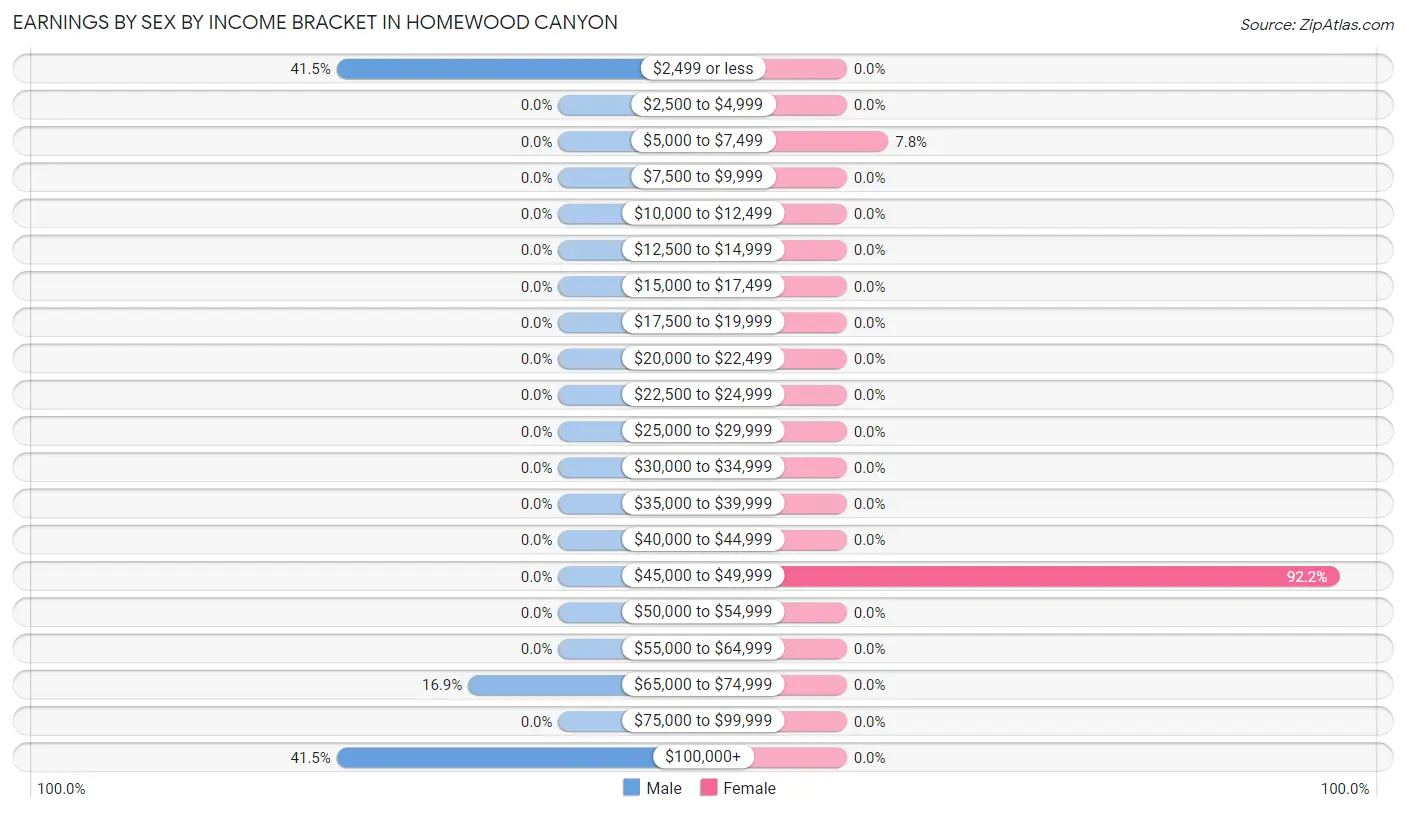
Earnings by Sex by Income Bracket in Homewood Canyon
The most common earnings brackets in Homewood Canyon are $2,499 or less for men (27 | 41.5%) and $45,000 to $49,999 for women (83 | 92.2%).
| Income | Male | Female |
| $2,499 or less | 27 (41.5%) | 0 (0.0%) |
| $2,500 to $4,999 | 0 (0.0%) | 0 (0.0%) |
| $5,000 to $7,499 | 0 (0.0%) | 7 (7.8%) |
| $7,500 to $9,999 | 0 (0.0%) | 0 (0.0%) |
| $10,000 to $12,499 | 0 (0.0%) | 0 (0.0%) |
| $12,500 to $14,999 | 0 (0.0%) | 0 (0.0%) |
| $15,000 to $17,499 | 0 (0.0%) | 0 (0.0%) |
| $17,500 to $19,999 | 0 (0.0%) | 0 (0.0%) |
| $20,000 to $22,499 | 0 (0.0%) | 0 (0.0%) |
| $22,500 to $24,999 | 0 (0.0%) | 0 (0.0%) |
| $25,000 to $29,999 | 0 (0.0%) | 0 (0.0%) |
| $30,000 to $34,999 | 0 (0.0%) | 0 (0.0%) |
| $35,000 to $39,999 | 0 (0.0%) | 0 (0.0%) |
| $40,000 to $44,999 | 0 (0.0%) | 0 (0.0%) |
| $45,000 to $49,999 | 0 (0.0%) | 83 (92.2%) |
| $50,000 to $54,999 | 0 (0.0%) | 0 (0.0%) |
| $55,000 to $64,999 | 0 (0.0%) | 0 (0.0%) |
| $65,000 to $74,999 | 11 (16.9%) | 0 (0.0%) |
| $75,000 to $99,999 | 0 (0.0%) | 0 (0.0%) |
| $100,000+ | 27 (41.5%) | 0 (0.0%) |
| Total | 65 (100.0%) | 90 (100.0%) |
Earnings by Sex by Educational Attainment in Homewood Canyon
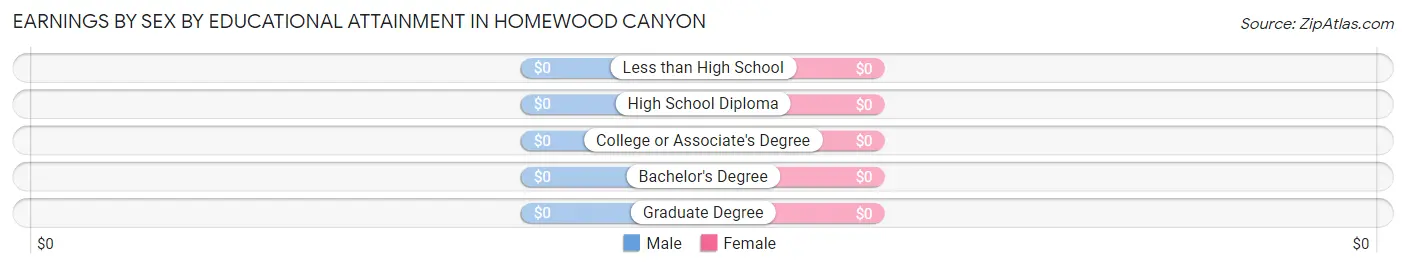
| Educational Attainment | Male Income | Female Income |
| Less than High School | - | - |
| High School Diploma | - | - |
| College or Associate's Degree | - | - |
| Bachelor's Degree | - | - |
| Graduate Degree | - | - |
| Total | - | - |
Family Income in Homewood Canyon
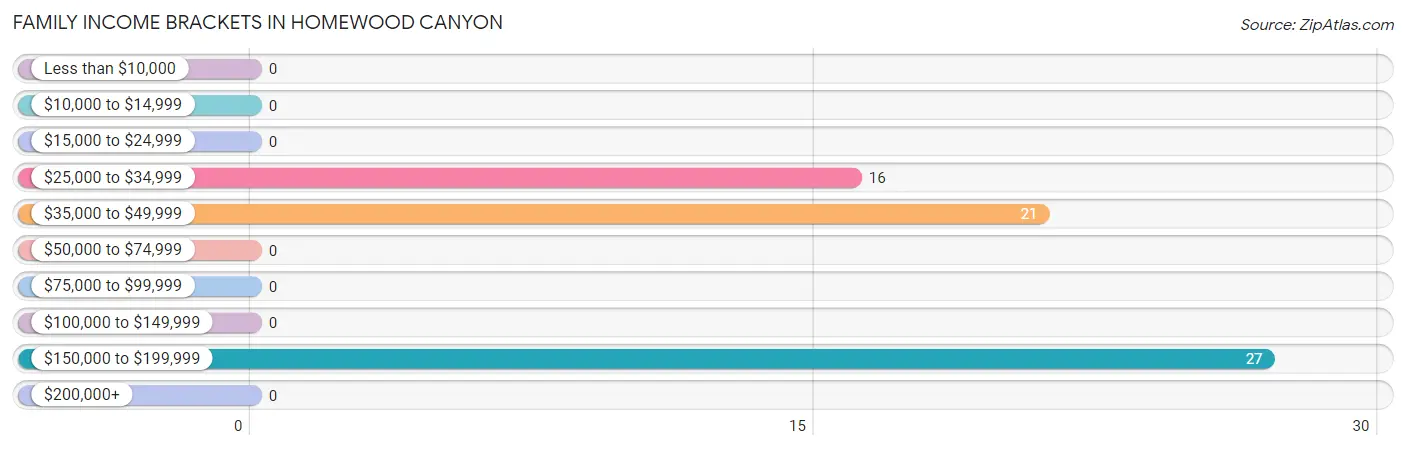
Family Income Brackets in Homewood Canyon
According to the Homewood Canyon family income data, there are 27 families falling into the $150,000 to $199,999 income range, which is the most common income bracket and makes up 42.2% of all families.
| Income Bracket | # Families | % Families |
| Less than $10,000 | 0 | 0.0% |
| $10,000 to $14,999 | 0 | 0.0% |
| $15,000 to $24,999 | 0 | 0.0% |
| $25,000 to $34,999 | 16 | 25.0% |
| $35,000 to $49,999 | 21 | 32.8% |
| $50,000 to $74,999 | 0 | 0.0% |
| $75,000 to $99,999 | 0 | 0.0% |
| $100,000 to $149,999 | 0 | 0.0% |
| $150,000 to $199,999 | 27 | 42.2% |
| $200,000+ | 0 | 0.0% |
Family Income by Famaliy Size in Homewood Canyon
| Income Bracket | # Families | Median Income |
| 2-Person Families | 37 (57.8%) | $0 |
| 3-Person Families | 0 (0.0%) | $0 |
| 4-Person Families | 27 (42.2%) | $0 |
| 5-Person Families | 0 (0.0%) | $0 |
| 6-Person Families | 0 (0.0%) | $0 |
| 7+ Person Families | 0 (0.0%) | $0 |
| Total | 64 (100.0%) | $0 |
Family Income by Number of Earners in Homewood Canyon
| Number of Earners | # Families | Median Income |
| No Earners | 37 (57.8%) | $0 |
| 1 Earner | 0 (0.0%) | $0 |
| 2 Earners | 0 (0.0%) | $0 |
| 3+ Earners | 27 (42.2%) | $0 |
| Total | 64 (100.0%) | $0 |
Household Income in Homewood Canyon
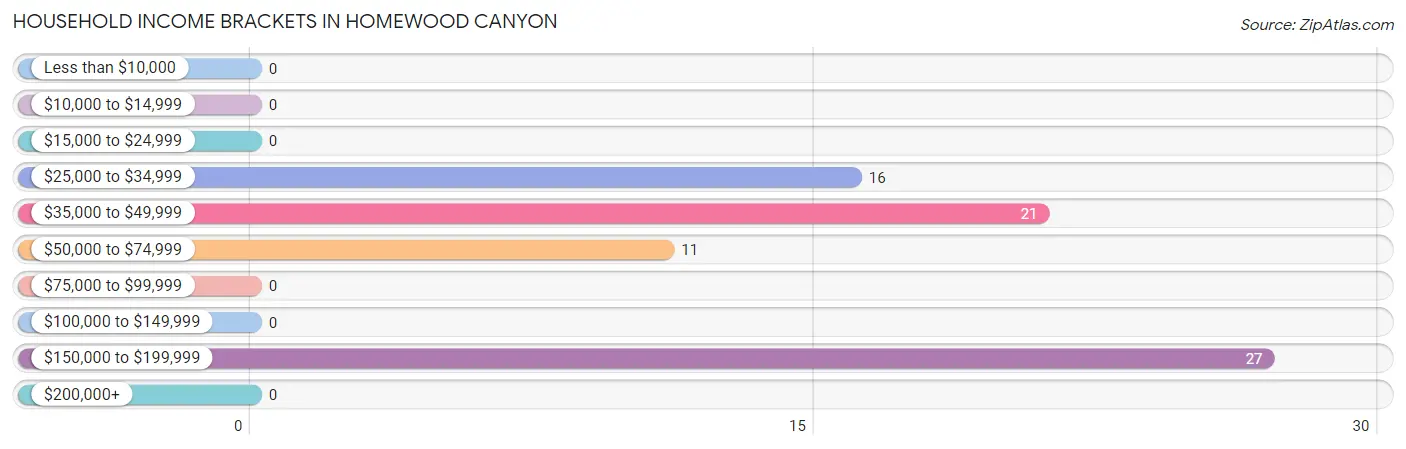
Household Income Brackets in Homewood Canyon
With 27 households falling in the category, the $150,000 to $199,999 income range is the most frequent in Homewood Canyon, accounting for 36.0% of all households.
| Income Bracket | # Households | % Households |
| Less than $10,000 | 0 | 0.0% |
| $10,000 to $14,999 | 0 | 0.0% |
| $15,000 to $24,999 | 0 | 0.0% |
| $25,000 to $34,999 | 16 | 21.3% |
| $35,000 to $49,999 | 21 | 28.0% |
| $50,000 to $74,999 | 11 | 14.7% |
| $75,000 to $99,999 | 0 | 0.0% |
| $100,000 to $149,999 | 0 | 0.0% |
| $150,000 to $199,999 | 27 | 36.0% |
| $200,000+ | 0 | 0.0% |
Household Income by Householder Age in Homewood Canyon
| Income Bracket | # Households | Median Income |
| 15 to 24 Years | 0 (0.0%) | $0 |
| 25 to 44 Years | 0 (0.0%) | $0 |
| 45 to 64 Years | 38 (50.7%) | $0 |
| 65+ Years | 37 (49.3%) | $0 |
| Total | 75 (100.0%) | $0 |
Poverty in Homewood Canyon
Income Below Poverty by Sex and Age in Homewood Canyon
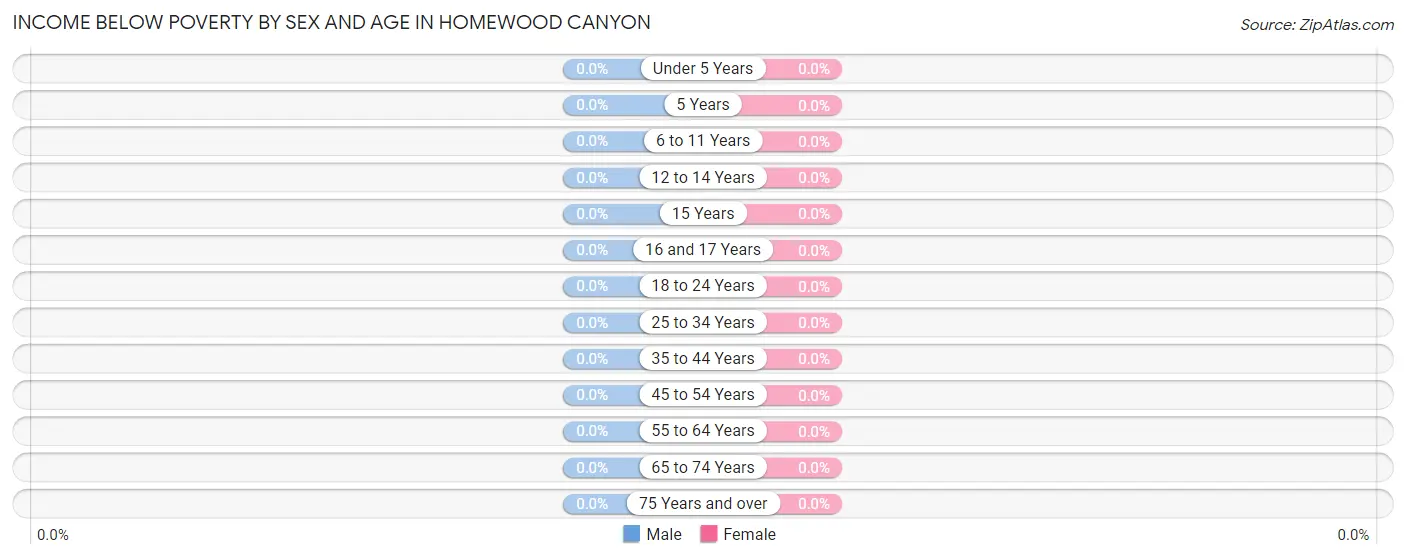
| Age Bracket | Male | Female |
| Under 5 Years | 0 (0.0%) | 0 (0.0%) |
| 5 Years | 0 (0.0%) | 0 (0.0%) |
| 6 to 11 Years | 0 (0.0%) | 0 (0.0%) |
| 12 to 14 Years | 0 (0.0%) | 0 (0.0%) |
| 15 Years | 0 (0.0%) | 0 (0.0%) |
| 16 and 17 Years | 0 (0.0%) | 0 (0.0%) |
| 18 to 24 Years | 0 (0.0%) | 0 (0.0%) |
| 25 to 34 Years | 0 (0.0%) | 0 (0.0%) |
| 35 to 44 Years | 0 (0.0%) | 0 (0.0%) |
| 45 to 54 Years | 0 (0.0%) | 0 (0.0%) |
| 55 to 64 Years | 0 (0.0%) | 0 (0.0%) |
| 65 to 74 Years | 0 (0.0%) | 0 (0.0%) |
| 75 Years and over | 0 (0.0%) | 0 (0.0%) |
| Total | 0 (0.0%) | 0 (0.0%) |
Income Above Poverty by Sex and Age in Homewood Canyon
According to the poverty statistics in Homewood Canyon, males aged 16 and 17 years and females aged 25 to 34 years are the age groups that are most secure financially, with 100.0% of males and 100.0% of females in these age groups living above the poverty line.
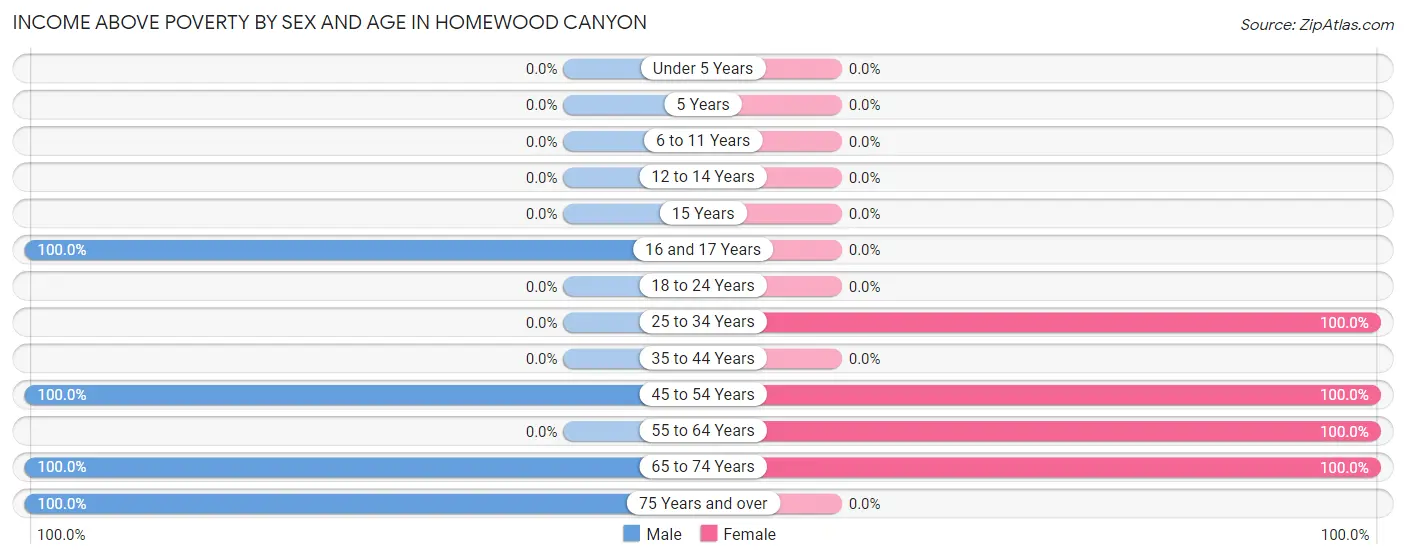
| Age Bracket | Male | Female |
| Under 5 Years | 0 (0.0%) | 0 (0.0%) |
| 5 Years | 0 (0.0%) | 0 (0.0%) |
| 6 to 11 Years | 0 (0.0%) | 0 (0.0%) |
| 12 to 14 Years | 0 (0.0%) | 0 (0.0%) |
| 15 Years | 0 (0.0%) | 0 (0.0%) |
| 16 and 17 Years | 27 (100.0%) | 0 (0.0%) |
| 18 to 24 Years | 0 (0.0%) | 0 (0.0%) |
| 25 to 34 Years | 0 (0.0%) | 83 (100.0%) |
| 35 to 44 Years | 0 (0.0%) | 0 (0.0%) |
| 45 to 54 Years | 38 (100.0%) | 7 (100.0%) |
| 55 to 64 Years | 0 (0.0%) | 12 (100.0%) |
| 65 to 74 Years | 21 (100.0%) | 20 (100.0%) |
| 75 Years and over | 16 (100.0%) | 0 (0.0%) |
| Total | 102 (100.0%) | 122 (100.0%) |
Income Below Poverty Among Married-Couple Families in Homewood Canyon
| Children | Above Poverty | Below Poverty |
| No Children | 37 (100.0%) | 0 (0.0%) |
| 1 or 2 Children | 27 (100.0%) | 0 (0.0%) |
| 3 or 4 Children | 0 (0.0%) | 0 (0.0%) |
| 5 or more Children | 0 (0.0%) | 0 (0.0%) |
| Total | 64 (100.0%) | 0 (0.0%) |
Income Below Poverty Among Single-Parent Households in Homewood Canyon
| Children | Single Father | Single Mother |
| No Children | 0 (0.0%) | 0 (0.0%) |
| 1 or 2 Children | 0 (0.0%) | 0 (0.0%) |
| 3 or 4 Children | 0 (0.0%) | 0 (0.0%) |
| 5 or more Children | 0 (0.0%) | 0 (0.0%) |
| Total | 0 (0.0%) | 0 (0.0%) |
Income Below Poverty Among Married-Couple vs Single-Parent Households in Homewood Canyon
| Children | Married-Couple Families | Single-Parent Households |
| No Children | 0 (0.0%) | 0 (0.0%) |
| 1 or 2 Children | 0 (0.0%) | 0 (0.0%) |
| 3 or 4 Children | 0 (0.0%) | 0 (0.0%) |
| 5 or more Children | 0 (0.0%) | 0 (0.0%) |
| Total | 0 (0.0%) | 0 (0.0%) |
Race in Homewood Canyon
The most populous races in Homewood Canyon are White / Caucasian (224 | 100.0%), and Hispanic or Latino (137 | 61.2%).
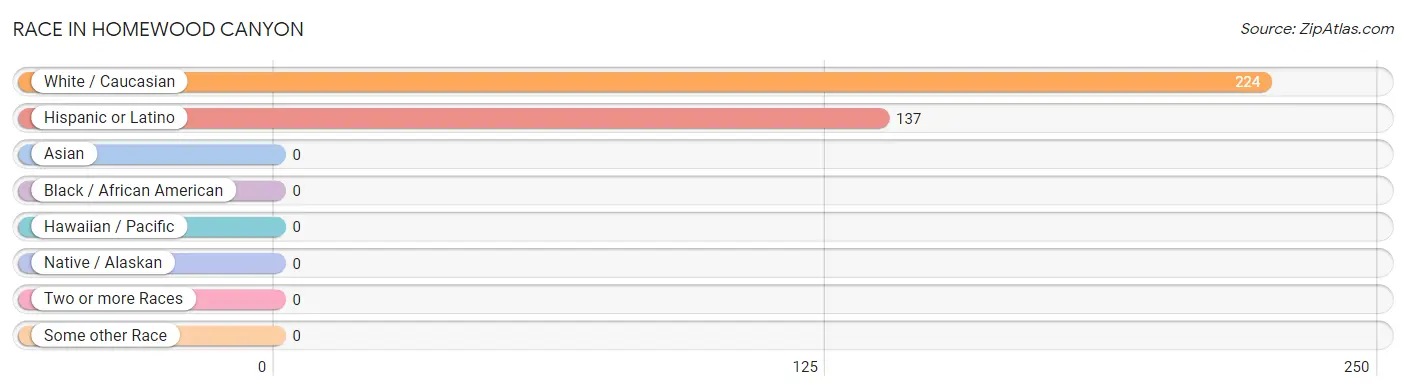
| Race | # Population | % Population |
| Asian | 0 | 0.0% |
| Black / African American | 0 | 0.0% |
| Hawaiian / Pacific | 0 | 0.0% |
| Hispanic or Latino | 137 | 61.2% |
| Native / Alaskan | 0 | 0.0% |
| White / Caucasian | 224 | 100.0% |
| Two or more Races | 0 | 0.0% |
| Some other Race | 0 | 0.0% |
| Total | 224 | 100.0% |
Ancestry in Homewood Canyon
The most populous ancestries reported in Homewood Canyon are Mexican (137 | 61.2%), French Canadian (21 | 9.4%), German (20 | 8.9%), Greek (16 | 7.1%), and Polish (12 | 5.4%), together accounting for 92.0% of all Homewood Canyon residents.
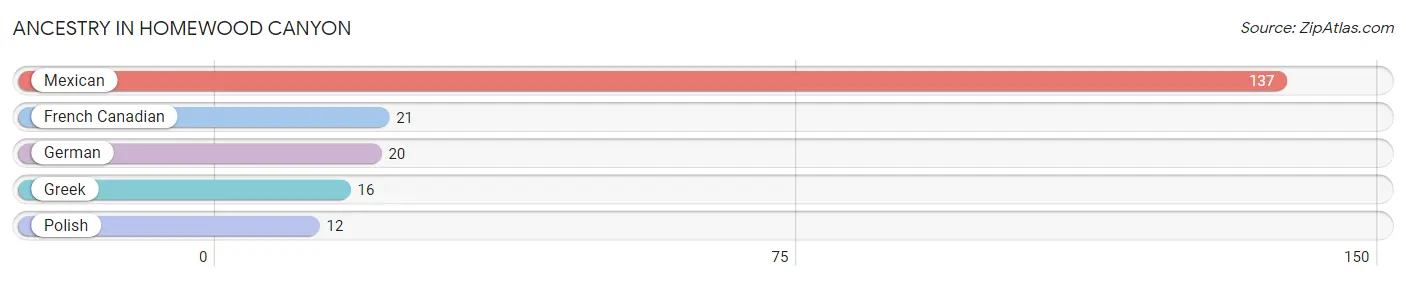
| Ancestry | # Population | % Population |
| French Canadian | 21 | 9.4% |
| German | 20 | 8.9% |
| Greek | 16 | 7.1% |
| Mexican | 137 | 61.2% |
| Polish | 12 | 5.4% | View All 5 Rows |
Immigrants in Homewood Canyon

| Immigration Origin | # Population | % Population | View All 0 Rows |
Sex and Age in Homewood Canyon
Sex and Age in Homewood Canyon
The most populous age groups in Homewood Canyon are 50 to 54 Years (38 | 37.2%) for men and 25 to 29 Years (83 | 68.0%) for women.
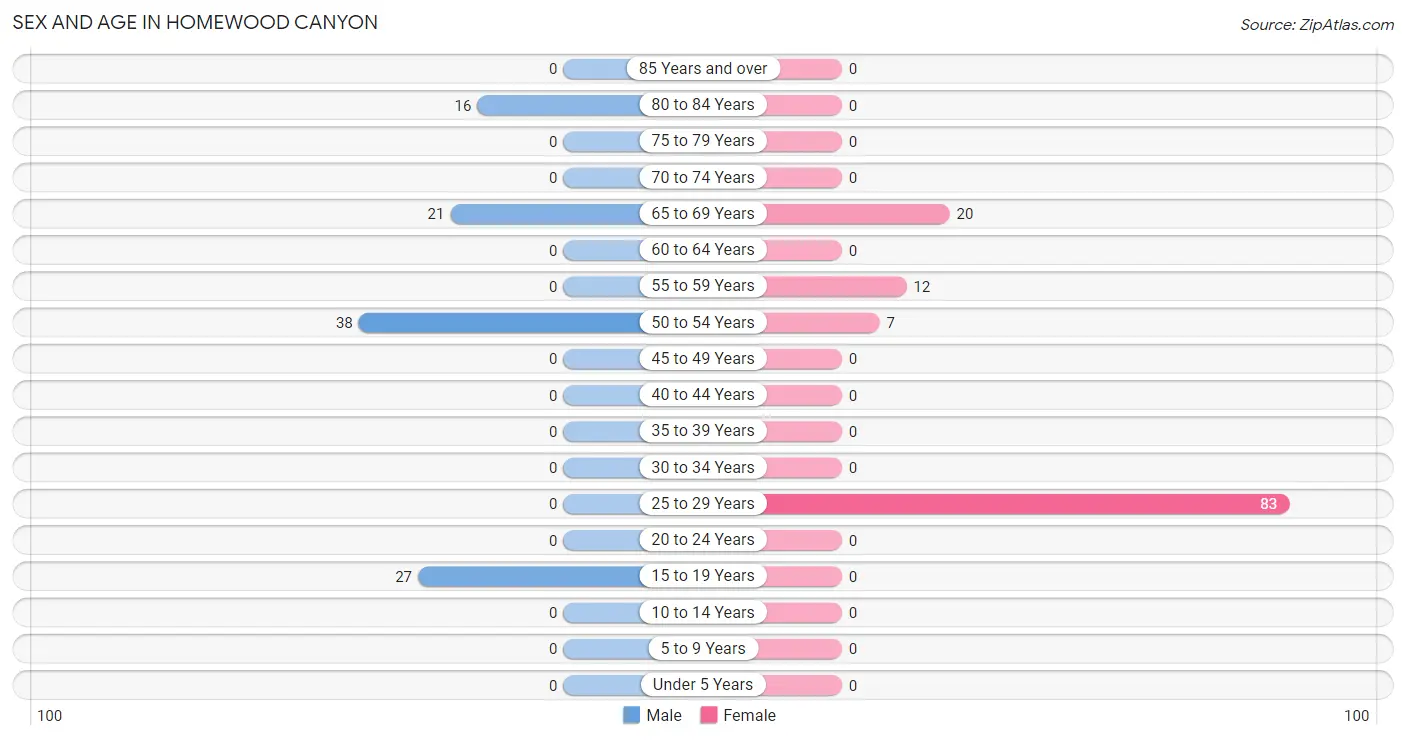
| Age Bracket | Male | Female |
| Under 5 Years | 0 (0.0%) | 0 (0.0%) |
| 5 to 9 Years | 0 (0.0%) | 0 (0.0%) |
| 10 to 14 Years | 0 (0.0%) | 0 (0.0%) |
| 15 to 19 Years | 27 (26.5%) | 0 (0.0%) |
| 20 to 24 Years | 0 (0.0%) | 0 (0.0%) |
| 25 to 29 Years | 0 (0.0%) | 83 (68.0%) |
| 30 to 34 Years | 0 (0.0%) | 0 (0.0%) |
| 35 to 39 Years | 0 (0.0%) | 0 (0.0%) |
| 40 to 44 Years | 0 (0.0%) | 0 (0.0%) |
| 45 to 49 Years | 0 (0.0%) | 0 (0.0%) |
| 50 to 54 Years | 38 (37.2%) | 7 (5.7%) |
| 55 to 59 Years | 0 (0.0%) | 12 (9.8%) |
| 60 to 64 Years | 0 (0.0%) | 0 (0.0%) |
| 65 to 69 Years | 21 (20.6%) | 20 (16.4%) |
| 70 to 74 Years | 0 (0.0%) | 0 (0.0%) |
| 75 to 79 Years | 0 (0.0%) | 0 (0.0%) |
| 80 to 84 Years | 16 (15.7%) | 0 (0.0%) |
| 85 Years and over | 0 (0.0%) | 0 (0.0%) |
| Total | 102 (100.0%) | 122 (100.0%) |
Families and Households in Homewood Canyon
Median Family Size in Homewood Canyon
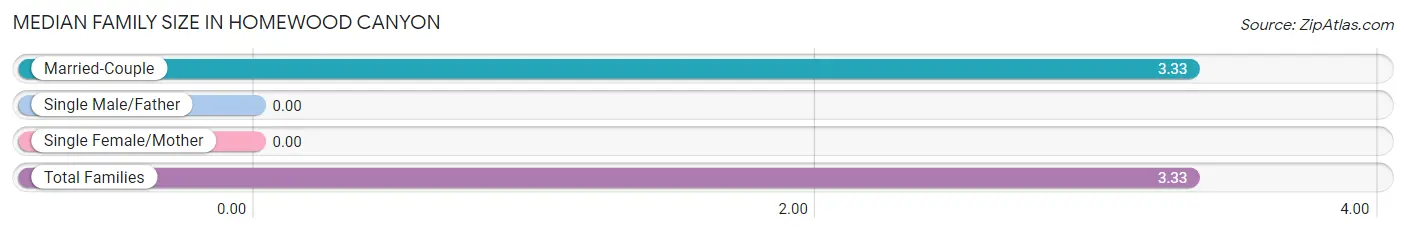
| Family Type | # Families | Family Size |
| Married-Couple | 64 (100.0%) | 3.33 |
| Single Male/Father | 0 (0.0%) | - |
| Single Female/Mother | 0 (0.0%) | - |
| Total Families | 64 (100.0%) | 3.33 |
Median Household Size in Homewood Canyon
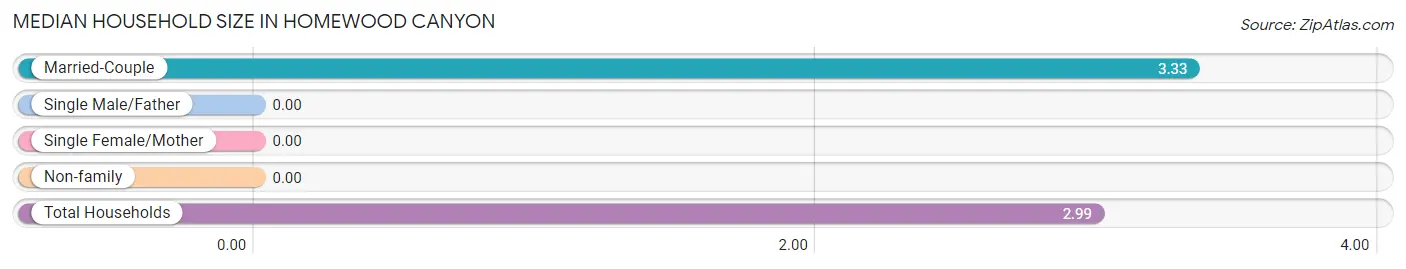
| Household Type | # Households | Household Size |
| Married-Couple | 64 (85.3%) | 3.33 |
| Single Male/Father | 0 (0.0%) | - |
| Single Female/Mother | 0 (0.0%) | - |
| Non-family | 11 (14.7%) | - |
| Total Households | 75 (100.0%) | 2.99 |
Household Size by Marriage Status in Homewood Canyon
Out of a total of 75 households in Homewood Canyon, 64 (85.3%) are family households, while 11 (14.7%) are nonfamily households. The most numerous type of family households are 2-person households, comprising 37, and the most common type of nonfamily households are 1-person households, comprising 11.
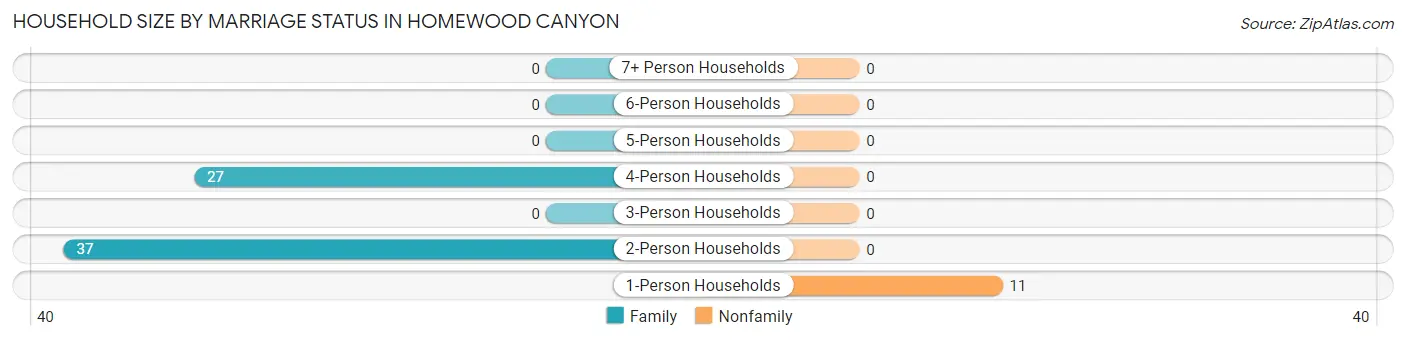
| Household Size | Family Households | Nonfamily Households |
| 1-Person Households | - | 11 (14.7%) |
| 2-Person Households | 37 (49.3%) | 0 (0.0%) |
| 3-Person Households | 0 (0.0%) | 0 (0.0%) |
| 4-Person Households | 27 (36.0%) | 0 (0.0%) |
| 5-Person Households | 0 (0.0%) | 0 (0.0%) |
| 6-Person Households | 0 (0.0%) | 0 (0.0%) |
| 7+ Person Households | 0 (0.0%) | 0 (0.0%) |
| Total | 64 (85.3%) | 11 (14.7%) |
Female Fertility in Homewood Canyon
Fertility by Age in Homewood Canyon
| Age Bracket | Women with Births | Births / 1,000 Women |
| 15 to 19 years | 0 (0.0%) | 0.0 |
| 20 to 34 years | 0 (0.0%) | 0.0 |
| 35 to 50 years | 0 (0.0%) | 0.0 |
| Total | 0 (0.0%) | 0.0 |
Fertility by Age by Marriage Status in Homewood Canyon
| Age Bracket | Married | Unmarried |
| 15 to 19 years | 0 (0.0%) | 0 (0.0%) |
| 20 to 34 years | 0 (0.0%) | 0 (0.0%) |
| 35 to 50 years | 0 (0.0%) | 0 (0.0%) |
| Total | 0 (0.0%) | 0 (0.0%) |
Fertility by Education in Homewood Canyon
| Educational Attainment | Women with Births | Births / 1,000 Women |
| Less than High School | 0 (0.0%) | 0.0 |
| High School Diploma | 0 (0.0%) | 0.0 |
| College or Associate's Degree | 0 (0.0%) | 0.0 |
| Bachelor's Degree | 0 (0.0%) | 0.0 |
| Graduate Degree | 0 (0.0%) | 0.0 |
| Total | 0 (0.0%) | 0.0 |
Fertility by Education by Marriage Status in Homewood Canyon
| Educational Attainment | Married | Unmarried |
| Less than High School | 0 (0.0%) | 0 (0.0%) |
| High School Diploma | 0 (0.0%) | 0 (0.0%) |
| College or Associate's Degree | 0 (0.0%) | 0 (0.0%) |
| Bachelor's Degree | 0 (0.0%) | 0 (0.0%) |
| Graduate Degree | 0 (0.0%) | 0 (0.0%) |
| Total | 0 (0.0%) | 0 (0.0%) |
Employment Characteristics in Homewood Canyon
Employment by Class of Employer in Homewood Canyon
Among the 155 employed individuals in Homewood Canyon, federal government employees (110 | 71.0%), local government employees (34 | 21.9%), and private company employees (11 | 7.1%) make up the most common classes of employment.
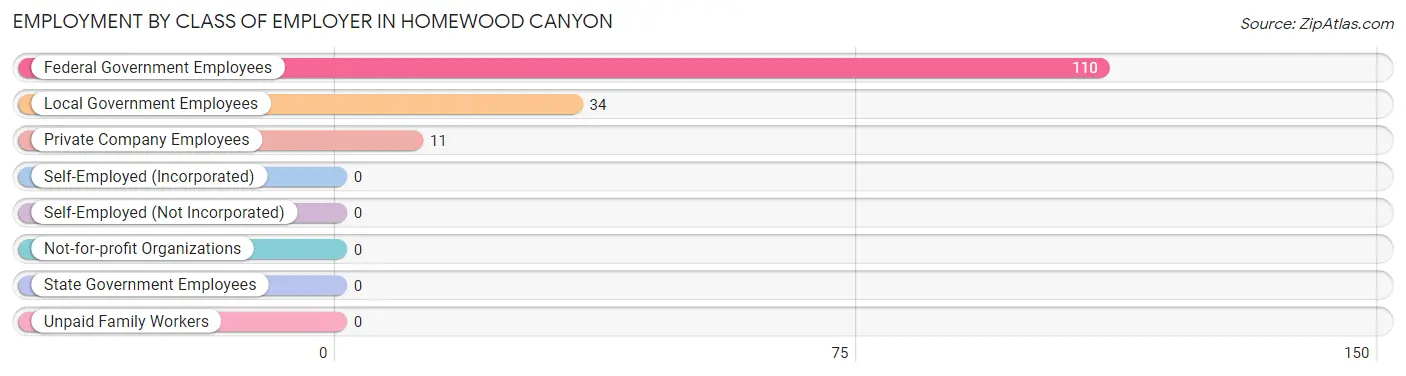
| Employer Class | # Employees | % Employees |
| Private Company Employees | 11 | 7.1% |
| Self-Employed (Incorporated) | 0 | 0.0% |
| Self-Employed (Not Incorporated) | 0 | 0.0% |
| Not-for-profit Organizations | 0 | 0.0% |
| Local Government Employees | 34 | 21.9% |
| State Government Employees | 0 | 0.0% |
| Federal Government Employees | 110 | 71.0% |
| Unpaid Family Workers | 0 | 0.0% |
| Total | 155 | 100.0% |
Employment Status by Age in Homewood Canyon
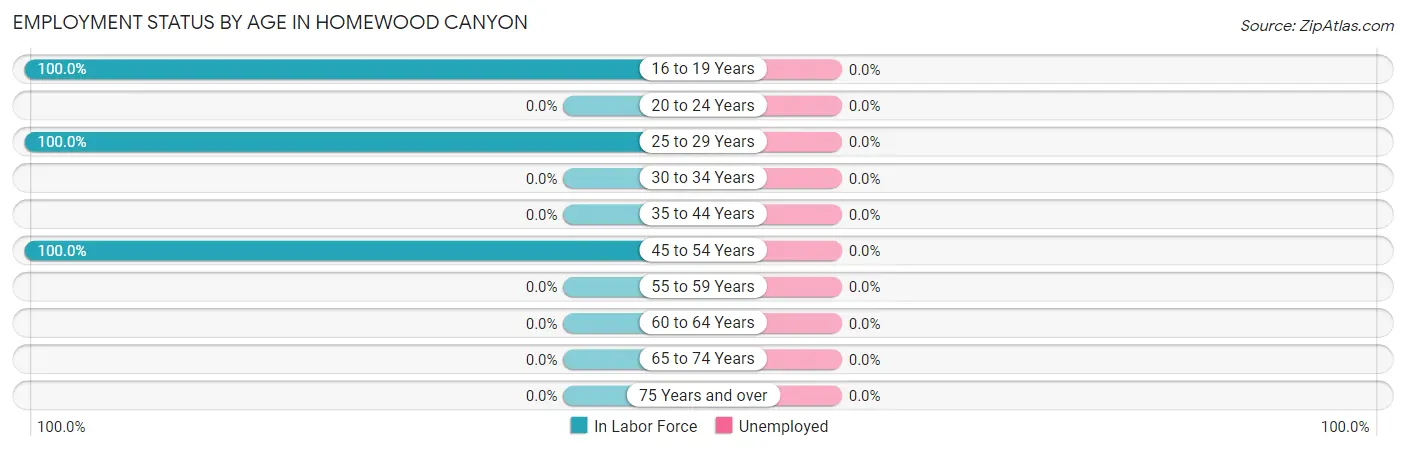
| Age Bracket | In Labor Force | Unemployed |
| 16 to 19 Years | 27 (100.0%) | 0 (0.0%) |
| 20 to 24 Years | 0 (0.0%) | 0 (0.0%) |
| 25 to 29 Years | 83 (100.0%) | 0 (0.0%) |
| 30 to 34 Years | 0 (0.0%) | 0 (0.0%) |
| 35 to 44 Years | 0 (0.0%) | 0 (0.0%) |
| 45 to 54 Years | 45 (100.0%) | 0 (0.0%) |
| 55 to 59 Years | 0 (0.0%) | 0 (0.0%) |
| 60 to 64 Years | 0 (0.0%) | 0 (0.0%) |
| 65 to 74 Years | 0 (0.0%) | 0 (0.0%) |
| 75 Years and over | 0 (0.0%) | 0 (0.0%) |
| Total | 155 (69.2%) | 0 (0.0%) |
Employment Status by Educational Attainment in Homewood Canyon
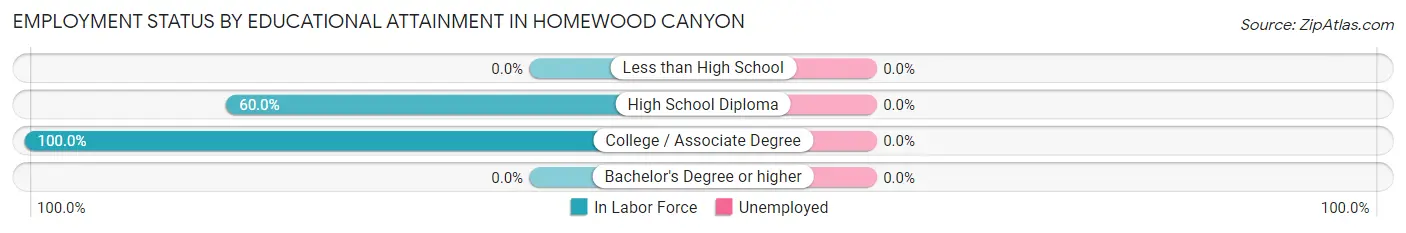
| Educational Attainment | In Labor Force | Unemployed |
| Less than High School | 0 (0.0%) | 0 (0.0%) |
| High School Diploma | 18 (60.0%) | 0 (0.0%) |
| College / Associate Degree | 110 (100.0%) | 0 (0.0%) |
| Bachelor's Degree or higher | 0 (0.0%) | 0 (0.0%) |
| Total | 128 (91.4%) | 0 (0.0%) |
Employment Occupations by Sex in Homewood Canyon
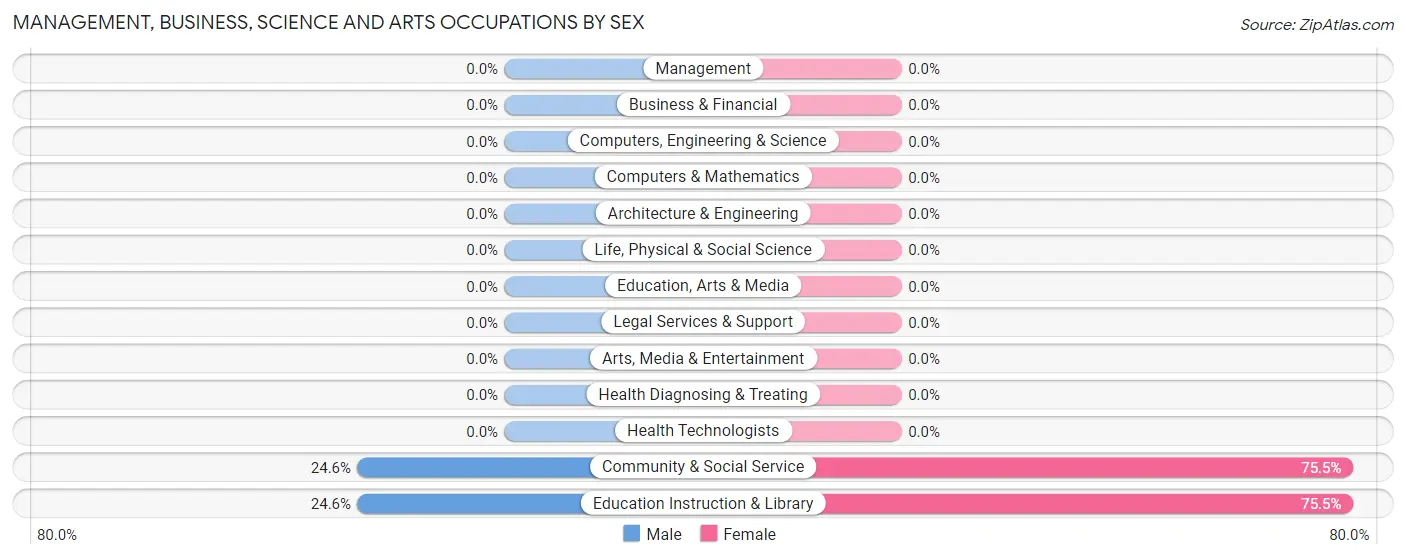
Management, Business, Science and Arts Occupations
The most common Management, Business, Science and Arts occupations in Homewood Canyon are Community & Social Service (110 | 71.0%), and Education Instruction & Library (110 | 71.0%).
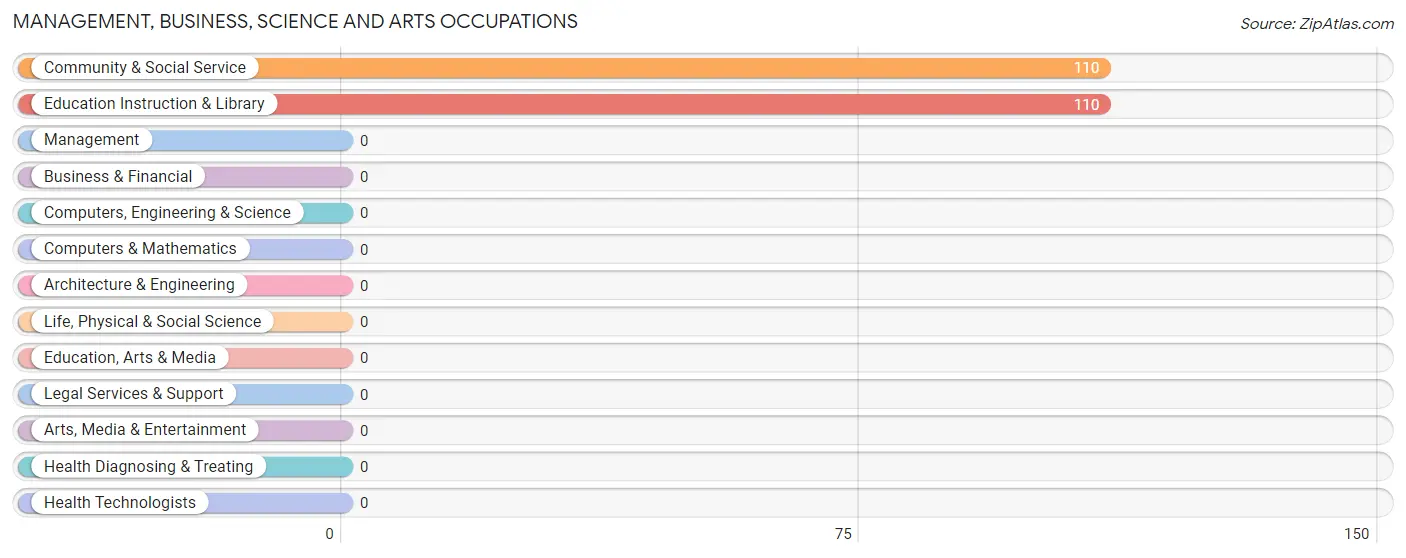
Management, Business, Science and Arts Occupations by Sex
Within the Management, Business, Science and Arts occupations in Homewood Canyon, the most male-oriented occupations are Community & Social Service (24.5%), and Education Instruction & Library (24.5%), while the most female-oriented occupations are Community & Social Service (75.4%), and Education Instruction & Library (75.4%).
| Occupation | Male | Female |
| Management | 0 (0.0%) | 0 (0.0%) |
| Business & Financial | 0 (0.0%) | 0 (0.0%) |
| Computers, Engineering & Science | 0 (0.0%) | 0 (0.0%) |
| Computers & Mathematics | 0 (0.0%) | 0 (0.0%) |
| Architecture & Engineering | 0 (0.0%) | 0 (0.0%) |
| Life, Physical & Social Science | 0 (0.0%) | 0 (0.0%) |
| Community & Social Service | 27 (24.5%) | 83 (75.4%) |
| Education, Arts & Media | 0 (0.0%) | 0 (0.0%) |
| Legal Services & Support | 0 (0.0%) | 0 (0.0%) |
| Education Instruction & Library | 27 (24.5%) | 83 (75.4%) |
| Arts, Media & Entertainment | 0 (0.0%) | 0 (0.0%) |
| Health Diagnosing & Treating | 0 (0.0%) | 0 (0.0%) |
| Health Technologists | 0 (0.0%) | 0 (0.0%) |
| Total (Category) | 27 (24.5%) | 83 (75.4%) |
| Total (Overall) | 65 (41.9%) | 90 (58.1%) |
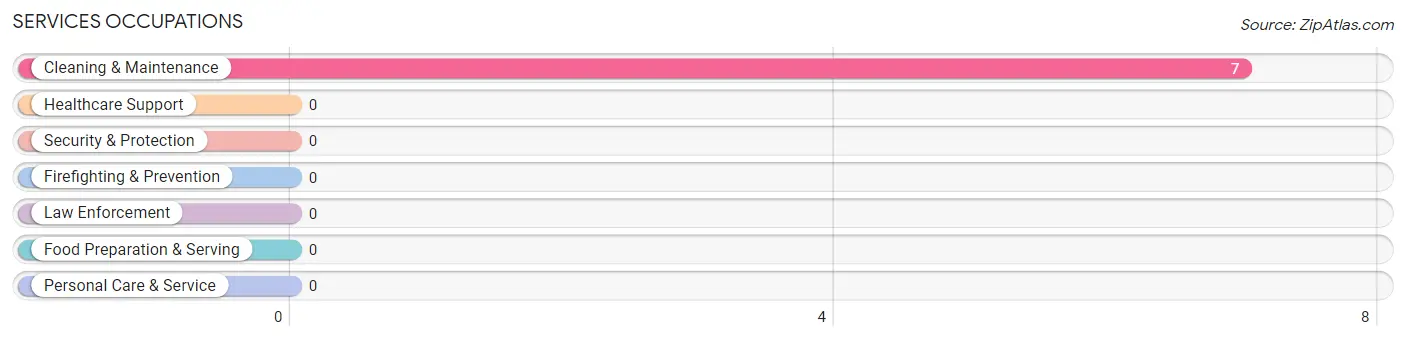
Services Occupations
The most common Services occupations in Homewood Canyon are , and Cleaning & Maintenance (7 | 4.5%).
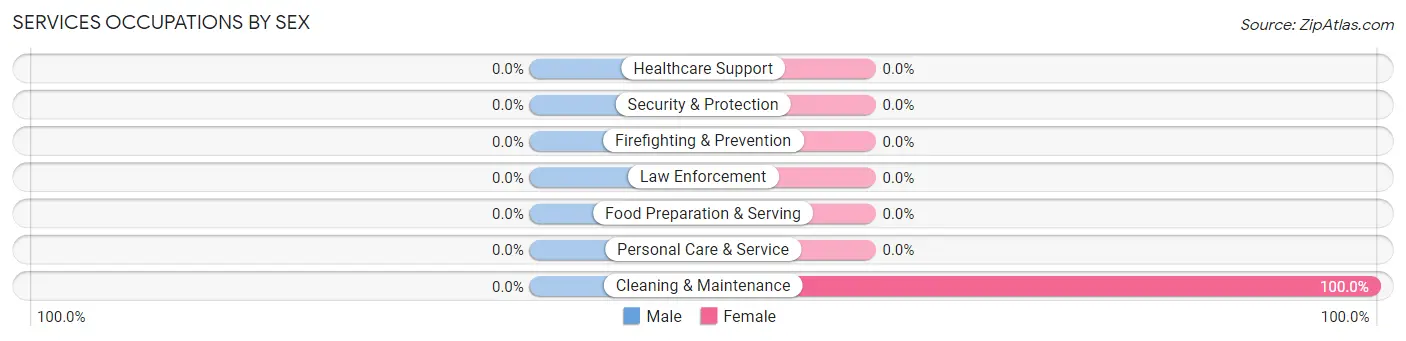
Services Occupations by Sex
| Occupation | Male | Female |
| Healthcare Support | 0 (0.0%) | 0 (0.0%) |
| Security & Protection | 0 (0.0%) | 0 (0.0%) |
| Firefighting & Prevention | 0 (0.0%) | 0 (0.0%) |
| Law Enforcement | 0 (0.0%) | 0 (0.0%) |
| Food Preparation & Serving | 0 (0.0%) | 0 (0.0%) |
| Cleaning & Maintenance | 0 (0.0%) | 7 (100.0%) |
| Personal Care & Service | 0 (0.0%) | 0 (0.0%) |
| Total (Category) | 0 (0.0%) | 7 (100.0%) |
| Total (Overall) | 65 (41.9%) | 90 (58.1%) |
Sales and Office Occupations
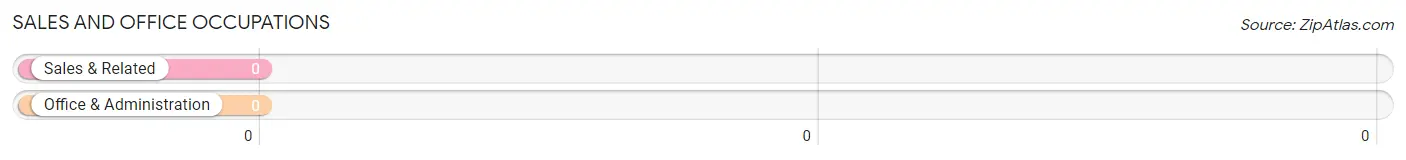
Sales and Office Occupations by Sex
| Occupation | Male | Female |
| Sales & Related | 0 (0.0%) | 0 (0.0%) |
| Office & Administration | 0 (0.0%) | 0 (0.0%) |
| Total (Category) | 0 (0.0%) | 0 (0.0%) |
| Total (Overall) | 65 (41.9%) | 90 (58.1%) |
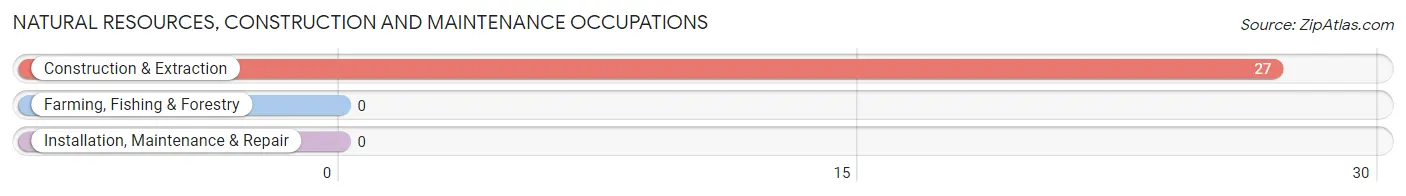
Natural Resources, Construction and Maintenance Occupations
The most common Natural Resources, Construction and Maintenance occupations in Homewood Canyon are , and Construction & Extraction (27 | 17.4%).
Natural Resources, Construction and Maintenance Occupations by Sex
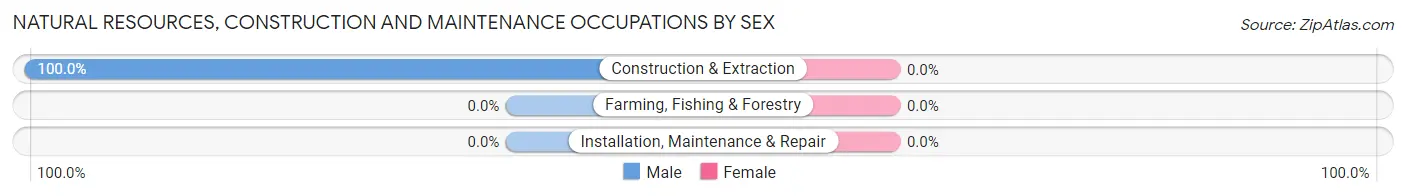
| Occupation | Male | Female |
| Farming, Fishing & Forestry | 0 (0.0%) | 0 (0.0%) |
| Construction & Extraction | 27 (100.0%) | 0 (0.0%) |
| Installation, Maintenance & Repair | 0 (0.0%) | 0 (0.0%) |
| Total (Category) | 27 (100.0%) | 0 (0.0%) |
| Total (Overall) | 65 (41.9%) | 90 (58.1%) |
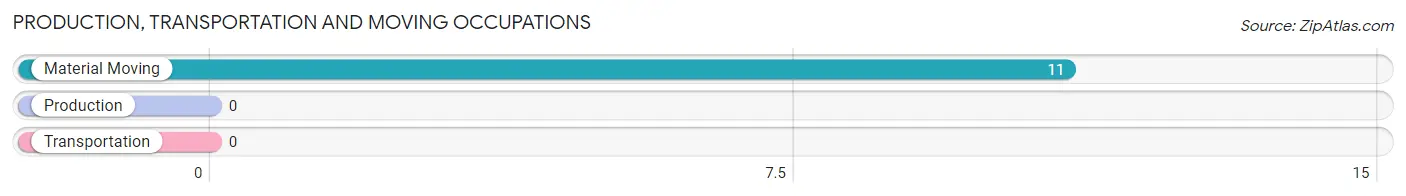
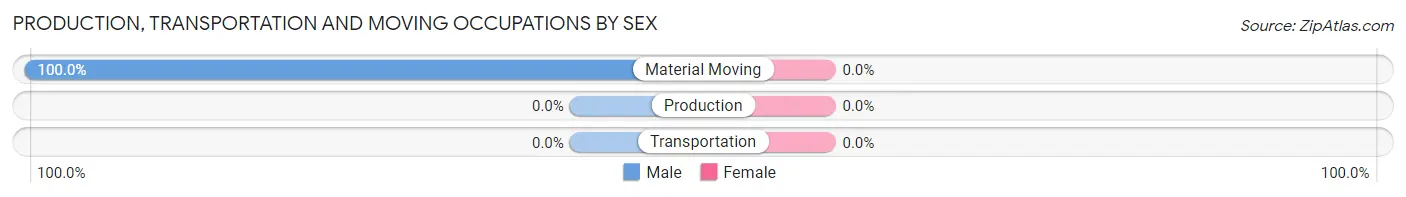
Production, Transportation and Moving Occupations
The most common Production, Transportation and Moving occupations in Homewood Canyon are , and Material Moving (11 | 7.1%).
Production, Transportation and Moving Occupations by Sex
| Occupation | Male | Female |
| Production | 0 (0.0%) | 0 (0.0%) |
| Transportation | 0 (0.0%) | 0 (0.0%) |
| Material Moving | 11 (100.0%) | 0 (0.0%) |
| Total (Category) | 11 (100.0%) | 0 (0.0%) |
| Total (Overall) | 65 (41.9%) | 90 (58.1%) |
Employment Industries by Sex in Homewood Canyon
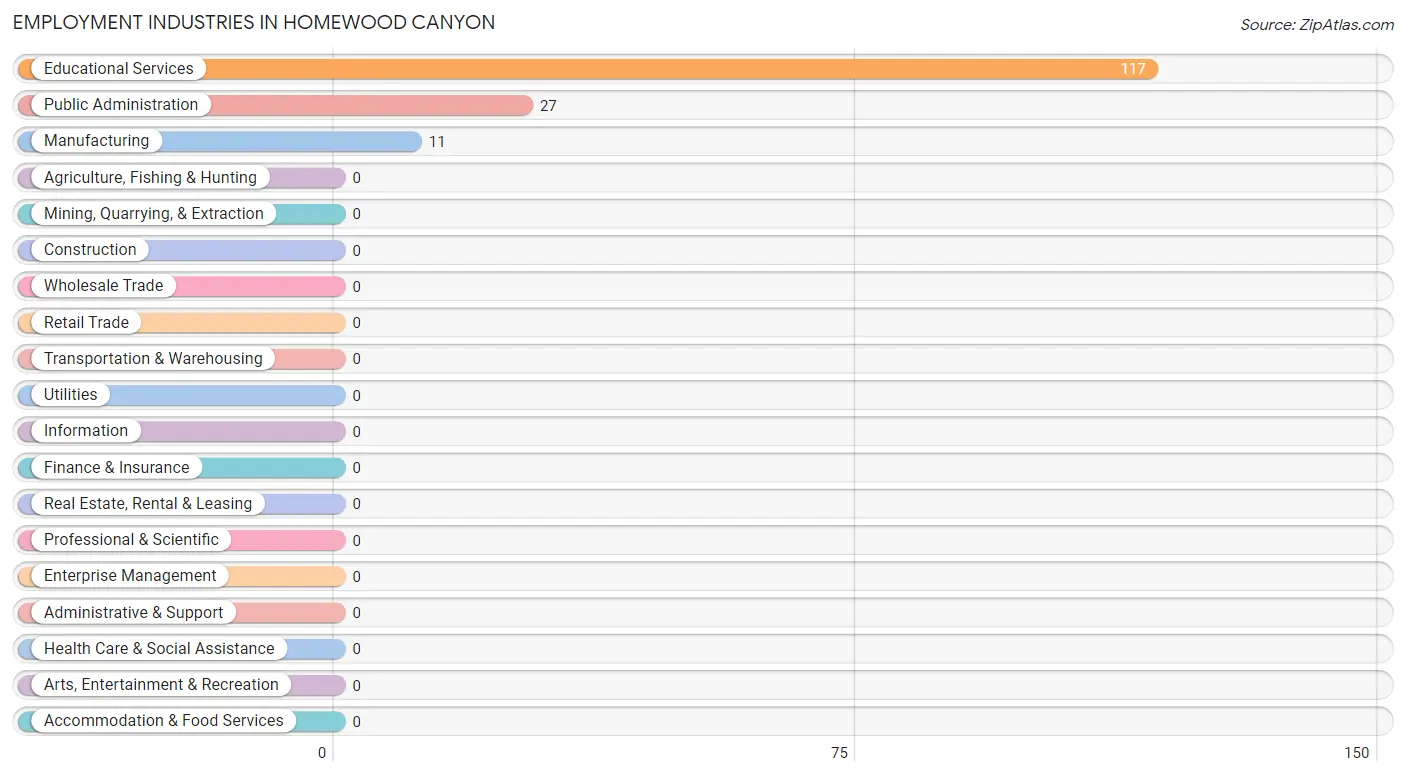
Employment Industries in Homewood Canyon
The major employment industries in Homewood Canyon include Educational Services (117 | 75.5%), Public Administration (27 | 17.4%), and Manufacturing (11 | 7.1%).
Employment Industries by Sex in Homewood Canyon
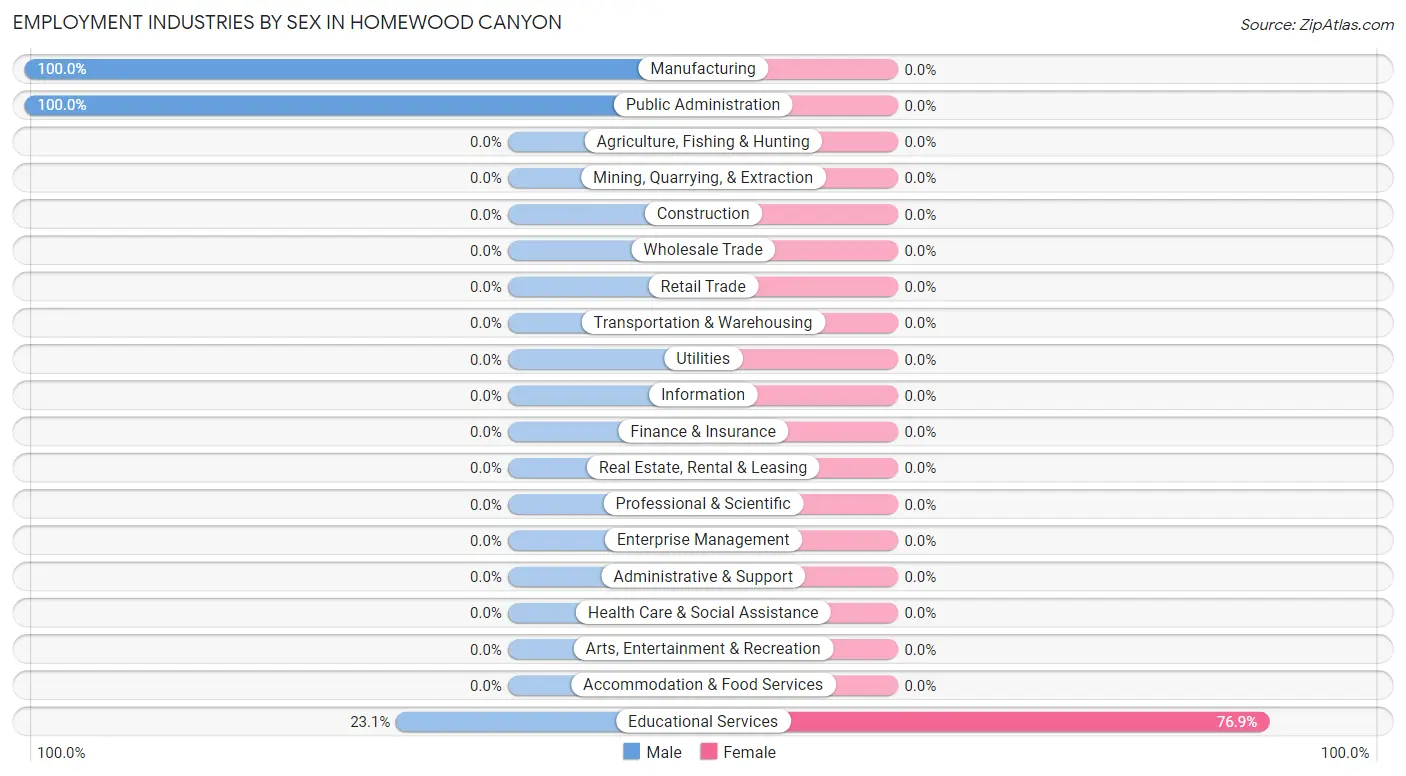
| Industry | Male | Female |
| Agriculture, Fishing & Hunting | 0 (0.0%) | 0 (0.0%) |
| Mining, Quarrying, & Extraction | 0 (0.0%) | 0 (0.0%) |
| Construction | 0 (0.0%) | 0 (0.0%) |
| Manufacturing | 11 (100.0%) | 0 (0.0%) |
| Wholesale Trade | 0 (0.0%) | 0 (0.0%) |
| Retail Trade | 0 (0.0%) | 0 (0.0%) |
| Transportation & Warehousing | 0 (0.0%) | 0 (0.0%) |
| Utilities | 0 (0.0%) | 0 (0.0%) |
| Information | 0 (0.0%) | 0 (0.0%) |
| Finance & Insurance | 0 (0.0%) | 0 (0.0%) |
| Real Estate, Rental & Leasing | 0 (0.0%) | 0 (0.0%) |
| Professional & Scientific | 0 (0.0%) | 0 (0.0%) |
| Enterprise Management | 0 (0.0%) | 0 (0.0%) |
| Administrative & Support | 0 (0.0%) | 0 (0.0%) |
| Educational Services | 27 (23.1%) | 90 (76.9%) |
| Health Care & Social Assistance | 0 (0.0%) | 0 (0.0%) |
| Arts, Entertainment & Recreation | 0 (0.0%) | 0 (0.0%) |
| Accommodation & Food Services | 0 (0.0%) | 0 (0.0%) |
| Public Administration | 27 (100.0%) | 0 (0.0%) |
| Total | 65 (41.9%) | 90 (58.1%) |
Education in Homewood Canyon
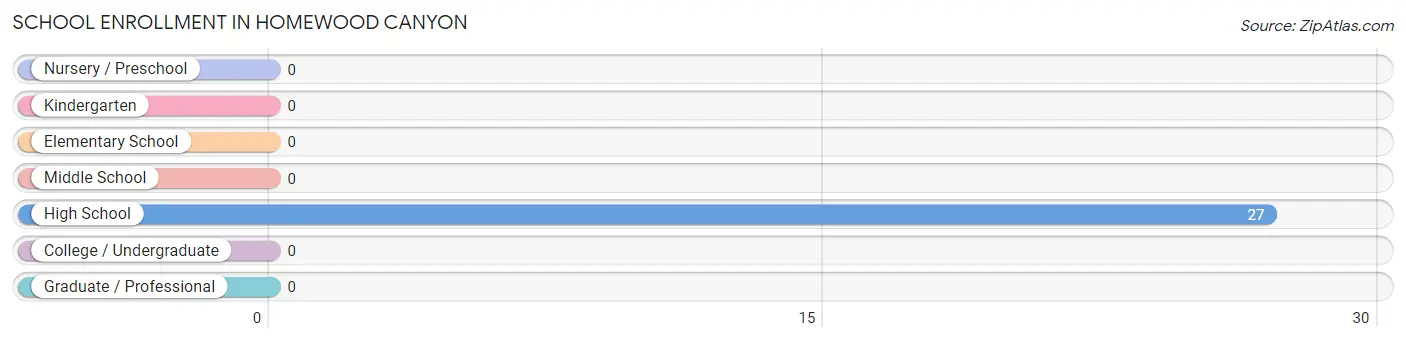
School Enrollment in Homewood Canyon
| School Level | # Students | % Students |
| Nursery / Preschool | 0 | 0.0% |
| Kindergarten | 0 | 0.0% |
| Elementary School | 0 | 0.0% |
| Middle School | 0 | 0.0% |
| High School | 27 | 100.0% |
| College / Undergraduate | 0 | 0.0% |
| Graduate / Professional | 0 | 0.0% |
| Total | 27 | 100.0% |
School Enrollment by Age by Funding Source in Homewood Canyon
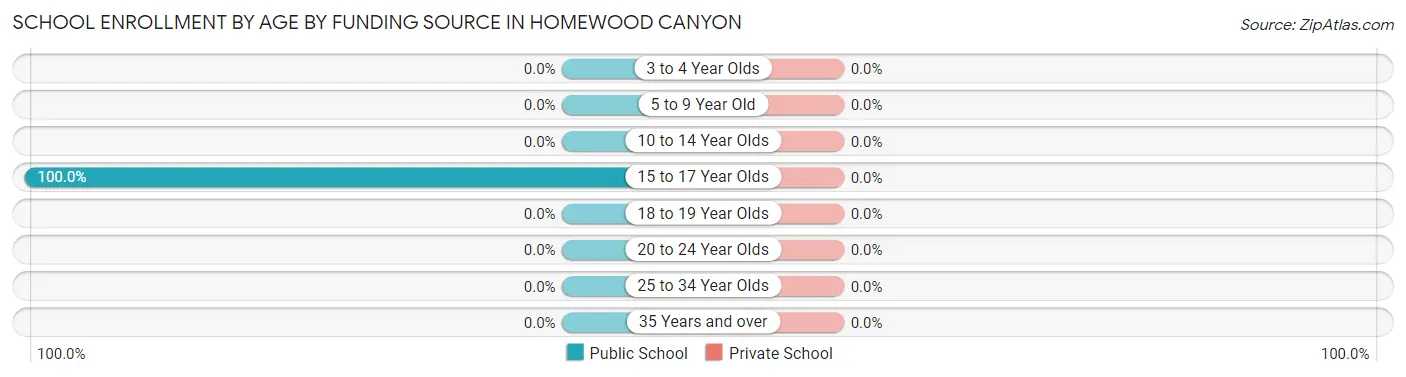
| Age Bracket | Public School | Private School |
| 3 to 4 Year Olds | 0 (0.0%) | 0 (0.0%) |
| 5 to 9 Year Old | 0 (0.0%) | 0 (0.0%) |
| 10 to 14 Year Olds | 0 (0.0%) | 0 (0.0%) |
| 15 to 17 Year Olds | 27 (100.0%) | 0 (0.0%) |
| 18 to 19 Year Olds | 0 (0.0%) | 0 (0.0%) |
| 20 to 24 Year Olds | 0 (0.0%) | 0 (0.0%) |
| 25 to 34 Year Olds | 0 (0.0%) | 0 (0.0%) |
| 35 Years and over | 0 (0.0%) | 0 (0.0%) |
| Total | 27 (100.0%) | 0 (0.0%) |
Educational Attainment by Field of Study in Homewood Canyon
, and engineering (21 | 100.0%) are the most common fields of study among 21 individuals in Homewood Canyon who have obtained a bachelor's degree or higher.
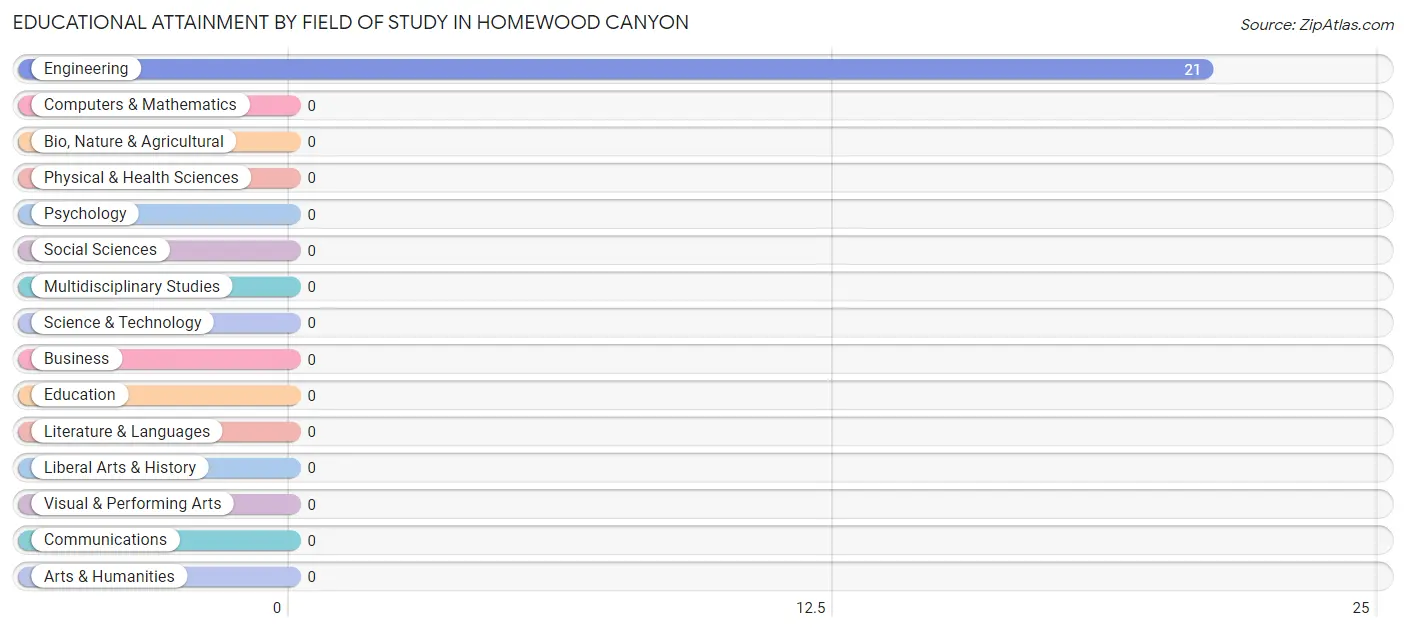
| Field of Study | # Graduates | % Graduates |
| Computers & Mathematics | 0 | 0.0% |
| Bio, Nature & Agricultural | 0 | 0.0% |
| Physical & Health Sciences | 0 | 0.0% |
| Psychology | 0 | 0.0% |
| Social Sciences | 0 | 0.0% |
| Engineering | 21 | 100.0% |
| Multidisciplinary Studies | 0 | 0.0% |
| Science & Technology | 0 | 0.0% |
| Business | 0 | 0.0% |
| Education | 0 | 0.0% |
| Literature & Languages | 0 | 0.0% |
| Liberal Arts & History | 0 | 0.0% |
| Visual & Performing Arts | 0 | 0.0% |
| Communications | 0 | 0.0% |
| Arts & Humanities | 0 | 0.0% |
| Total | 21 | 100.0% |
Transportation & Commute in Homewood Canyon
Vehicle Availability by Sex in Homewood Canyon
The most prevalent vehicle ownership categories in Homewood Canyon are males with 5 or more vehicles (54, accounting for 83.1%) and females with 5 or more vehicles (90, making up 60.0%).
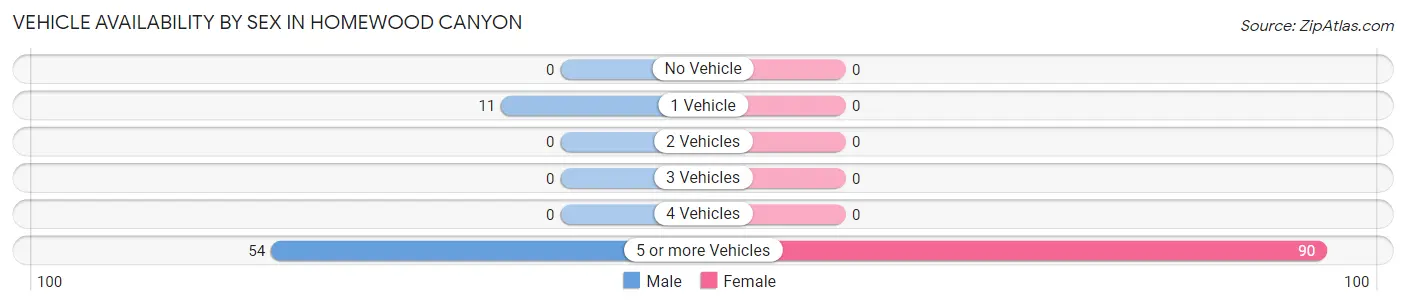
| Vehicles Available | Male | Female |
| No Vehicle | 0 (0.0%) | 0 (0.0%) |
| 1 Vehicle | 11 (16.9%) | 0 (0.0%) |
| 2 Vehicles | 0 (0.0%) | 0 (0.0%) |
| 3 Vehicles | 0 (0.0%) | 0 (0.0%) |
| 4 Vehicles | 0 (0.0%) | 0 (0.0%) |
| 5 or more Vehicles | 54 (83.1%) | 90 (100.0%) |
| Total | 65 (100.0%) | 90 (100.0%) |
Commute Time in Homewood Canyon
The most frequently occuring commute durations in Homewood Canyon are 40 to 44 minutes (110 commuters, 71.0%), 15 to 19 minutes (34 commuters, 21.9%), and less than 5 minutes (11 commuters, 7.1%).
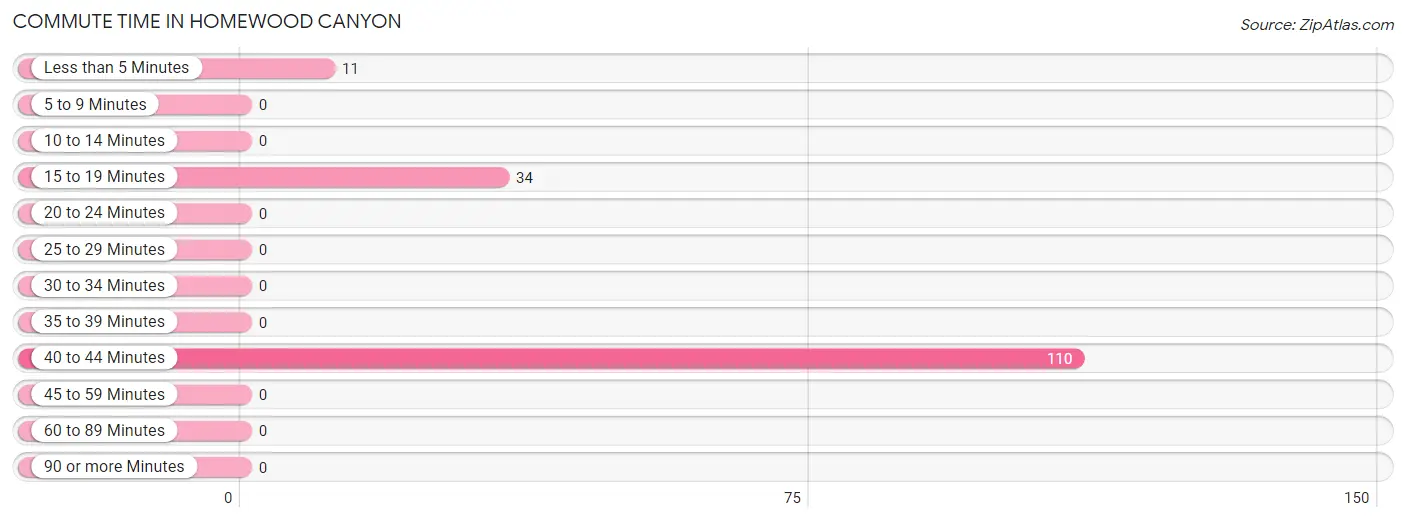
| Commute Time | # Commuters | % Commuters |
| Less than 5 Minutes | 11 | 7.1% |
| 5 to 9 Minutes | 0 | 0.0% |
| 10 to 14 Minutes | 0 | 0.0% |
| 15 to 19 Minutes | 34 | 21.9% |
| 20 to 24 Minutes | 0 | 0.0% |
| 25 to 29 Minutes | 0 | 0.0% |
| 30 to 34 Minutes | 0 | 0.0% |
| 35 to 39 Minutes | 0 | 0.0% |
| 40 to 44 Minutes | 110 | 71.0% |
| 45 to 59 Minutes | 0 | 0.0% |
| 60 to 89 Minutes | 0 | 0.0% |
| 90 or more Minutes | 0 | 0.0% |
Commute Time by Sex in Homewood Canyon
The most common commute times in Homewood Canyon are 15 to 19 minutes (27 commuters, 41.5%) for males and 40 to 44 minutes (83 commuters, 92.2%) for females.
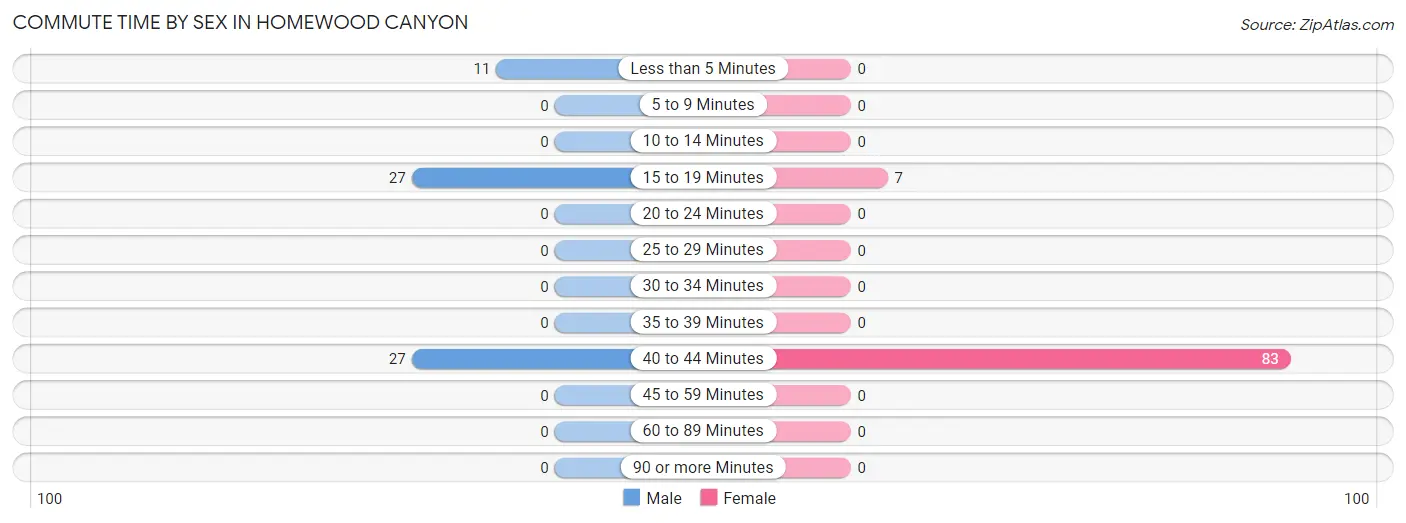
| Commute Time | Male | Female |
| Less than 5 Minutes | 11 (16.9%) | 0 (0.0%) |
| 5 to 9 Minutes | 0 (0.0%) | 0 (0.0%) |
| 10 to 14 Minutes | 0 (0.0%) | 0 (0.0%) |
| 15 to 19 Minutes | 27 (41.5%) | 7 (7.8%) |
| 20 to 24 Minutes | 0 (0.0%) | 0 (0.0%) |
| 25 to 29 Minutes | 0 (0.0%) | 0 (0.0%) |
| 30 to 34 Minutes | 0 (0.0%) | 0 (0.0%) |
| 35 to 39 Minutes | 0 (0.0%) | 0 (0.0%) |
| 40 to 44 Minutes | 27 (41.5%) | 83 (92.2%) |
| 45 to 59 Minutes | 0 (0.0%) | 0 (0.0%) |
| 60 to 89 Minutes | 0 (0.0%) | 0 (0.0%) |
| 90 or more Minutes | 0 (0.0%) | 0 (0.0%) |
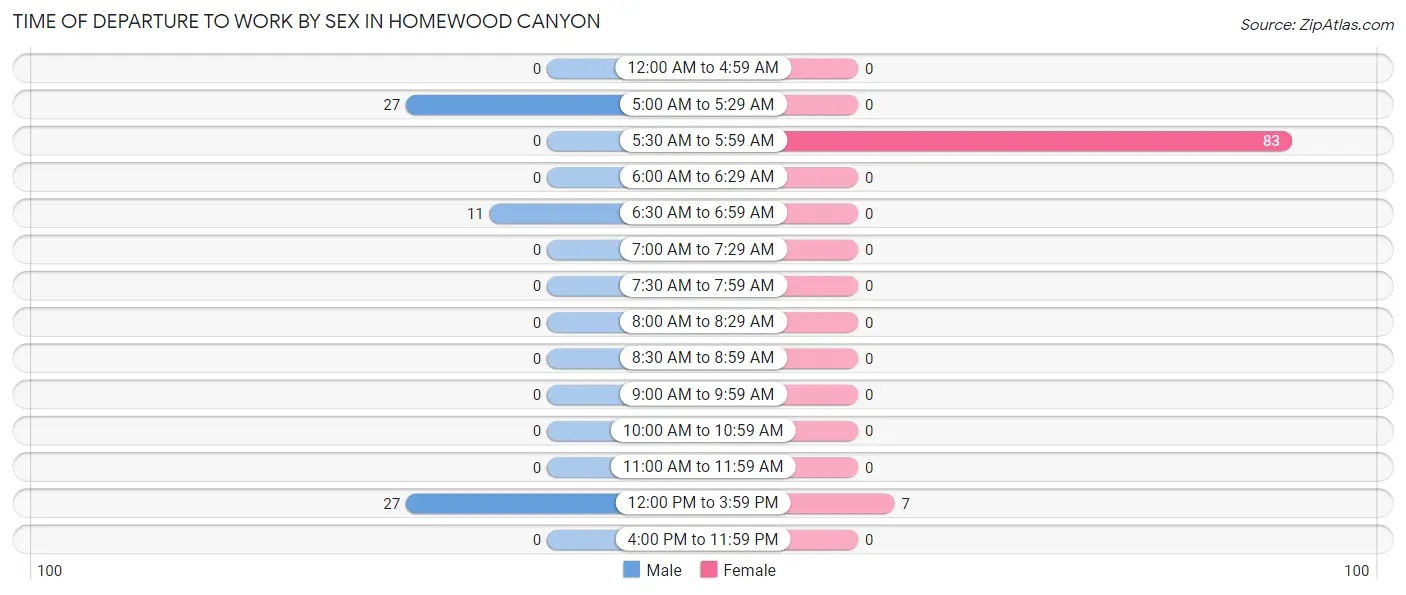
Time of Departure to Work by Sex in Homewood Canyon
The most frequent times of departure to work in Homewood Canyon are 5:00 AM to 5:29 AM (27, 41.5%) for males and 5:30 AM to 5:59 AM (83, 92.2%) for females.
| Time of Departure | Male | Female |
| 12:00 AM to 4:59 AM | 0 (0.0%) | 0 (0.0%) |
| 5:00 AM to 5:29 AM | 27 (41.5%) | 0 (0.0%) |
| 5:30 AM to 5:59 AM | 0 (0.0%) | 83 (92.2%) |
| 6:00 AM to 6:29 AM | 0 (0.0%) | 0 (0.0%) |
| 6:30 AM to 6:59 AM | 11 (16.9%) | 0 (0.0%) |
| 7:00 AM to 7:29 AM | 0 (0.0%) | 0 (0.0%) |
| 7:30 AM to 7:59 AM | 0 (0.0%) | 0 (0.0%) |
| 8:00 AM to 8:29 AM | 0 (0.0%) | 0 (0.0%) |
| 8:30 AM to 8:59 AM | 0 (0.0%) | 0 (0.0%) |
| 9:00 AM to 9:59 AM | 0 (0.0%) | 0 (0.0%) |
| 10:00 AM to 10:59 AM | 0 (0.0%) | 0 (0.0%) |
| 11:00 AM to 11:59 AM | 0 (0.0%) | 0 (0.0%) |
| 12:00 PM to 3:59 PM | 27 (41.5%) | 7 (7.8%) |
| 4:00 PM to 11:59 PM | 0 (0.0%) | 0 (0.0%) |
| Total | 65 (100.0%) | 90 (100.0%) |
Housing Occupancy in Homewood Canyon
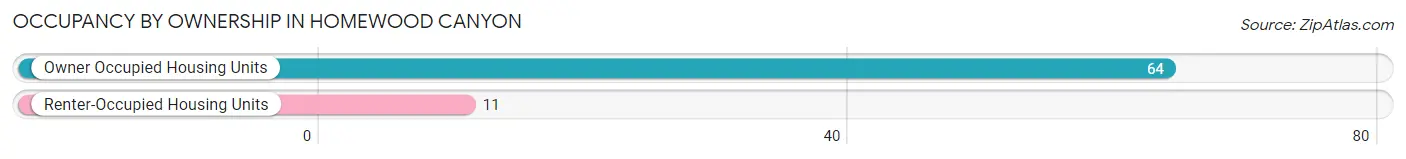
Occupancy by Ownership in Homewood Canyon
Of the total 75 dwellings in Homewood Canyon, owner-occupied units account for 64 (85.3%), while renter-occupied units make up 11 (14.7%).
| Occupancy | # Housing Units | % Housing Units |
| Owner Occupied Housing Units | 64 | 85.3% |
| Renter-Occupied Housing Units | 11 | 14.7% |
| Total Occupied Housing Units | 75 | 100.0% |
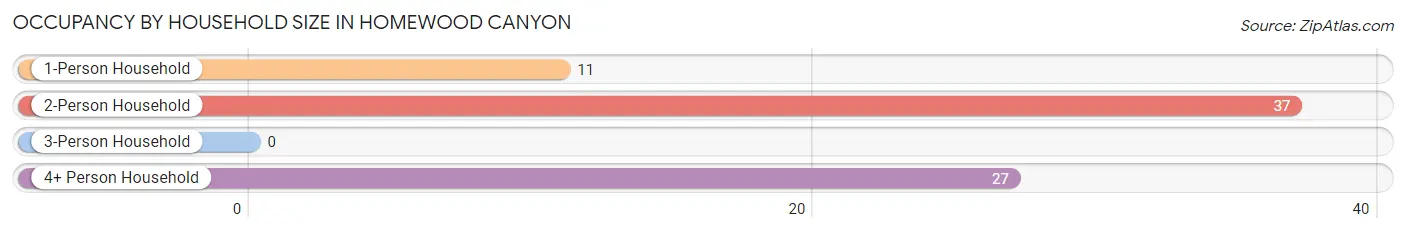
Occupancy by Household Size in Homewood Canyon
| Household Size | # Housing Units | % Housing Units |
| 1-Person Household | 11 | 14.7% |
| 2-Person Household | 37 | 49.3% |
| 3-Person Household | 0 | 0.0% |
| 4+ Person Household | 27 | 36.0% |
| Total Housing Units | 75 | 100.0% |
Occupancy by Ownership by Household Size in Homewood Canyon
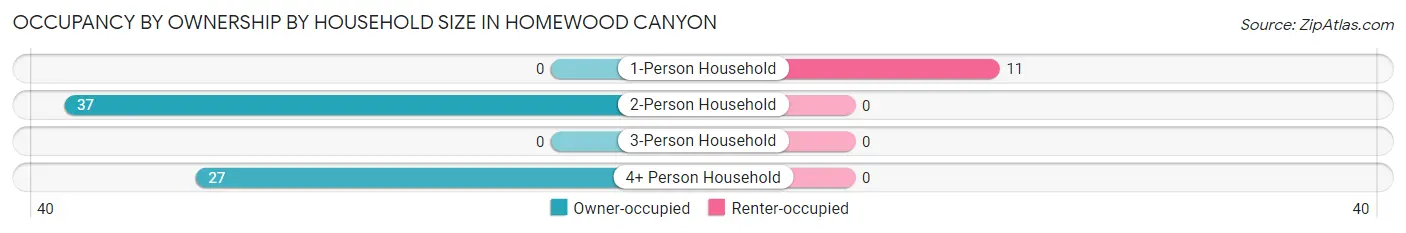
| Household Size | Owner-occupied | Renter-occupied |
| 1-Person Household | 0 (0.0%) | 11 (100.0%) |
| 2-Person Household | 37 (100.0%) | 0 (0.0%) |
| 3-Person Household | 0 (0.0%) | 0 (0.0%) |
| 4+ Person Household | 27 (100.0%) | 0 (0.0%) |
| Total Housing Units | 64 (85.3%) | 11 (14.7%) |
Occupancy by Educational Attainment in Homewood Canyon
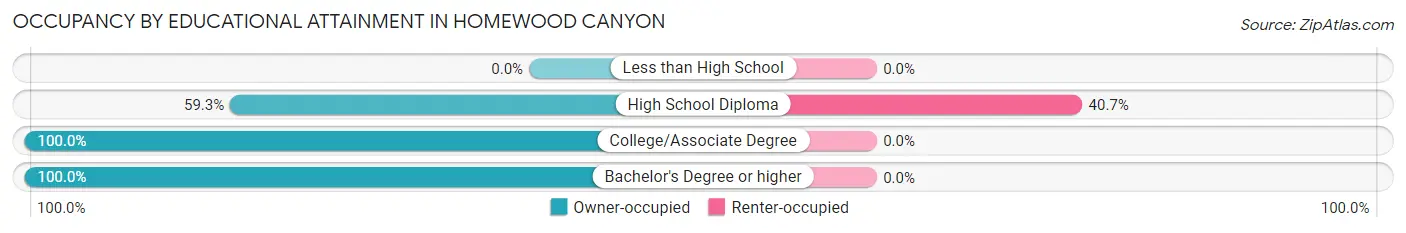
| Household Size | Owner-occupied | Renter-occupied |
| Less than High School | 0 (0.0%) | 0 (0.0%) |
| High School Diploma | 16 (59.3%) | 11 (40.7%) |
| College/Associate Degree | 27 (100.0%) | 0 (0.0%) |
| Bachelor's Degree or higher | 21 (100.0%) | 0 (0.0%) |
Occupancy by Age of Householder in Homewood Canyon
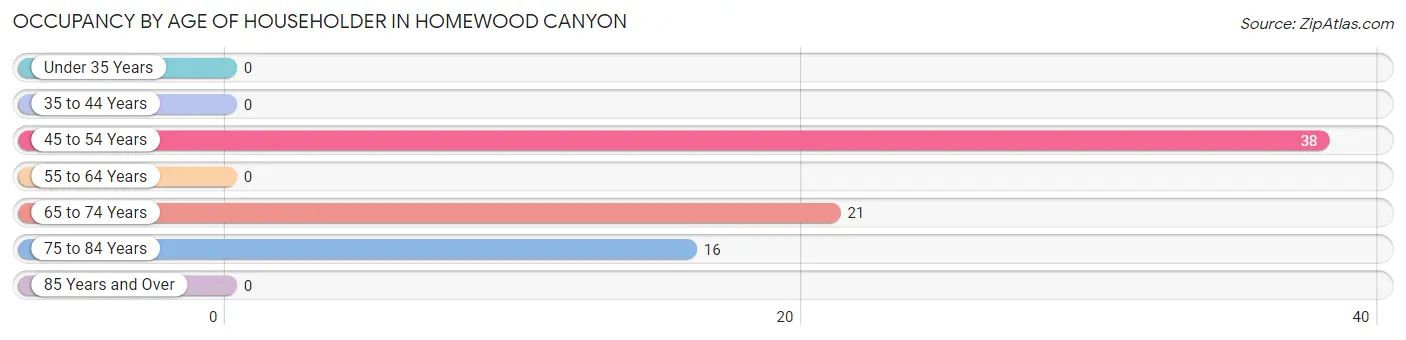
| Age Bracket | # Households | % Households |
| Under 35 Years | 0 | 0.0% |
| 35 to 44 Years | 0 | 0.0% |
| 45 to 54 Years | 38 | 50.7% |
| 55 to 64 Years | 0 | 0.0% |
| 65 to 74 Years | 21 | 28.0% |
| 75 to 84 Years | 16 | 21.3% |
| 85 Years and Over | 0 | 0.0% |
| Total | 75 | 100.0% |
Housing Finances in Homewood Canyon
Median Income by Occupancy in Homewood Canyon
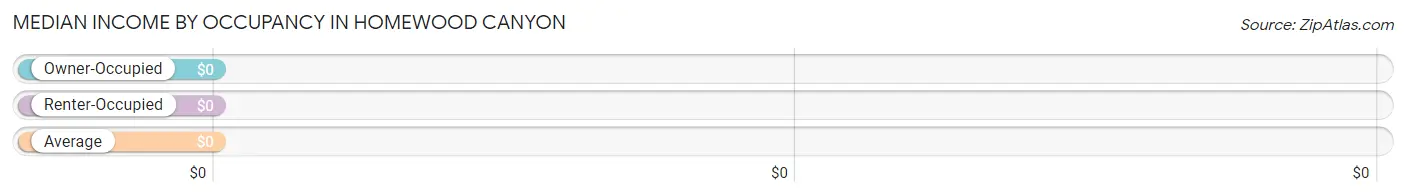
| Occupancy Type | # Households | Median Income |
| Owner-Occupied | 64 (85.3%) | $0 |
| Renter-Occupied | 11 (14.7%) | $0 |
| Average | 75 (100.0%) | $0 |
Occupancy by Householder Income Bracket in Homewood Canyon
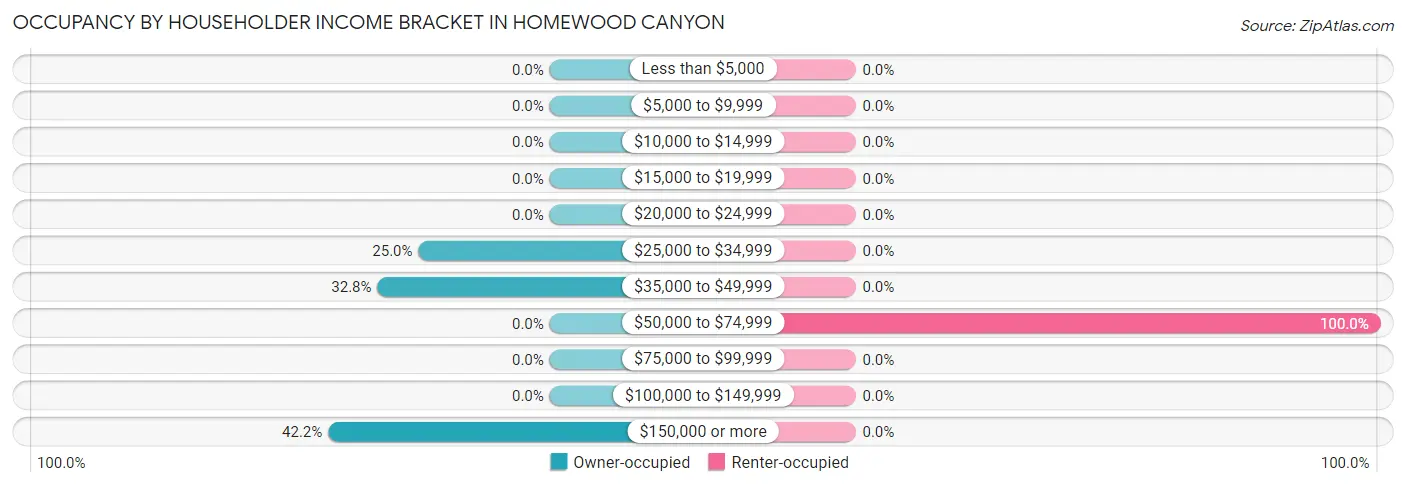
| Income Bracket | Owner-occupied | Renter-occupied |
| Less than $5,000 | 0 (0.0%) | 0 (0.0%) |
| $5,000 to $9,999 | 0 (0.0%) | 0 (0.0%) |
| $10,000 to $14,999 | 0 (0.0%) | 0 (0.0%) |
| $15,000 to $19,999 | 0 (0.0%) | 0 (0.0%) |
| $20,000 to $24,999 | 0 (0.0%) | 0 (0.0%) |
| $25,000 to $34,999 | 16 (25.0%) | 0 (0.0%) |
| $35,000 to $49,999 | 21 (32.8%) | 0 (0.0%) |
| $50,000 to $74,999 | 0 (0.0%) | 11 (100.0%) |
| $75,000 to $99,999 | 0 (0.0%) | 0 (0.0%) |
| $100,000 to $149,999 | 0 (0.0%) | 0 (0.0%) |
| $150,000 or more | 27 (42.2%) | 0 (0.0%) |
| Total | 64 (100.0%) | 11 (100.0%) |
Monthly Housing Cost Tiers in Homewood Canyon
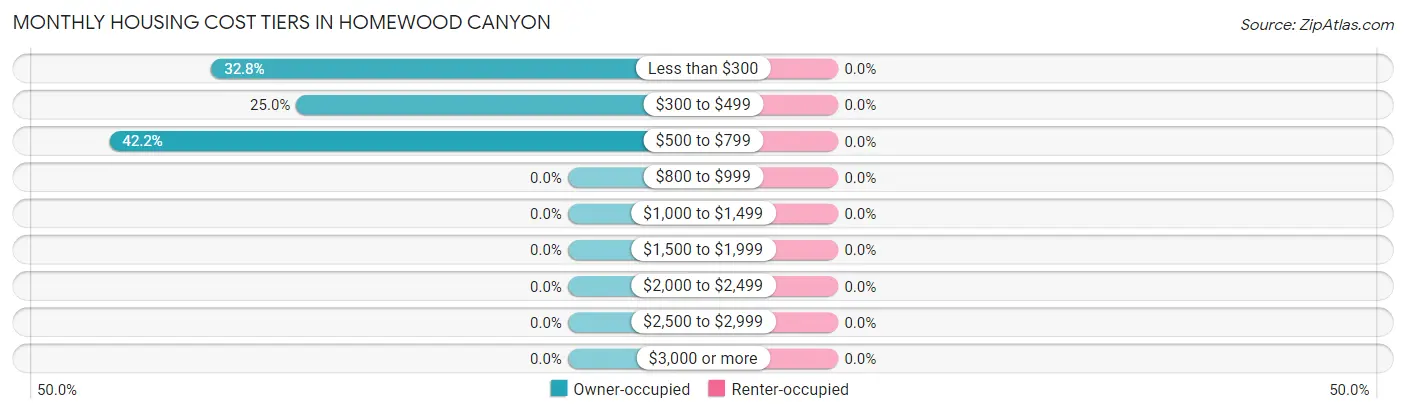
| Monthly Cost | Owner-occupied | Renter-occupied |
| Less than $300 | 21 (32.8%) | 0 (0.0%) |
| $300 to $499 | 16 (25.0%) | 0 (0.0%) |
| $500 to $799 | 27 (42.2%) | 0 (0.0%) |
| $800 to $999 | 0 (0.0%) | 0 (0.0%) |
| $1,000 to $1,499 | 0 (0.0%) | 0 (0.0%) |
| $1,500 to $1,999 | 0 (0.0%) | 0 (0.0%) |
| $2,000 to $2,499 | 0 (0.0%) | 0 (0.0%) |
| $2,500 to $2,999 | 0 (0.0%) | 0 (0.0%) |
| $3,000 or more | 0 (0.0%) | 0 (0.0%) |
| Total | 64 (100.0%) | 11 (100.0%) |
Physical Housing Characteristics in Homewood Canyon
Housing Structures in Homewood Canyon
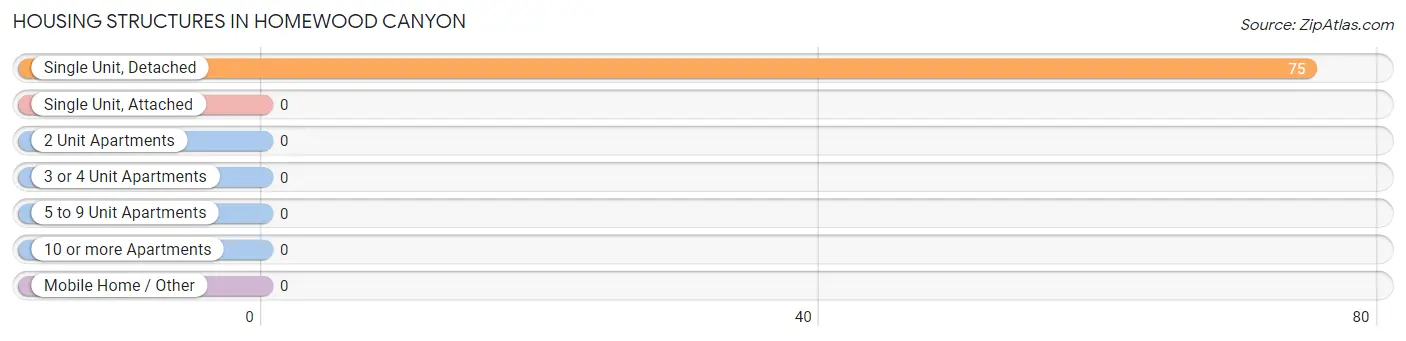
| Structure Type | # Housing Units | % Housing Units |
| Single Unit, Detached | 75 | 100.0% |
| Single Unit, Attached | 0 | 0.0% |
| 2 Unit Apartments | 0 | 0.0% |
| 3 or 4 Unit Apartments | 0 | 0.0% |
| 5 to 9 Unit Apartments | 0 | 0.0% |
| 10 or more Apartments | 0 | 0.0% |
| Mobile Home / Other | 0 | 0.0% |
| Total | 75 | 100.0% |
Housing Structures by Occupancy in Homewood Canyon
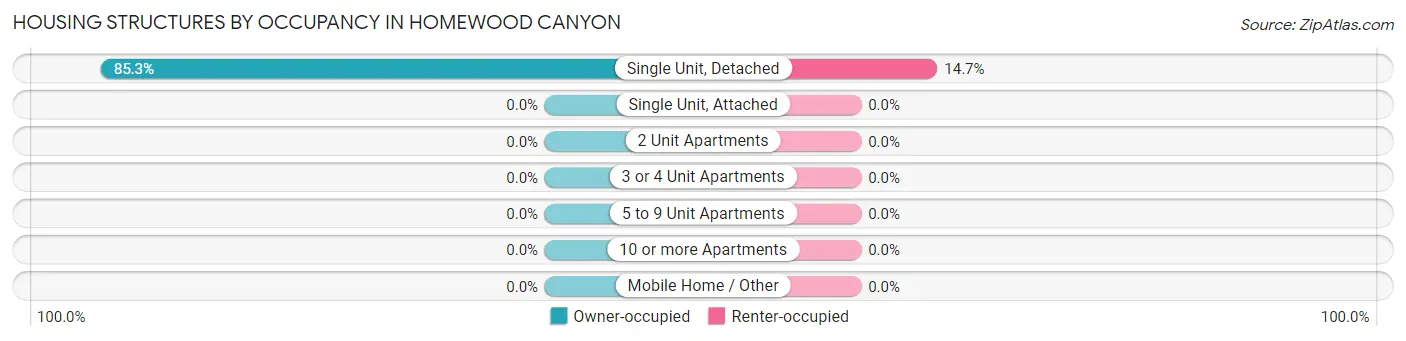
| Structure Type | Owner-occupied | Renter-occupied |
| Single Unit, Detached | 64 (85.3%) | 11 (14.7%) |
| Single Unit, Attached | 0 (0.0%) | 0 (0.0%) |
| 2 Unit Apartments | 0 (0.0%) | 0 (0.0%) |
| 3 or 4 Unit Apartments | 0 (0.0%) | 0 (0.0%) |
| 5 to 9 Unit Apartments | 0 (0.0%) | 0 (0.0%) |
| 10 or more Apartments | 0 (0.0%) | 0 (0.0%) |
| Mobile Home / Other | 0 (0.0%) | 0 (0.0%) |
| Total | 64 (85.3%) | 11 (14.7%) |
Housing Structures by Number of Rooms in Homewood Canyon
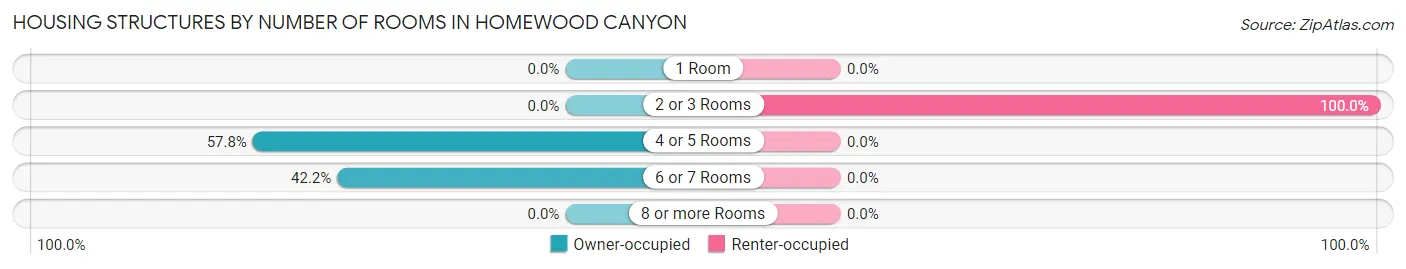
| Number of Rooms | Owner-occupied | Renter-occupied |
| 1 Room | 0 (0.0%) | 0 (0.0%) |
| 2 or 3 Rooms | 0 (0.0%) | 11 (100.0%) |
| 4 or 5 Rooms | 37 (57.8%) | 0 (0.0%) |
| 6 or 7 Rooms | 27 (42.2%) | 0 (0.0%) |
| 8 or more Rooms | 0 (0.0%) | 0 (0.0%) |
| Total | 64 (100.0%) | 11 (100.0%) |
Housing Structure by Heating Type in Homewood Canyon
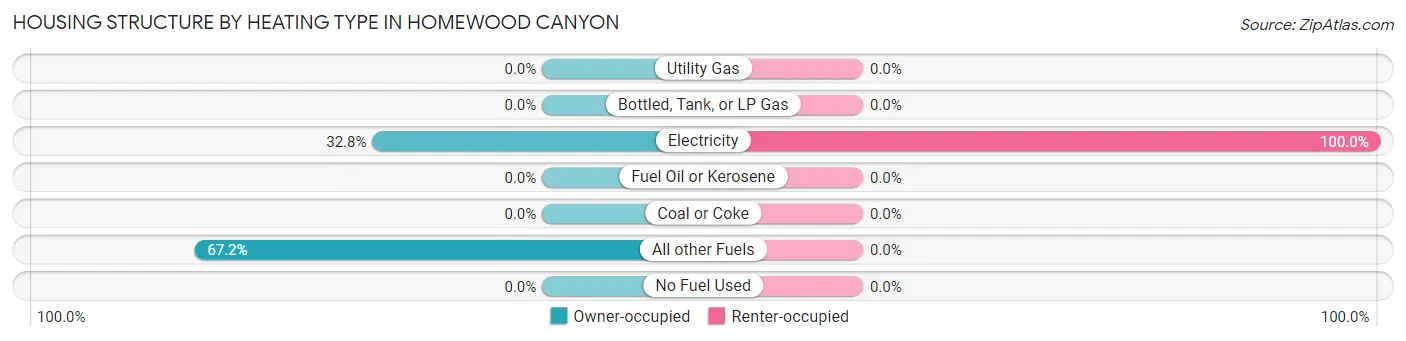
| Heating Type | Owner-occupied | Renter-occupied |
| Utility Gas | 0 (0.0%) | 0 (0.0%) |
| Bottled, Tank, or LP Gas | 0 (0.0%) | 0 (0.0%) |
| Electricity | 21 (32.8%) | 11 (100.0%) |
| Fuel Oil or Kerosene | 0 (0.0%) | 0 (0.0%) |
| Coal or Coke | 0 (0.0%) | 0 (0.0%) |
| All other Fuels | 43 (67.2%) | 0 (0.0%) |
| No Fuel Used | 0 (0.0%) | 0 (0.0%) |
| Total | 64 (100.0%) | 11 (100.0%) |
Household Vehicle Usage in Homewood Canyon
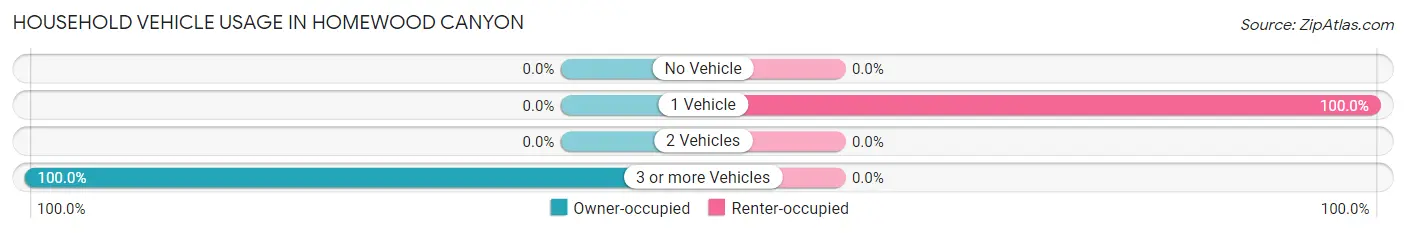
| Vehicles per Household | Owner-occupied | Renter-occupied |
| No Vehicle | 0 (0.0%) | 0 (0.0%) |
| 1 Vehicle | 0 (0.0%) | 11 (100.0%) |
| 2 Vehicles | 0 (0.0%) | 0 (0.0%) |
| 3 or more Vehicles | 64 (100.0%) | 0 (0.0%) |
| Total | 64 (100.0%) | 11 (100.0%) |
Real Estate & Mortgages in Homewood Canyon
Real Estate and Mortgage Overview in Homewood Canyon
| Characteristic | Without Mortgage | With Mortgage |
| Housing Units | 64 | 0 |
| Median Property Value | - | - |
| Median Household Income | - | - |
| Monthly Housing Costs | - | - |
| Real Estate Taxes | $651 | $0 |
Property Value by Mortgage Status in Homewood Canyon
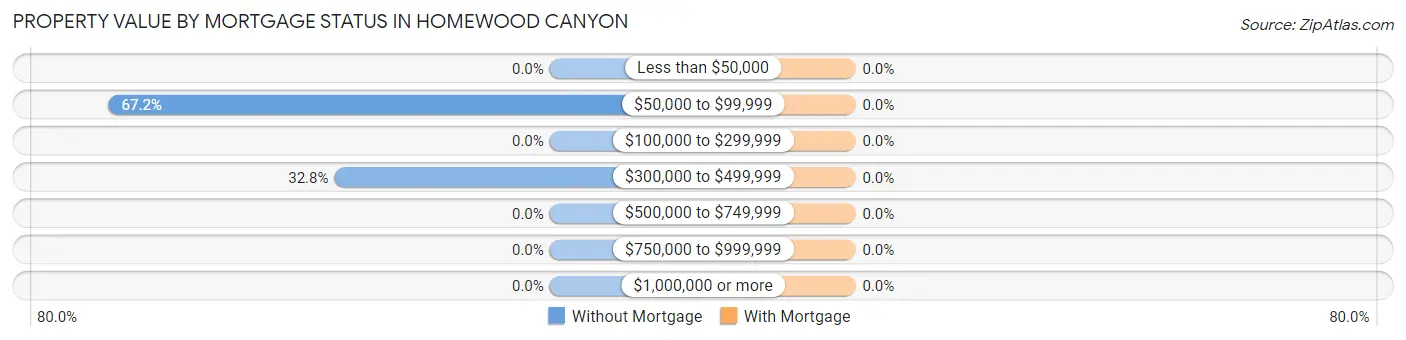
| Property Value | Without Mortgage | With Mortgage |
| Less than $50,000 | 0 (0.0%) | 0 (0.0%) |
| $50,000 to $99,999 | 43 (67.2%) | 0 (0.0%) |
| $100,000 to $299,999 | 0 (0.0%) | 0 (0.0%) |
| $300,000 to $499,999 | 21 (32.8%) | 0 (0.0%) |
| $500,000 to $749,999 | 0 (0.0%) | 0 (0.0%) |
| $750,000 to $999,999 | 0 (0.0%) | 0 (0.0%) |
| $1,000,000 or more | 0 (0.0%) | 0 (0.0%) |
| Total | 64 (100.0%) | 0 (0.0%) |
Household Income by Mortgage Status in Homewood Canyon
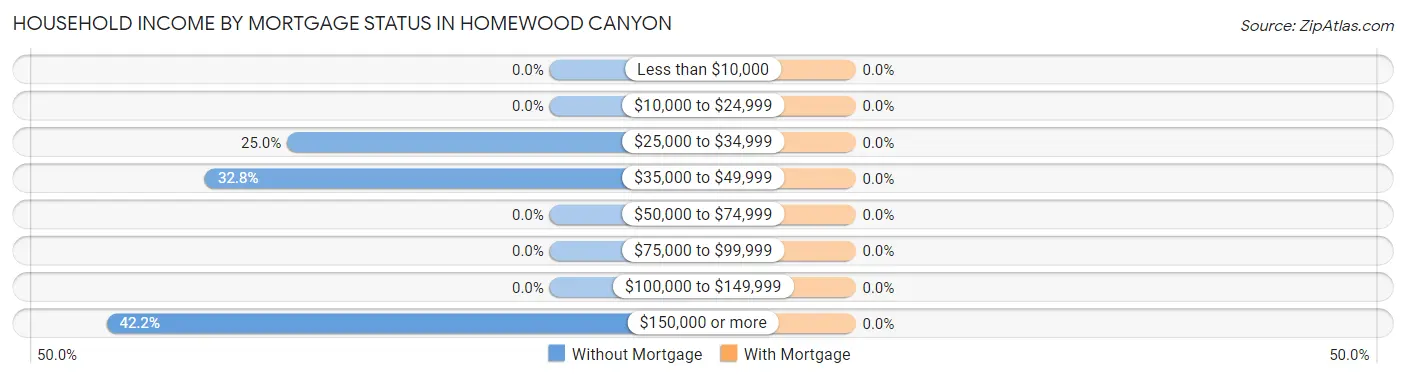
| Household Income | Without Mortgage | With Mortgage |
| Less than $10,000 | 0 (0.0%) | 0 (0.0%) |
| $10,000 to $24,999 | 0 (0.0%) | 0 (0.0%) |
| $25,000 to $34,999 | 16 (25.0%) | 0 (0.0%) |
| $35,000 to $49,999 | 21 (32.8%) | 0 (0.0%) |
| $50,000 to $74,999 | 0 (0.0%) | 0 (0.0%) |
| $75,000 to $99,999 | 0 (0.0%) | 0 (0.0%) |
| $100,000 to $149,999 | 0 (0.0%) | 0 (0.0%) |
| $150,000 or more | 27 (42.2%) | 0 (0.0%) |
| Total | 64 (100.0%) | 0 (0.0%) |
Property Value to Household Income Ratio in Homewood Canyon
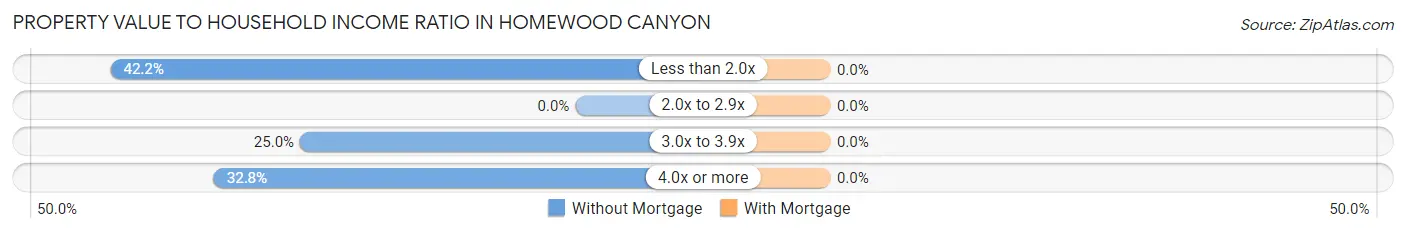
| Value-to-Income Ratio | Without Mortgage | With Mortgage |
| Less than 2.0x | 27 (42.2%) | 0 (0.0%) |
| 2.0x to 2.9x | 0 (0.0%) | 0 (0.0%) |
| 3.0x to 3.9x | 16 (25.0%) | 0 (0.0%) |
| 4.0x or more | 21 (32.8%) | 0 (0.0%) |
| Total | 64 (100.0%) | 0 (0.0%) |
Real Estate Taxes by Mortgage Status in Homewood Canyon
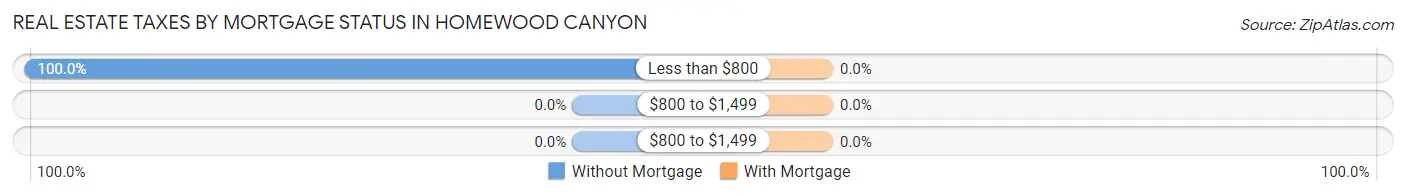
| Property Taxes | Without Mortgage | With Mortgage |
| Less than $800 | 64 (100.0%) | 0 (0.0%) |
| $800 to $1,499 | 0 (0.0%) | 0 (0.0%) |
| $800 to $1,499 | 0 (0.0%) | 0 (0.0%) |
| Total | 64 (100.0%) | 0 (0.0%) |
Health & Disability in Homewood Canyon
Health Insurance Coverage by Age in Homewood Canyon
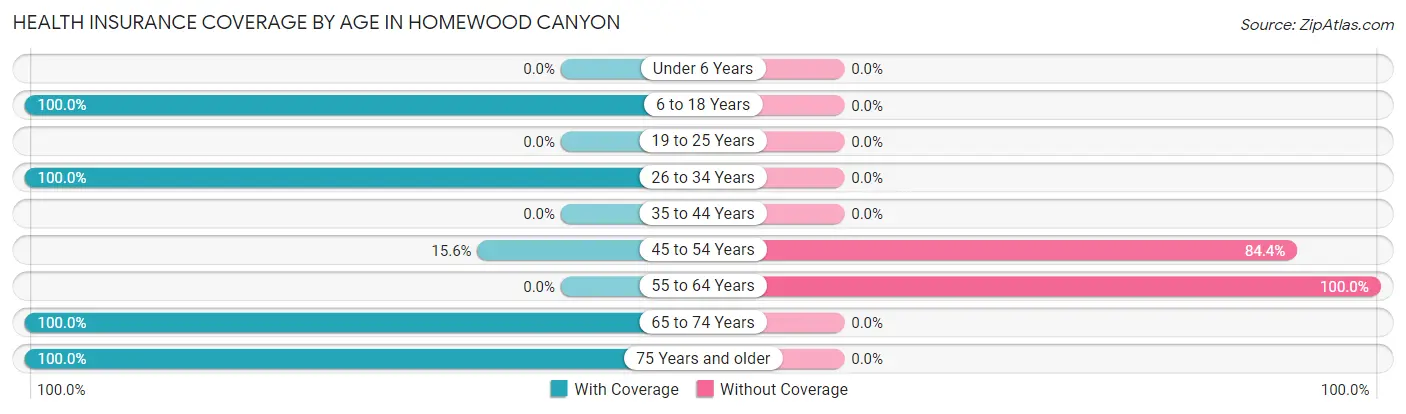
| Age Bracket | With Coverage | Without Coverage |
| Under 6 Years | 0 (0.0%) | 0 (0.0%) |
| 6 to 18 Years | 27 (100.0%) | 0 (0.0%) |
| 19 to 25 Years | 0 (0.0%) | 0 (0.0%) |
| 26 to 34 Years | 83 (100.0%) | 0 (0.0%) |
| 35 to 44 Years | 0 (0.0%) | 0 (0.0%) |
| 45 to 54 Years | 7 (15.6%) | 38 (84.4%) |
| 55 to 64 Years | 0 (0.0%) | 12 (100.0%) |
| 65 to 74 Years | 41 (100.0%) | 0 (0.0%) |
| 75 Years and older | 16 (100.0%) | 0 (0.0%) |
| Total | 174 (77.7%) | 50 (22.3%) |
Health Insurance Coverage by Citizenship Status in Homewood Canyon
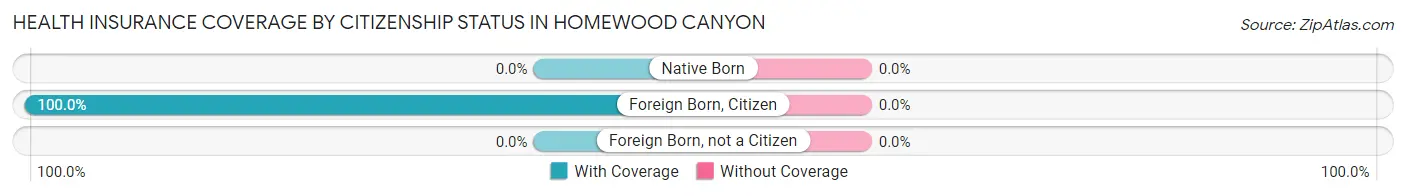
| Citizenship Status | With Coverage | Without Coverage |
| Native Born | 0 (0.0%) | 0 (0.0%) |
| Foreign Born, Citizen | 27 (100.0%) | 0 (0.0%) |
| Foreign Born, not a Citizen | 0 (0.0%) | 0 (0.0%) |
Health Insurance Coverage by Household Income in Homewood Canyon
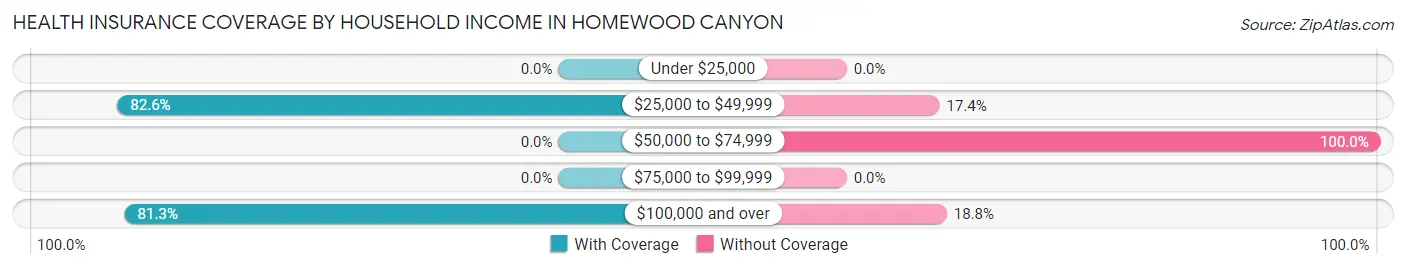
| Household Income | With Coverage | Without Coverage |
| Under $25,000 | 0 (0.0%) | 0 (0.0%) |
| $25,000 to $49,999 | 57 (82.6%) | 12 (17.4%) |
| $50,000 to $74,999 | 0 (0.0%) | 11 (100.0%) |
| $75,000 to $99,999 | 0 (0.0%) | 0 (0.0%) |
| $100,000 and over | 117 (81.2%) | 27 (18.8%) |
Public vs Private Health Insurance Coverage by Age in Homewood Canyon
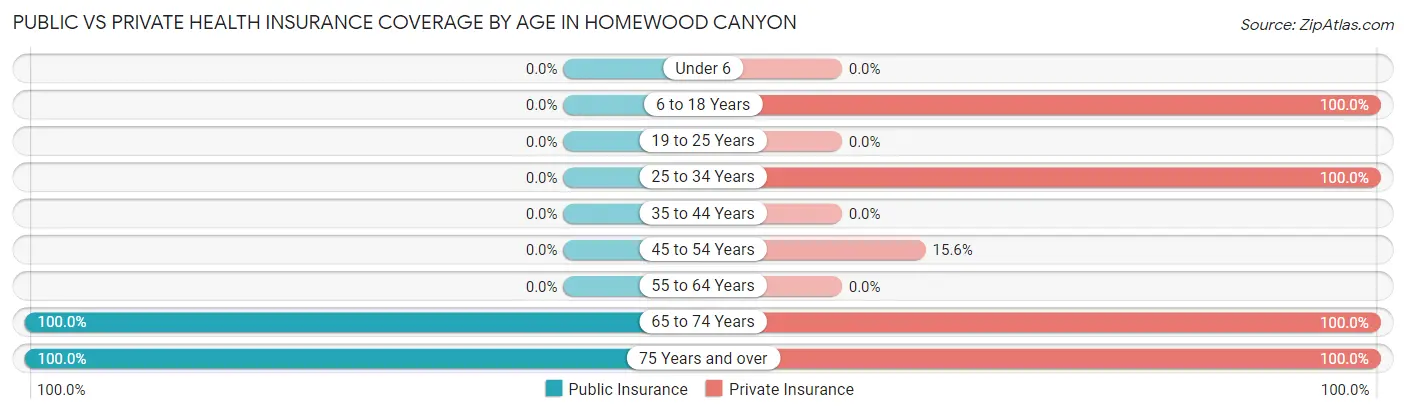
| Age Bracket | Public Insurance | Private Insurance |
| Under 6 | 0 (0.0%) | 0 (0.0%) |
| 6 to 18 Years | 0 (0.0%) | 27 (100.0%) |
| 19 to 25 Years | 0 (0.0%) | 0 (0.0%) |
| 25 to 34 Years | 0 (0.0%) | 83 (100.0%) |
| 35 to 44 Years | 0 (0.0%) | 0 (0.0%) |
| 45 to 54 Years | 0 (0.0%) | 7 (15.6%) |
| 55 to 64 Years | 0 (0.0%) | 0 (0.0%) |
| 65 to 74 Years | 41 (100.0%) | 41 (100.0%) |
| 75 Years and over | 16 (100.0%) | 16 (100.0%) |
| Total | 57 (25.5%) | 174 (77.7%) |
Disability Status by Sex by Age in Homewood Canyon
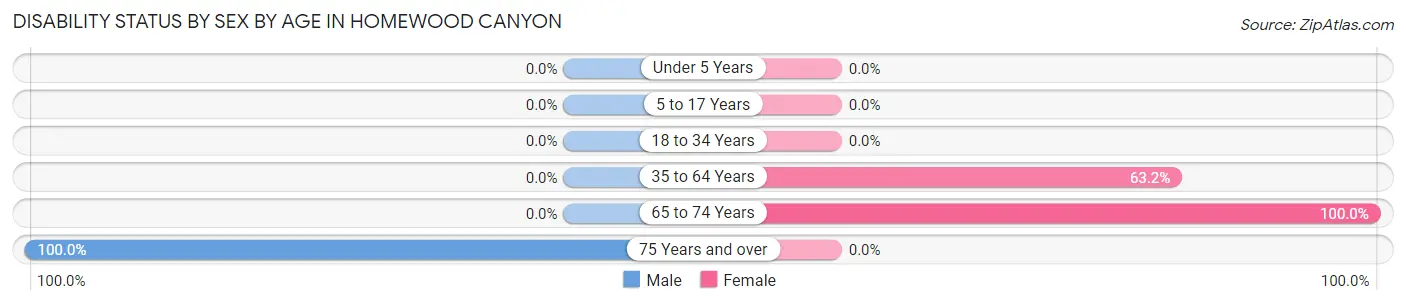
| Age Bracket | Male | Female |
| Under 5 Years | 0 (0.0%) | 0 (0.0%) |
| 5 to 17 Years | 0 (0.0%) | 0 (0.0%) |
| 18 to 34 Years | 0 (0.0%) | 0 (0.0%) |
| 35 to 64 Years | 0 (0.0%) | 12 (63.2%) |
| 65 to 74 Years | 0 (0.0%) | 20 (100.0%) |
| 75 Years and over | 16 (100.0%) | 0 (0.0%) |
Disability Class by Sex by Age in Homewood Canyon
Disability Class: Hearing Difficulty
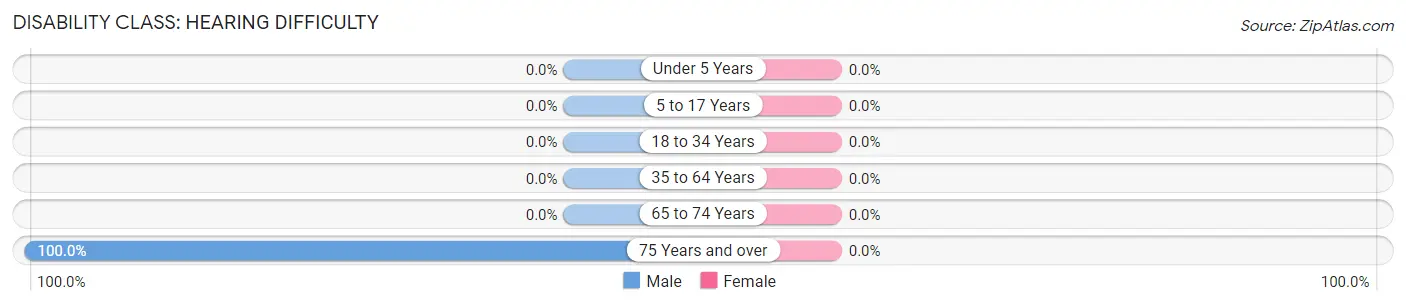
| Age Bracket | Male | Female |
| Under 5 Years | 0 (0.0%) | 0 (0.0%) |
| 5 to 17 Years | 0 (0.0%) | 0 (0.0%) |
| 18 to 34 Years | 0 (0.0%) | 0 (0.0%) |
| 35 to 64 Years | 0 (0.0%) | 0 (0.0%) |
| 65 to 74 Years | 0 (0.0%) | 0 (0.0%) |
| 75 Years and over | 16 (100.0%) | 0 (0.0%) |
Disability Class: Vision Difficulty
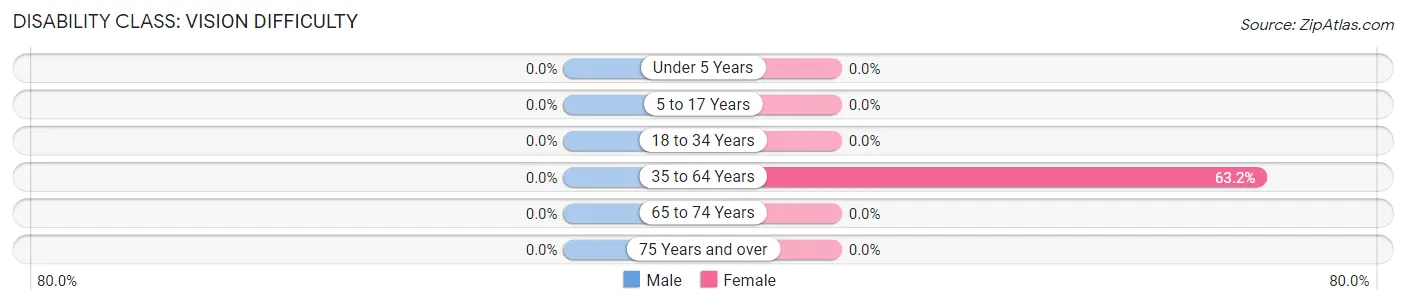
| Age Bracket | Male | Female |
| Under 5 Years | 0 (0.0%) | 0 (0.0%) |
| 5 to 17 Years | 0 (0.0%) | 0 (0.0%) |
| 18 to 34 Years | 0 (0.0%) | 0 (0.0%) |
| 35 to 64 Years | 0 (0.0%) | 12 (63.2%) |
| 65 to 74 Years | 0 (0.0%) | 0 (0.0%) |
| 75 Years and over | 0 (0.0%) | 0 (0.0%) |
Disability Class: Cognitive Difficulty
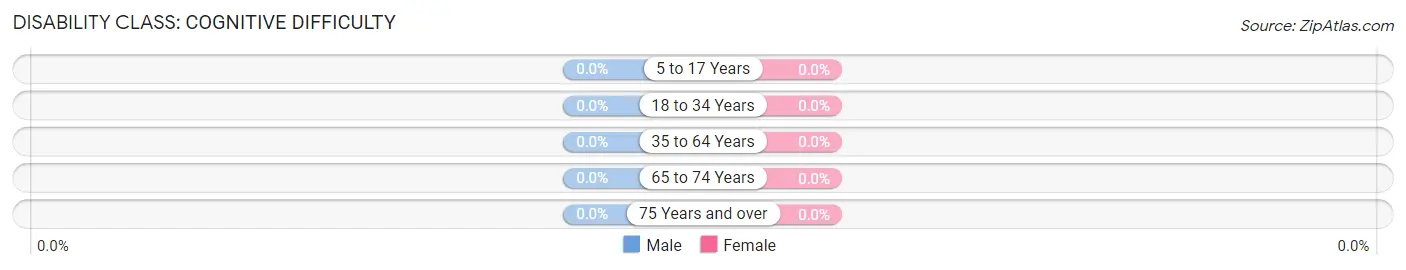
| Age Bracket | Male | Female |
| 5 to 17 Years | 0 (0.0%) | 0 (0.0%) |
| 18 to 34 Years | 0 (0.0%) | 0 (0.0%) |
| 35 to 64 Years | 0 (0.0%) | 0 (0.0%) |
| 65 to 74 Years | 0 (0.0%) | 0 (0.0%) |
| 75 Years and over | 0 (0.0%) | 0 (0.0%) |
Disability Class: Ambulatory Difficulty
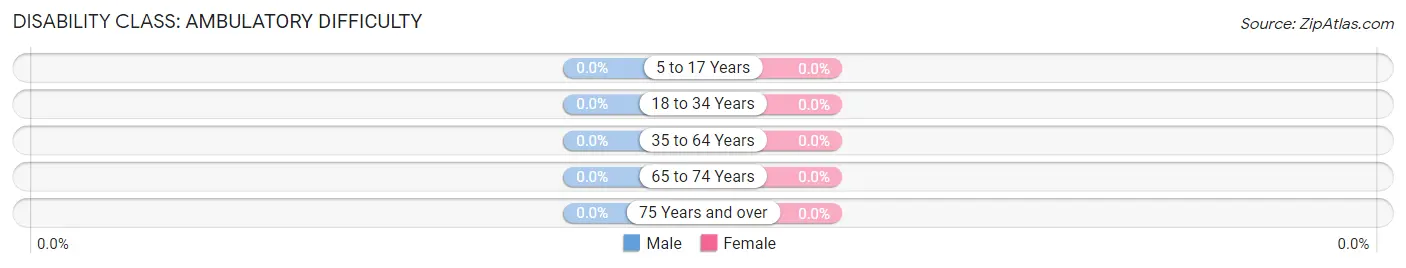
| Age Bracket | Male | Female |
| 5 to 17 Years | 0 (0.0%) | 0 (0.0%) |
| 18 to 34 Years | 0 (0.0%) | 0 (0.0%) |
| 35 to 64 Years | 0 (0.0%) | 0 (0.0%) |
| 65 to 74 Years | 0 (0.0%) | 0 (0.0%) |
| 75 Years and over | 0 (0.0%) | 0 (0.0%) |
Disability Class: Self-Care Difficulty
| Age Bracket | Male | Female |
| 5 to 17 Years | 0 (0.0%) | 0 (0.0%) |
| 18 to 34 Years | 0 (0.0%) | 0 (0.0%) |
| 35 to 64 Years | 0 (0.0%) | 0 (0.0%) |
| 65 to 74 Years | 0 (0.0%) | 0 (0.0%) |
| 75 Years and over | 0 (0.0%) | 0 (0.0%) |
Technology Access in Homewood Canyon
Computing Device Access in Homewood Canyon
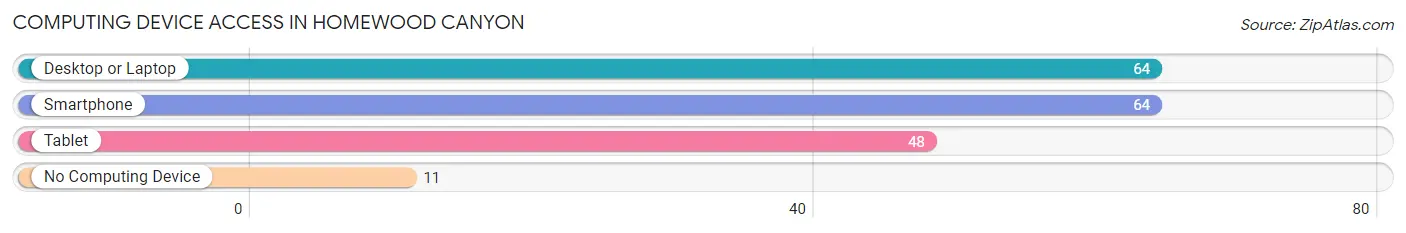
| Device Type | # Households | % Households |
| Desktop or Laptop | 64 | 85.3% |
| Smartphone | 64 | 85.3% |
| Tablet | 48 | 64.0% |
| No Computing Device | 11 | 14.7% |
| Total | 75 | 100.0% |
Internet Access in Homewood Canyon
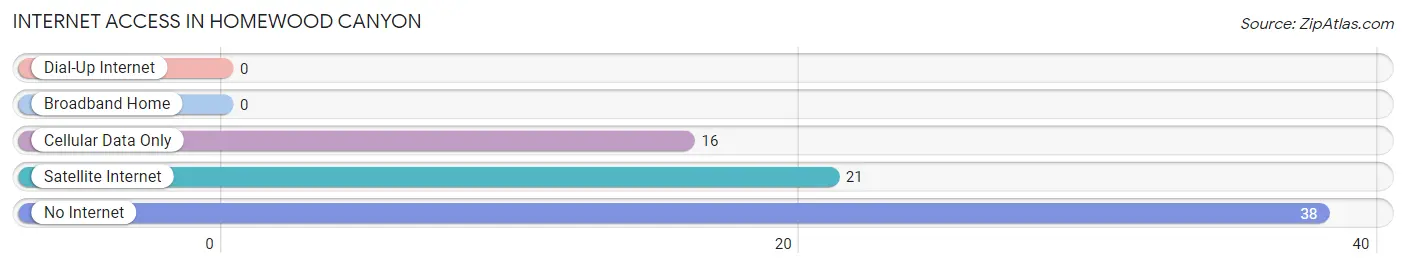
| Internet Type | # Households | % Households |
| Dial-Up Internet | 0 | 0.0% |
| Broadband Home | 0 | 0.0% |
| Cellular Data Only | 16 | 21.3% |
| Satellite Internet | 21 | 28.0% |
| No Internet | 38 | 50.7% |
| Total | 75 | 100.0% |
Homewood Canyon Summary
Homewood Canyon is a small unincorporated community located in the San Bernardino Mountains of Southern California. It is situated in the San Bernardino National Forest, approximately 10 miles east of Lake Arrowhead and 25 miles northeast of San Bernardino. The community is home to a variety of outdoor activities, including hiking, camping, fishing, and skiing.
History
Homewood Canyon was first settled in the late 1800s by a group of miners who were searching for gold. The miners named the area after a nearby homestead, which was owned by a man named John Homewood. The miners built a small community and established a post office in the area in 1891.
The area was also home to a number of logging operations in the early 1900s. Logging was a major industry in the area until the 1950s, when the logging operations ceased due to environmental concerns.
Geography
Homewood Canyon is located in the San Bernardino Mountains of Southern California. The area is surrounded by the San Bernardino National Forest and is approximately 10 miles east of Lake Arrowhead and 25 miles northeast of San Bernardino. The area is known for its scenic beauty and is home to a variety of outdoor activities, including hiking, camping, fishing, and skiing.
The area is also home to a variety of wildlife, including deer, bears, coyotes, and mountain lions. The area is also home to a variety of plant life, including pine, fir, and cedar trees.
Economy
Homewood Canyon is a small, rural community with a limited economy. The area is home to a few small businesses, including a general store, a gas station, and a few restaurants. The area is also home to a number of vacation rental properties, which are popular with tourists and outdoor enthusiasts.
The area is also home to a number of outdoor recreation activities, including hiking, camping, fishing, and skiing. The area is also home to a number of ski resorts, which attract visitors from all over the world.
Demographics
Homewood Canyon is a small, rural community with a population of approximately 500 people. The area is predominantly white, with a small percentage of African American, Hispanic, and Asian residents. The median household income in the area is approximately $50,000, and the median home value is approximately $250,000. The area is home to a number of vacation rental properties, which attract visitors from all over the world.
Common Questions
What is Per Capita Income in Homewood Canyon?
Per Capita income in Homewood Canyon is $39,032.
What is Inequality or Gini Index in Homewood Canyon?
Inequality or Gini Index in Homewood Canyon is 0.36.
What is the Total Population of Homewood Canyon?
Total Population of Homewood Canyon is 224.
What is the Total Male Population of Homewood Canyon?
Total Male Population of Homewood Canyon is 102.
What is the Total Female Population of Homewood Canyon?
Total Female Population of Homewood Canyon is 122.
What is the Ratio of Males per 100 Females in Homewood Canyon?
There are 83.61 Males per 100 Females in Homewood Canyon.
What is the Ratio of Females per 100 Males in Homewood Canyon?
There are 119.61 Females per 100 Males in Homewood Canyon.
What is the Median Population Age in Homewood Canyon?
Median Population Age in Homewood Canyon is 50.3 Years.
What is the Average Family Size in Homewood Canyon
Average Family Size in Homewood Canyon is 3.3 People.
What is the Average Household Size in Homewood Canyon
Average Household Size in Homewood Canyon is 3.0 People.
How Large is the Labor Force in Homewood Canyon?
There are 155 People in the Labor Forcein in Homewood Canyon.
What is the Percentage of People in the Labor Force in Homewood Canyon?
69.2% of People are in the Labor Force in Homewood Canyon.