Cities with the Highest Percentage of Population with a Degree in Engineering in South Carolina
RELATED REPORTS & OPTIONS
Engineering
South Carolina
Compare Cities
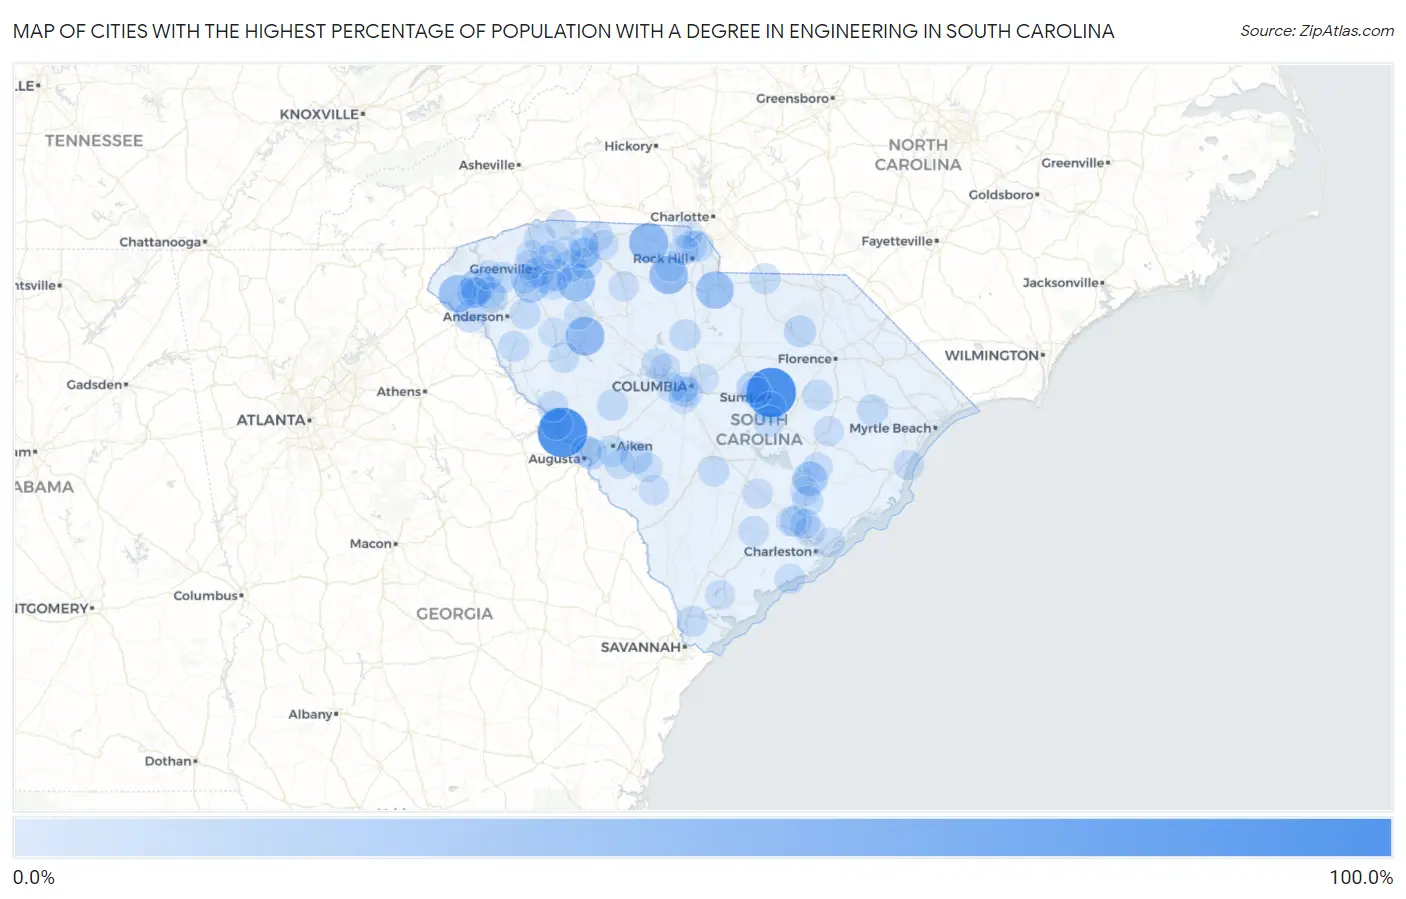
Map of Cities with the Highest Percentage of Population with a Degree in Engineering in South Carolina
0.0%
100.0%
Cities with the Highest Percentage of Population with a Degree in Engineering in South Carolina
| City | % Graduates | vs State | vs National | |
| 1. | Mulberry | 100.0% | 7.0%(+93.0)#1 | 7.6%(+92.4)#22 |
| 2. | Clarks Hill | 100.0% | 7.0%(+93.0)#2 | 7.6%(+92.4)#44 |
| 3. | Smyrna | 50.0% | 7.0%(+43.0)#3 | 7.6%(+42.4)#179 |
| 4. | Mountville | 48.1% | 7.0%(+41.1)#4 | 7.6%(+40.5)#188 |
| 5. | Lowrys | 46.2% | 7.0%(+39.1)#5 | 7.6%(+38.5)#207 |
| 6. | Woodruff | 42.7% | 7.0%(+35.7)#6 | 7.6%(+35.1)#238 |
| 7. | Irwin | 41.9% | 7.0%(+34.8)#7 | 7.6%(+34.2)#246 |
| 8. | Westminster | 40.9% | 7.0%(+33.9)#8 | 7.6%(+33.3)#253 |
| 9. | Golden Grove | 31.0% | 7.0%(+24.0)#9 | 7.6%(+23.3)#415 |
| 10. | Newry | 30.4% | 7.0%(+23.3)#10 | 7.6%(+22.7)#432 |
| 11. | Bonneau Beach | 28.8% | 7.0%(+21.8)#11 | 7.6%(+21.1)#481 |
| 12. | Pimlico | 19.0% | 7.0%(+12.0)#12 | 7.6%(+11.3)#1,164 |
| 13. | Fair Play | 18.2% | 7.0%(+11.2)#13 | 7.6%(+10.5)#1,255 |
| 14. | Reidville | 18.1% | 7.0%(+11.1)#14 | 7.6%(+10.4)#1,288 |
| 15. | Oakland | 17.2% | 7.0%(+10.2)#15 | 7.6%(+9.53)#1,411 |
| 16. | Modoc | 17.1% | 7.0%(+10.1)#16 | 7.6%(+9.47)#1,423 |
| 17. | North Hartsville | 17.0% | 7.0%(+10.0)#17 | 7.6%(+9.36)#1,442 |
| 18. | Windsor | 16.9% | 7.0%(+9.94)#18 | 7.6%(+9.30)#1,452 |
| 19. | Seneca | 16.9% | 7.0%(+9.93)#19 | 7.6%(+9.30)#1,455 |
| 20. | Five Forks | 16.8% | 7.0%(+9.75)#20 | 7.6%(+9.12)#1,484 |
| 21. | Clearwater | 16.0% | 7.0%(+9.00)#21 | 7.6%(+8.37)#1,645 |
| 22. | Clemson | 15.6% | 7.0%(+8.62)#22 | 7.6%(+7.98)#1,747 |
| 23. | Ladson | 15.3% | 7.0%(+8.29)#23 | 7.6%(+7.66)#1,807 |
| 24. | Tigerville | 15.2% | 7.0%(+8.14)#24 | 7.6%(+7.50)#1,833 |
| 25. | Riverview | 14.1% | 7.0%(+7.13)#25 | 7.6%(+6.50)#2,102 |
| 26. | Lakewood | 14.1% | 7.0%(+7.11)#26 | 7.6%(+6.48)#2,109 |
| 27. | Drayton | 13.8% | 7.0%(+6.83)#27 | 7.6%(+6.20)#2,204 |
| 28. | Winnsboro | 13.8% | 7.0%(+6.81)#28 | 7.6%(+6.18)#2,207 |
| 29. | Paxville | 13.5% | 7.0%(+6.50)#29 | 7.6%(+5.87)#2,300 |
| 30. | Ward | 13.3% | 7.0%(+6.32)#30 | 7.6%(+5.69)#2,370 |
| 31. | Aiken | 13.2% | 7.0%(+6.22)#31 | 7.6%(+5.59)#2,401 |
| 32. | Johnsonville | 13.1% | 7.0%(+6.10)#32 | 7.6%(+5.47)#2,442 |
| 33. | Litchfield Beach | 13.0% | 7.0%(+5.96)#33 | 7.6%(+5.33)#2,508 |
| 34. | Liberty | 13.0% | 7.0%(+5.94)#34 | 7.6%(+5.31)#2,516 |
| 35. | Roebuck | 12.8% | 7.0%(+5.81)#35 | 7.6%(+5.18)#2,551 |
| 36. | India Hook | 12.8% | 7.0%(+5.75)#36 | 7.6%(+5.12)#2,577 |
| 37. | North Augusta | 12.7% | 7.0%(+5.71)#37 | 7.6%(+5.08)#2,592 |
| 38. | Hardeeville | 12.7% | 7.0%(+5.66)#38 | 7.6%(+5.02)#2,615 |
| 39. | Arcadia | 12.6% | 7.0%(+5.63)#39 | 7.6%(+5.00)#2,623 |
| 40. | Belton | 12.4% | 7.0%(+5.43)#40 | 7.6%(+4.79)#2,726 |
| 41. | Pageland | 12.3% | 7.0%(+5.31)#41 | 7.6%(+4.67)#2,769 |
| 42. | Plum Branch | 12.2% | 7.0%(+5.18)#42 | 7.6%(+4.55)#2,812 |
| 43. | Pendleton | 11.9% | 7.0%(+4.84)#43 | 7.6%(+4.21)#2,957 |
| 44. | Lake Secession | 11.8% | 7.0%(+4.78)#44 | 7.6%(+4.14)#2,988 |
| 45. | Rowesville | 11.8% | 7.0%(+4.75)#45 | 7.6%(+4.12)#3,000 |
| 46. | Moncks Corner | 11.7% | 7.0%(+4.69)#46 | 7.6%(+4.05)#3,032 |
| 47. | Greenwood | 11.6% | 7.0%(+4.54)#47 | 7.6%(+3.91)#3,092 |
| 48. | Olanta | 11.5% | 7.0%(+4.53)#48 | 7.6%(+3.89)#3,102 |
| 49. | Landrum | 11.3% | 7.0%(+4.24)#49 | 7.6%(+3.61)#3,246 |
| 50. | Saxon | 11.2% | 7.0%(+4.14)#50 | 7.6%(+3.51)#3,296 |
| 51. | Hanahan | 11.0% | 7.0%(+4.04)#51 | 7.6%(+3.40)#3,376 |
| 52. | Mayo | 11.0% | 7.0%(+4.03)#52 | 7.6%(+3.40)#3,378 |
| 53. | Cherryvale | 11.0% | 7.0%(+4.00)#53 | 7.6%(+3.36)#3,395 |
| 54. | Baxter | 10.4% | 7.0%(+3.43)#54 | 7.6%(+2.80)#3,760 |
| 55. | Lake Murray Of Richland | 10.4% | 7.0%(+3.34)#55 | 7.6%(+2.70)#3,824 |
| 56. | Chapin | 10.0% | 7.0%(+2.99)#56 | 7.6%(+2.35)#4,063 |
| 57. | New Ellenton | 10.0% | 7.0%(+2.94)#57 | 7.6%(+2.31)#4,126 |
| 58. | Mcconnells | 9.9% | 7.0%(+2.87)#58 | 7.6%(+2.23)#4,190 |
| 59. | White Knoll | 9.8% | 7.0%(+2.82)#59 | 7.6%(+2.19)#4,229 |
| 60. | Utica | 9.8% | 7.0%(+2.79)#60 | 7.6%(+2.16)#4,244 |
| 61. | Cottageville | 9.8% | 7.0%(+2.79)#61 | 7.6%(+2.16)#4,246 |
| 62. | Lake Wylie | 9.7% | 7.0%(+2.72)#62 | 7.6%(+2.09)#4,293 |
| 63. | Union | 9.5% | 7.0%(+2.45)#63 | 7.6%(+1.81)#4,502 |
| 64. | Pawleys Island | 9.4% | 7.0%(+2.40)#64 | 7.6%(+1.76)#4,536 |
| 65. | Greenville | 9.4% | 7.0%(+2.37)#65 | 7.6%(+1.73)#4,564 |
| 66. | Barnwell | 9.3% | 7.0%(+2.30)#66 | 7.6%(+1.66)#4,624 |
| 67. | Seabrook Island | 9.2% | 7.0%(+2.22)#67 | 7.6%(+1.58)#4,694 |
| 68. | Newport | 9.2% | 7.0%(+2.14)#68 | 7.6%(+1.51)#4,752 |
| 69. | Kingstree | 9.2% | 7.0%(+2.14)#69 | 7.6%(+1.51)#4,753 |
| 70. | Lincolnville | 9.1% | 7.0%(+2.08)#70 | 7.6%(+1.44)#4,803 |
| 71. | Springdale | 9.0% | 7.0%(+1.99)#71 | 7.6%(+1.36)#4,910 |
| 72. | Goose Creek | 9.0% | 7.0%(+1.97)#72 | 7.6%(+1.33)#4,940 |
| 73. | Elliott | 9.0% | 7.0%(+1.95)#73 | 7.6%(+1.32)#4,960 |
| 74. | St Stephen | 8.9% | 7.0%(+1.88)#74 | 7.6%(+1.24)#5,039 |
| 75. | Cayce | 8.8% | 7.0%(+1.80)#75 | 7.6%(+1.17)#5,104 |
| 76. | Travelers Rest | 8.8% | 7.0%(+1.74)#76 | 7.6%(+1.11)#5,149 |
| 77. | Harleyville | 8.7% | 7.0%(+1.74)#77 | 7.6%(+1.10)#5,150 |
| 78. | Boiling Springs | 8.7% | 7.0%(+1.67)#78 | 7.6%(+1.03)#5,236 |
| 79. | Cowpens | 8.5% | 7.0%(+1.49)#79 | 7.6%(+0.852)#5,396 |
| 80. | Mauldin | 8.5% | 7.0%(+1.44)#80 | 7.6%(+0.806)#5,445 |
| 81. | Dunean | 8.4% | 7.0%(+1.36)#81 | 7.6%(+0.723)#5,513 |
| 82. | Dale | 8.3% | 7.0%(+1.25)#82 | 7.6%(+0.609)#5,656 |
| 83. | Pine Ridge | 8.1% | 7.0%(+1.08)#83 | 7.6%(+0.439)#5,856 |
| 84. | Lyman | 8.1% | 7.0%(+1.07)#84 | 7.6%(+0.434)#5,857 |
| 85. | Ware Shoals | 8.0% | 7.0%(+0.989)#85 | 7.6%(+0.352)#5,964 |
| 86. | West Columbia | 7.9% | 7.0%(+0.925)#86 | 7.6%(+0.289)#6,041 |
| 87. | Fripp Island | 7.9% | 7.0%(+0.878)#87 | 7.6%(+0.242)#6,114 |
| 88. | Pinopolis | 7.9% | 7.0%(+0.874)#88 | 7.6%(+0.238)#6,115 |
| 89. | Taylors | 7.9% | 7.0%(+0.839)#89 | 7.6%(+0.203)#6,142 |
| 90. | Woodfield | 7.8% | 7.0%(+0.838)#90 | 7.6%(+0.202)#6,144 |
| 91. | Simpsonville | 7.8% | 7.0%(+0.776)#91 | 7.6%(+0.140)#6,224 |
| 92. | Greer | 7.8% | 7.0%(+0.766)#92 | 7.6%(+0.129)#6,238 |
| 93. | Berea | 7.7% | 7.0%(+0.708)#93 | 7.6%(+0.072)#6,302 |
| 94. | Powdersville | 7.7% | 7.0%(+0.681)#94 | 7.6%(+0.045)#6,331 |
| 95. | Williston | 7.7% | 7.0%(+0.665)#95 | 7.6%(+0.028)#6,386 |
| 96. | Laurel Bay | 7.7% | 7.0%(+0.662)#96 | 7.6%(+0.026)#6,390 |
| 97. | Mount Pleasant | 7.6% | 7.0%(+0.638)#97 | 7.6%(+0.002)#6,417 |
| 98. | Laurens | 7.6% | 7.0%(+0.617)#98 | 7.6%(-0.019)#6,441 |
| 99. | Lexington | 7.6% | 7.0%(+0.604)#99 | 7.6%(-0.032)#6,459 |
| 100. | Six Mile | 7.5% | 7.0%(+0.447)#100 | 7.6%(-0.189)#6,646 |
Common Questions
What are the Top 10 Cities with the Highest Percentage of Population with a Degree in Engineering in South Carolina?
Top 10 Cities with the Highest Percentage of Population with a Degree in Engineering in South Carolina are:
#1
100.0%
#2
100.0%
#3
50.0%
#4
48.1%
#5
46.2%
#6
42.7%
#7
41.9%
#8
40.9%
#9
31.0%
#10
30.4%
What city has the Highest Percentage of Population with a Degree in Engineering in South Carolina?
Mulberry has the Highest Percentage of Population with a Degree in Engineering in South Carolina with 100.0%.
What is the Percentage of Population with a Degree in Engineering in the State of South Carolina?
Percentage of Population with a Degree in Engineering in South Carolina is 7.0%.
What is the Percentage of Population with a Degree in Engineering in the United States?
Percentage of Population with a Degree in Engineering in the United States is 7.6%.