Littlerock, CA Map & Demographics
Littlerock Map
Littlerock Overview
$24,619
PER CAPITA INCOME
$59,563
AVG FAMILY INCOME
$68,194
AVG HOUSEHOLD INCOME
29.3%
WAGE / INCOME GAP [ % ]
70.7¢/ $1
WAGE / INCOME GAP [ $ ]
0.33
INEQUALITY / GINI INDEX
1,509
TOTAL POPULATION
767
MALE POPULATION
742
FEMALE POPULATION
103.37
MALES / 100 FEMALES
96.74
FEMALES / 100 MALES
25.5
MEDIAN AGE
3.9
AVG FAMILY SIZE
4.0
AVG HOUSEHOLD SIZE
679
LABOR FORCE [ PEOPLE ]
63.9%
PERCENT IN LABOR FORCE
7.5%
UNEMPLOYMENT RATE
Littlerock Zip Codes
Littlerock Area Codes
Income in Littlerock
Income Overview in Littlerock
Per Capita Income in Littlerock is $24,619, while median incomes of families and households are $59,563 and $68,194 respectively.
| Characteristic | Number | Measure |
| Per Capita Income | 1,509 | $24,619 |
| Median Family Income | 367 | $59,563 |
| Mean Family Income | 367 | $79,947 |
| Median Household Income | 379 | $68,194 |
| Mean Household Income | 379 | $90,911 |
| Income Deficit | 367 | $0 |
| Wage / Income Gap (%) | 1,509 | 29.28% |
| Wage / Income Gap ($) | 1,509 | 70.72¢ per $1 |
| Gini / Inequality Index | 1,509 | 0.33 |
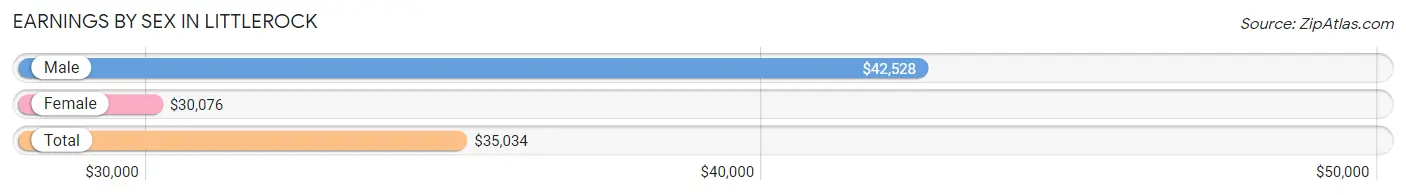
Earnings by Sex in Littlerock
Average Earnings in Littlerock are $35,034, $42,528 for men and $30,076 for women, a difference of 29.3%.
| Sex | Number | Average Earnings |
| Male | 419 (61.7%) | $42,528 |
| Female | 260 (38.3%) | $30,076 |
| Total | 679 (100.0%) | $35,034 |
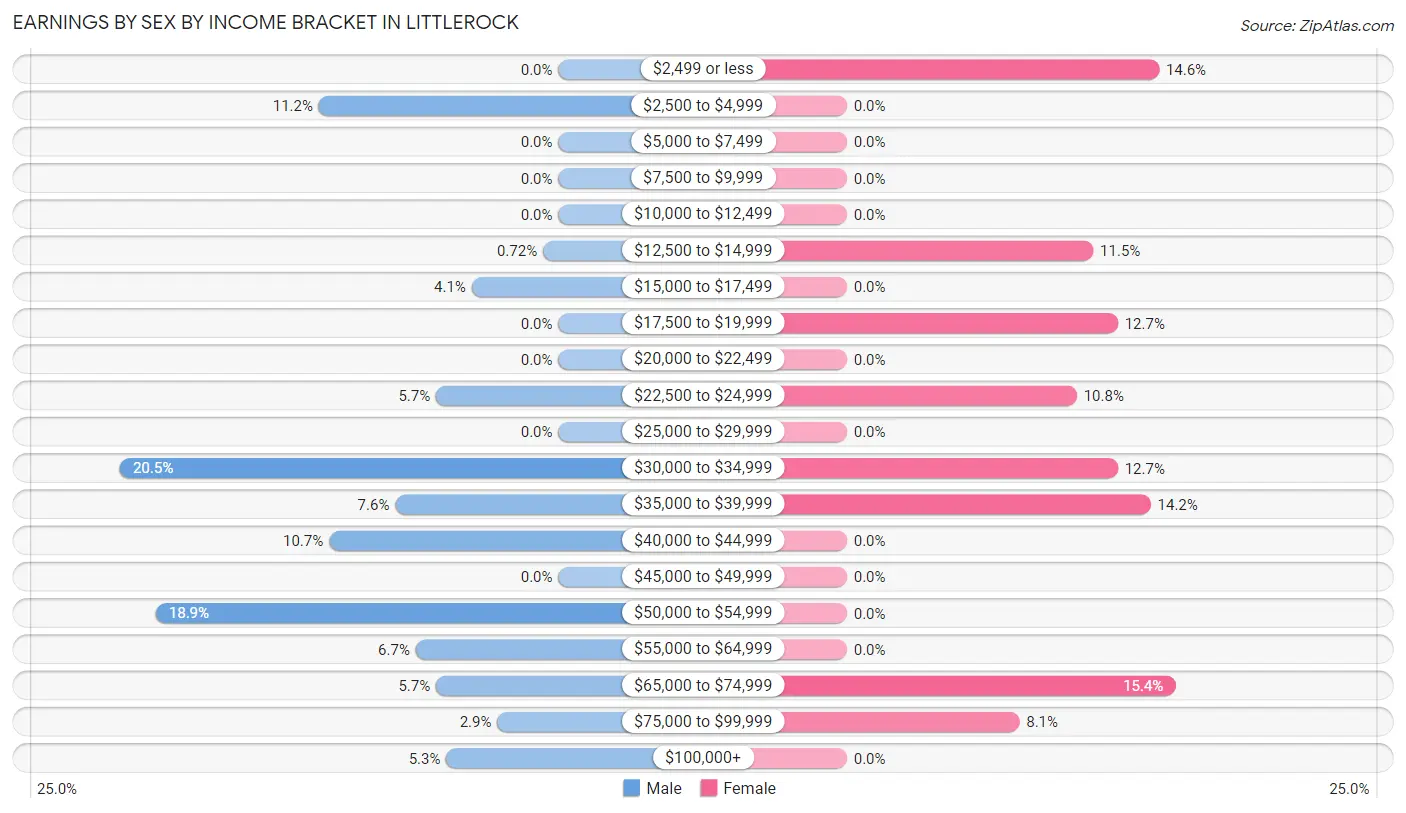
Earnings by Sex by Income Bracket in Littlerock
The most common earnings brackets in Littlerock are $30,000 to $34,999 for men (86 | 20.5%) and $65,000 to $74,999 for women (40 | 15.4%).
| Income | Male | Female |
| $2,499 or less | 0 (0.0%) | 38 (14.6%) |
| $2,500 to $4,999 | 47 (11.2%) | 0 (0.0%) |
| $5,000 to $7,499 | 0 (0.0%) | 0 (0.0%) |
| $7,500 to $9,999 | 0 (0.0%) | 0 (0.0%) |
| $10,000 to $12,499 | 0 (0.0%) | 0 (0.0%) |
| $12,500 to $14,999 | 3 (0.7%) | 30 (11.5%) |
| $15,000 to $17,499 | 17 (4.1%) | 0 (0.0%) |
| $17,500 to $19,999 | 0 (0.0%) | 33 (12.7%) |
| $20,000 to $22,499 | 0 (0.0%) | 0 (0.0%) |
| $22,500 to $24,999 | 24 (5.7%) | 28 (10.8%) |
| $25,000 to $29,999 | 0 (0.0%) | 0 (0.0%) |
| $30,000 to $34,999 | 86 (20.5%) | 33 (12.7%) |
| $35,000 to $39,999 | 32 (7.6%) | 37 (14.2%) |
| $40,000 to $44,999 | 45 (10.7%) | 0 (0.0%) |
| $45,000 to $49,999 | 0 (0.0%) | 0 (0.0%) |
| $50,000 to $54,999 | 79 (18.9%) | 0 (0.0%) |
| $55,000 to $64,999 | 28 (6.7%) | 0 (0.0%) |
| $65,000 to $74,999 | 24 (5.7%) | 40 (15.4%) |
| $75,000 to $99,999 | 12 (2.9%) | 21 (8.1%) |
| $100,000+ | 22 (5.2%) | 0 (0.0%) |
| Total | 419 (100.0%) | 260 (100.0%) |
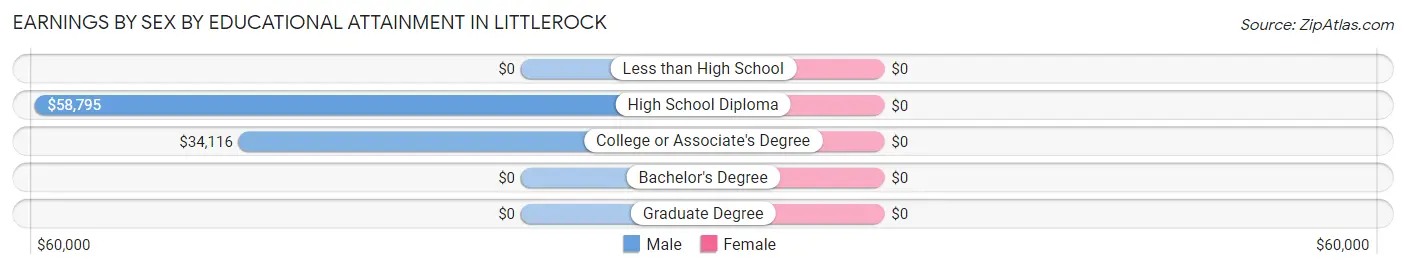
Earnings by Sex by Educational Attainment in Littlerock
| Educational Attainment | Male Income | Female Income |
| Less than High School | - | - |
| High School Diploma | $58,795 | $0 |
| College or Associate's Degree | $34,116 | $0 |
| Bachelor's Degree | - | - |
| Graduate Degree | - | - |
| Total | $52,598 | $0 |
Family Income in Littlerock
Family Income Brackets in Littlerock
According to the Littlerock family income data, there are 126 families falling into the $50,000 to $74,999 income range, which is the most common income bracket and makes up 34.3% of all families.
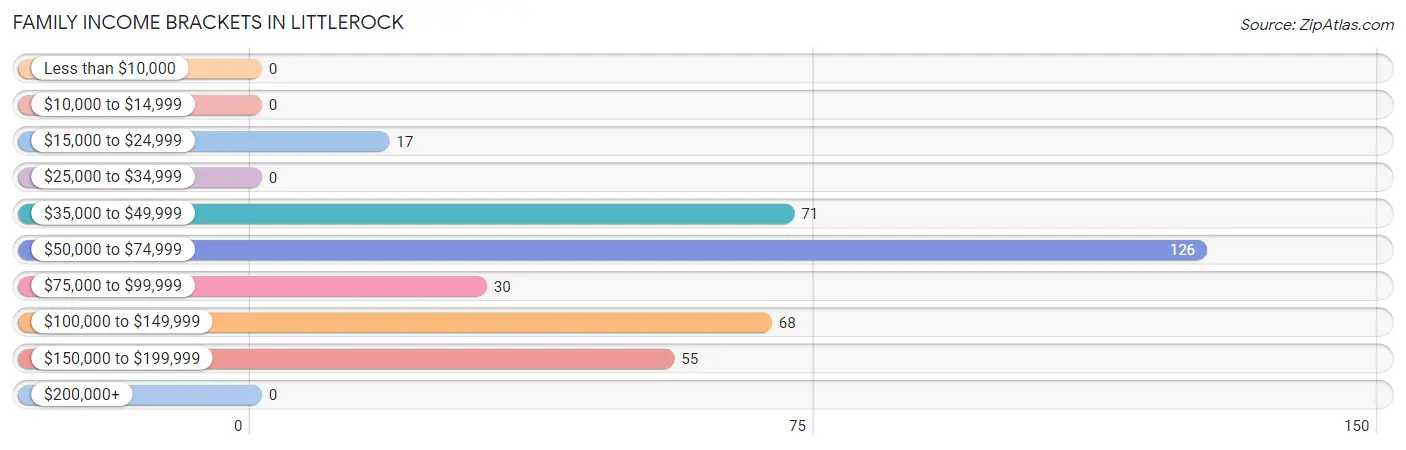
| Income Bracket | # Families | % Families |
| Less than $10,000 | 0 | 0.0% |
| $10,000 to $14,999 | 0 | 0.0% |
| $15,000 to $24,999 | 17 | 4.6% |
| $25,000 to $34,999 | 0 | 0.0% |
| $35,000 to $49,999 | 71 | 19.3% |
| $50,000 to $74,999 | 126 | 34.3% |
| $75,000 to $99,999 | 30 | 8.2% |
| $100,000 to $149,999 | 68 | 18.5% |
| $150,000 to $199,999 | 55 | 15.0% |
| $200,000+ | 0 | 0.0% |
Family Income by Famaliy Size in Littlerock
2-person families (138 | 37.6%) account for the highest median family income in Littlerock with $90,500 per family, while 2-person families (138 | 37.6%) have the highest median income of $45,250 per family member.
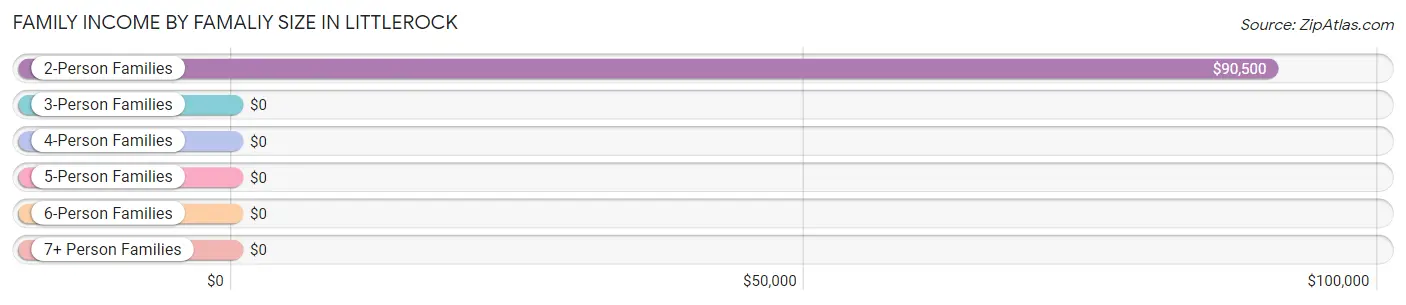
| Income Bracket | # Families | Median Income |
| 2-Person Families | 138 (37.6%) | $90,500 |
| 3-Person Families | 50 (13.6%) | $0 |
| 4-Person Families | 61 (16.6%) | $0 |
| 5-Person Families | 48 (13.1%) | $0 |
| 6-Person Families | 43 (11.7%) | $0 |
| 7+ Person Families | 27 (7.4%) | $0 |
| Total | 367 (100.0%) | $59,563 |
Family Income by Number of Earners in Littlerock
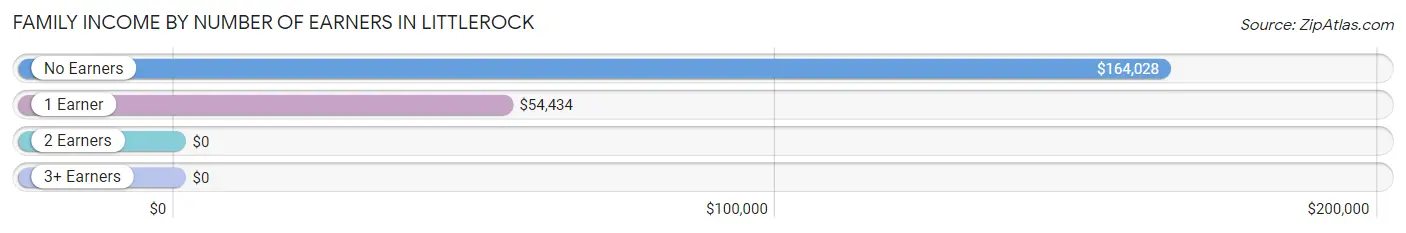
| Number of Earners | # Families | Median Income |
| No Earners | 37 (10.1%) | $164,028 |
| 1 Earner | 163 (44.4%) | $54,434 |
| 2 Earners | 139 (37.9%) | $0 |
| 3+ Earners | 28 (7.6%) | $0 |
| Total | 367 (100.0%) | $59,563 |
Household Income in Littlerock
Household Income Brackets in Littlerock
With 126 households falling in the category, the $50,000 to $74,999 income range is the most frequent in Littlerock, accounting for 33.3% of all households.
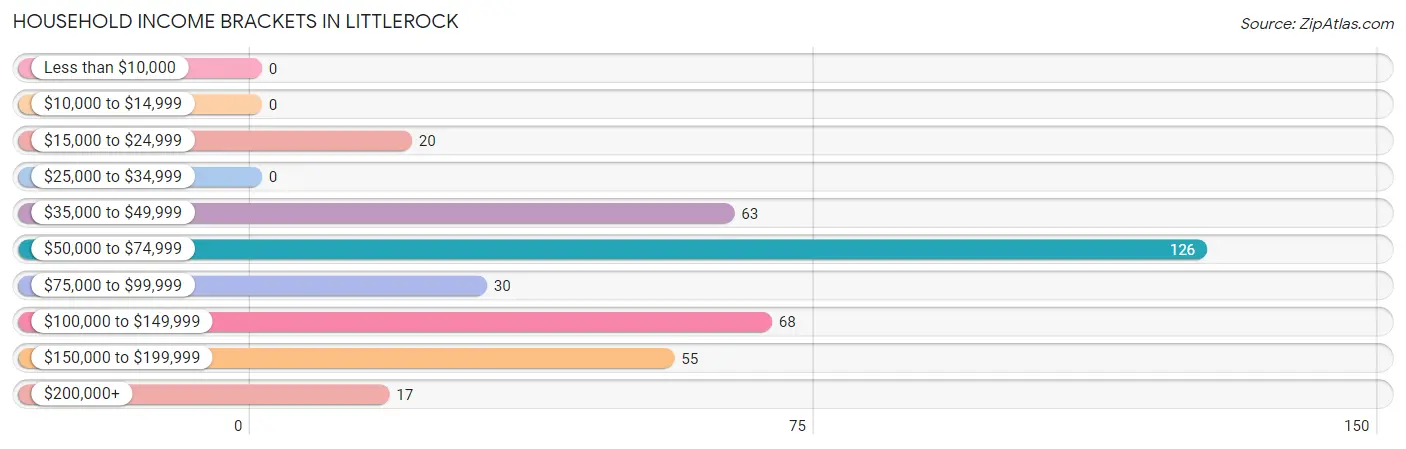
| Income Bracket | # Households | % Households |
| Less than $10,000 | 0 | 0.0% |
| $10,000 to $14,999 | 0 | 0.0% |
| $15,000 to $24,999 | 20 | 5.3% |
| $25,000 to $34,999 | 0 | 0.0% |
| $35,000 to $49,999 | 63 | 16.6% |
| $50,000 to $74,999 | 126 | 33.2% |
| $75,000 to $99,999 | 30 | 7.9% |
| $100,000 to $149,999 | 68 | 17.9% |
| $150,000 to $199,999 | 55 | 14.5% |
| $200,000+ | 17 | 4.5% |
Household Income by Householder Age in Littlerock
The median household income in Littlerock is $68,194, with the highest median household income of $68,565 found in the 25 to 44 years age bracket for the primary householder. A total of 87 households (23.0%) fall into this category.
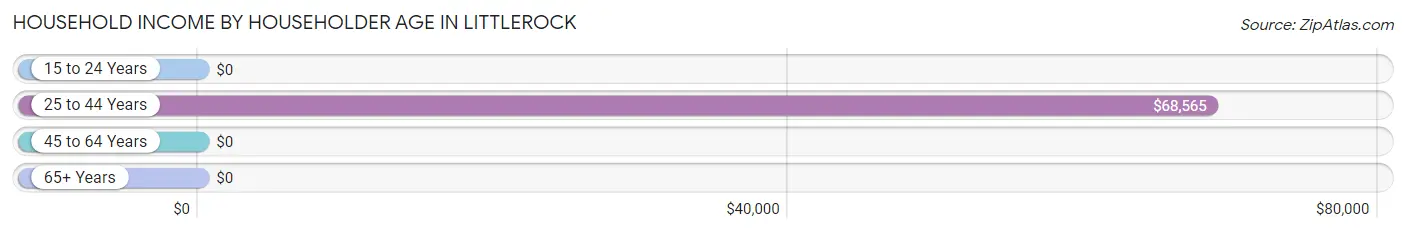
| Income Bracket | # Households | Median Income |
| 15 to 24 Years | 0 (0.0%) | $0 |
| 25 to 44 Years | 87 (23.0%) | $68,565 |
| 45 to 64 Years | 253 (66.7%) | $0 |
| 65+ Years | 39 (10.3%) | $0 |
| Total | 379 (100.0%) | $68,194 |
Poverty in Littlerock
Income Below Poverty by Sex and Age in Littlerock
With 4.8% poverty level for males and 2.4% for females among the residents of Littlerock, under 5 year old males and 18 to 24 year old females are the most vulnerable to poverty, with 20 males (20.2%) and 18 females (14.1%) in their respective age groups living below the poverty level.
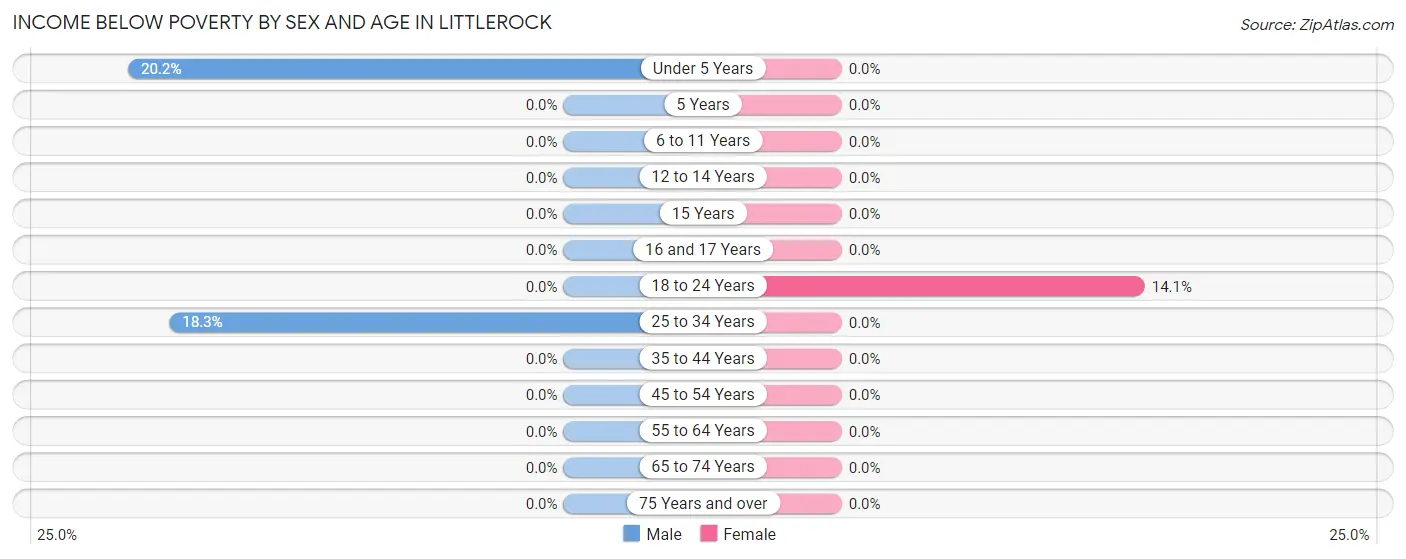
| Age Bracket | Male | Female |
| Under 5 Years | 20 (20.2%) | 0 (0.0%) |
| 5 Years | 0 (0.0%) | 0 (0.0%) |
| 6 to 11 Years | 0 (0.0%) | 0 (0.0%) |
| 12 to 14 Years | 0 (0.0%) | 0 (0.0%) |
| 15 Years | 0 (0.0%) | 0 (0.0%) |
| 16 and 17 Years | 0 (0.0%) | 0 (0.0%) |
| 18 to 24 Years | 0 (0.0%) | 18 (14.1%) |
| 25 to 34 Years | 17 (18.3%) | 0 (0.0%) |
| 35 to 44 Years | 0 (0.0%) | 0 (0.0%) |
| 45 to 54 Years | 0 (0.0%) | 0 (0.0%) |
| 55 to 64 Years | 0 (0.0%) | 0 (0.0%) |
| 65 to 74 Years | 0 (0.0%) | 0 (0.0%) |
| 75 Years and over | 0 (0.0%) | 0 (0.0%) |
| Total | 37 (4.8%) | 18 (2.4%) |
Income Above Poverty by Sex and Age in Littlerock
According to the poverty statistics in Littlerock, males aged 6 to 11 years and females aged under 5 years are the age groups that are most secure financially, with 100.0% of males and 100.0% of females in these age groups living above the poverty line.
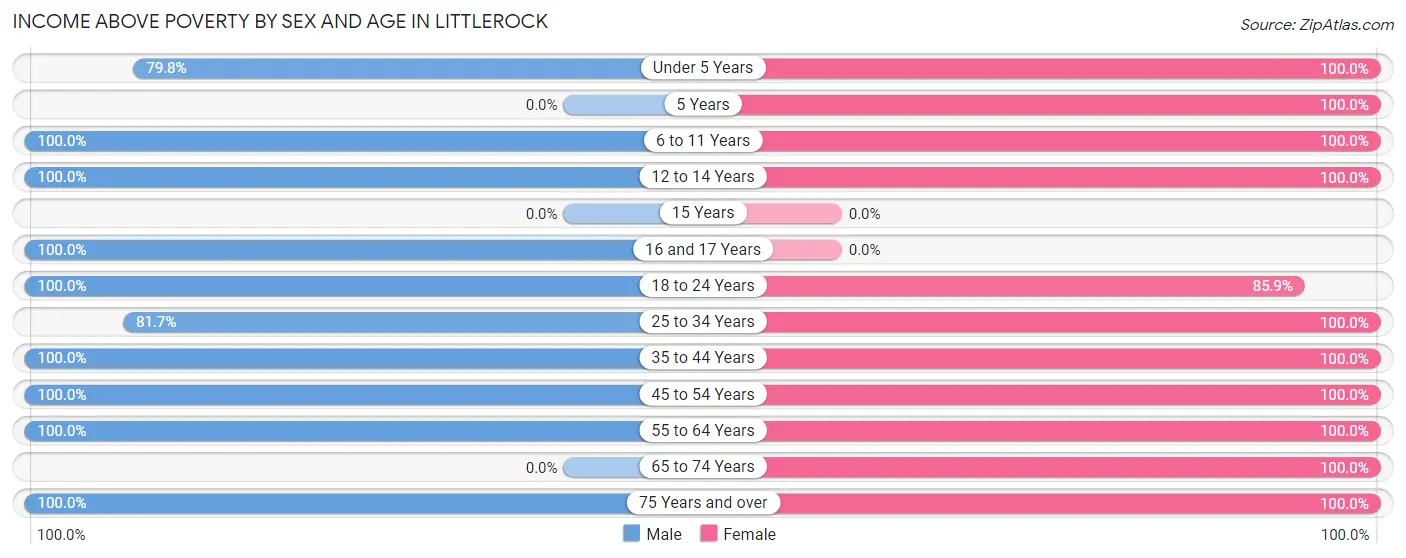
| Age Bracket | Male | Female |
| Under 5 Years | 79 (79.8%) | 30 (100.0%) |
| 5 Years | 0 (0.0%) | 62 (100.0%) |
| 6 to 11 Years | 14 (100.0%) | 112 (100.0%) |
| 12 to 14 Years | 95 (100.0%) | 34 (100.0%) |
| 15 Years | 0 (0.0%) | 0 (0.0%) |
| 16 and 17 Years | 45 (100.0%) | 0 (0.0%) |
| 18 to 24 Years | 124 (100.0%) | 110 (85.9%) |
| 25 to 34 Years | 76 (81.7%) | 47 (100.0%) |
| 35 to 44 Years | 15 (100.0%) | 62 (100.0%) |
| 45 to 54 Years | 115 (100.0%) | 133 (100.0%) |
| 55 to 64 Years | 136 (100.0%) | 95 (100.0%) |
| 65 to 74 Years | 0 (0.0%) | 30 (100.0%) |
| 75 Years and over | 31 (100.0%) | 9 (100.0%) |
| Total | 730 (95.2%) | 724 (97.6%) |
Income Below Poverty Among Married-Couple Families in Littlerock
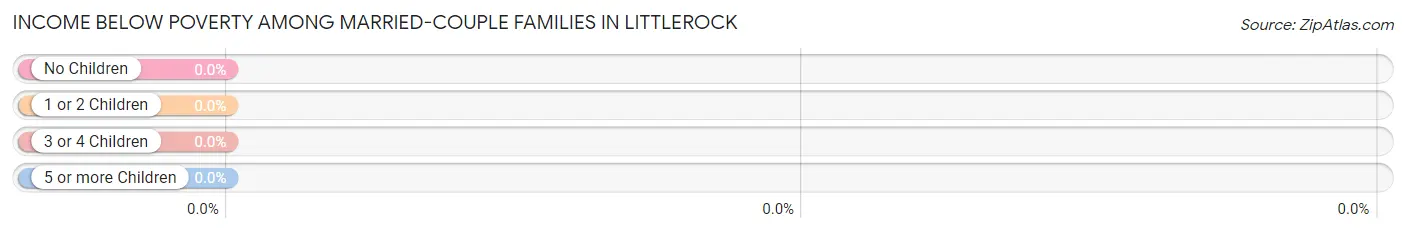
| Children | Above Poverty | Below Poverty |
| No Children | 83 (100.0%) | 0 (0.0%) |
| 1 or 2 Children | 10 (100.0%) | 0 (0.0%) |
| 3 or 4 Children | 90 (100.0%) | 0 (0.0%) |
| 5 or more Children | 0 (0.0%) | 0 (0.0%) |
| Total | 183 (100.0%) | 0 (0.0%) |
Income Below Poverty Among Single-Parent Households in Littlerock
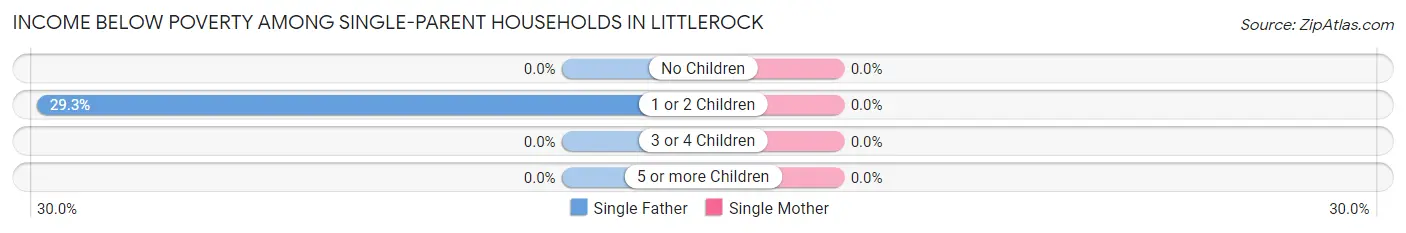
| Children | Single Father | Single Mother |
| No Children | 0 (0.0%) | 0 (0.0%) |
| 1 or 2 Children | 17 (29.3%) | 0 (0.0%) |
| 3 or 4 Children | 0 (0.0%) | 0 (0.0%) |
| 5 or more Children | 0 (0.0%) | 0 (0.0%) |
| Total | 17 (29.3%) | 0 (0.0%) |
Income Below Poverty Among Married-Couple vs Single-Parent Households in Littlerock
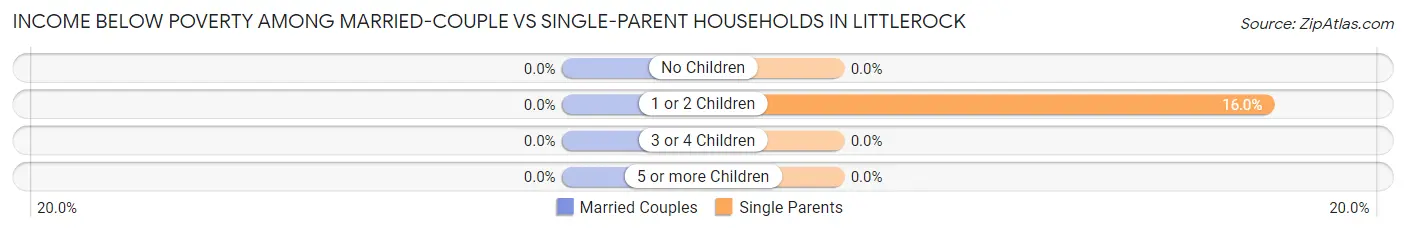
| Children | Married-Couple Families | Single-Parent Households |
| No Children | 0 (0.0%) | 0 (0.0%) |
| 1 or 2 Children | 0 (0.0%) | 17 (16.0%) |
| 3 or 4 Children | 0 (0.0%) | 0 (0.0%) |
| 5 or more Children | 0 (0.0%) | 0 (0.0%) |
| Total | 0 (0.0%) | 17 (9.2%) |
Race in Littlerock
The most populous races in Littlerock are Hispanic or Latino (1,204 | 79.8%), Some other Race (734 | 48.6%), and White / Caucasian (536 | 35.5%).
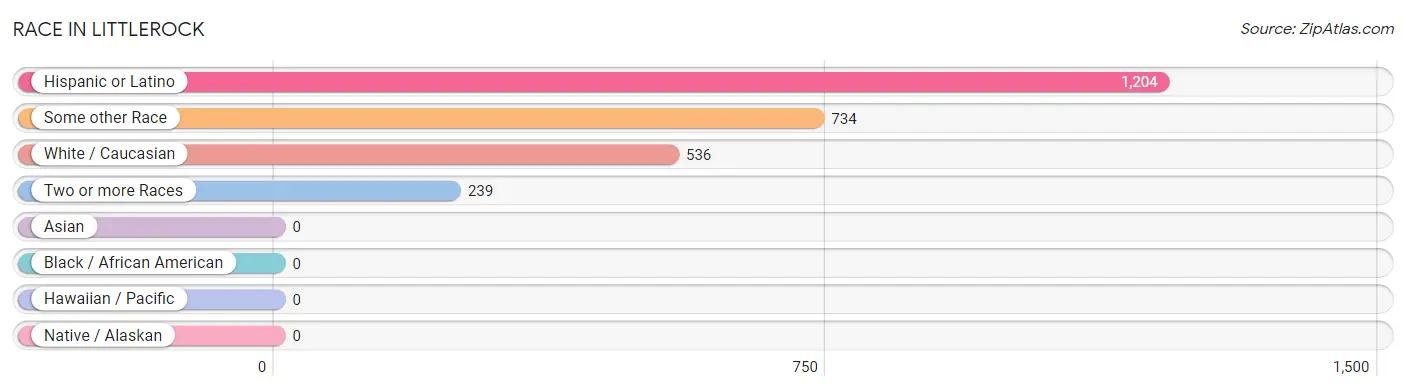
| Race | # Population | % Population |
| Asian | 0 | 0.0% |
| Black / African American | 0 | 0.0% |
| Hawaiian / Pacific | 0 | 0.0% |
| Hispanic or Latino | 1,204 | 79.8% |
| Native / Alaskan | 0 | 0.0% |
| White / Caucasian | 536 | 35.5% |
| Two or more Races | 239 | 15.8% |
| Some other Race | 734 | 48.6% |
| Total | 1,509 | 100.0% |
Ancestry in Littlerock
The most populous ancestries reported in Littlerock are Mexican (1,204 | 79.8%), German (68 | 4.5%), Irish (48 | 3.2%), American (24 | 1.6%), and Dutch (20 | 1.3%), together accounting for 90.4% of all Littlerock residents.
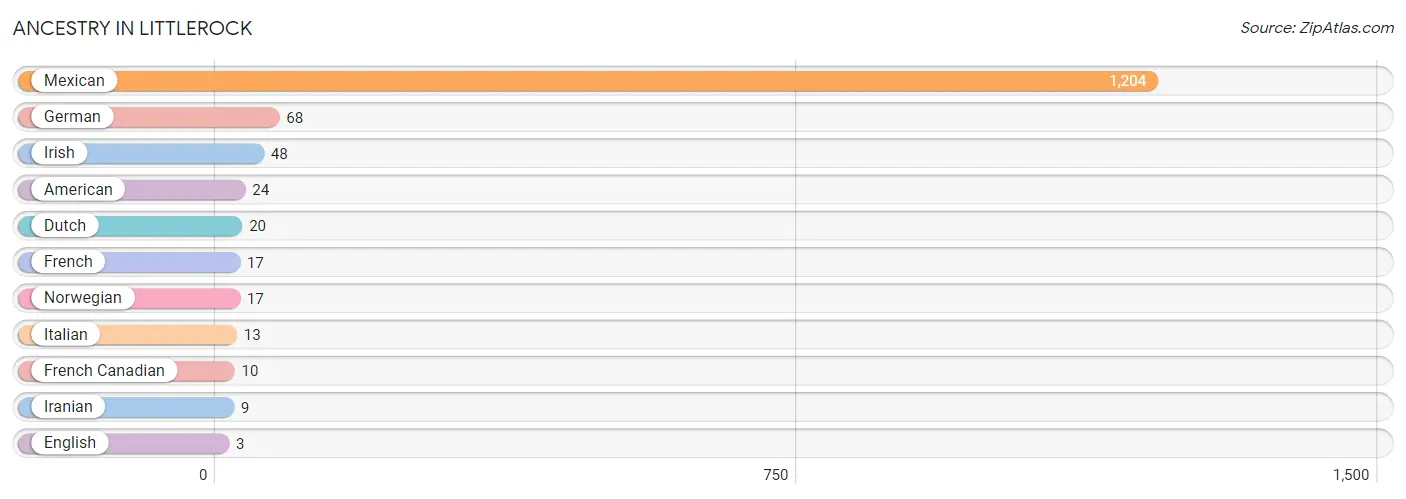
| Ancestry | # Population | % Population |
| American | 24 | 1.6% |
| Dutch | 20 | 1.3% |
| English | 3 | 0.2% |
| French | 17 | 1.1% |
| French Canadian | 10 | 0.7% |
| German | 68 | 4.5% |
| Iranian | 9 | 0.6% |
| Irish | 48 | 3.2% |
| Italian | 13 | 0.9% |
| Mexican | 1,204 | 79.8% |
| Norwegian | 17 | 1.1% | View All 11 Rows |
Immigrants in Littlerock
The most numerous immigrant groups reported in Littlerock came from Central America (271 | 18.0%), Latin America (271 | 18.0%), Mexico (271 | 18.0%), Canada (10 | 0.7%), and Asia (9 | 0.6%), together accounting for 55.1% of all Littlerock residents.
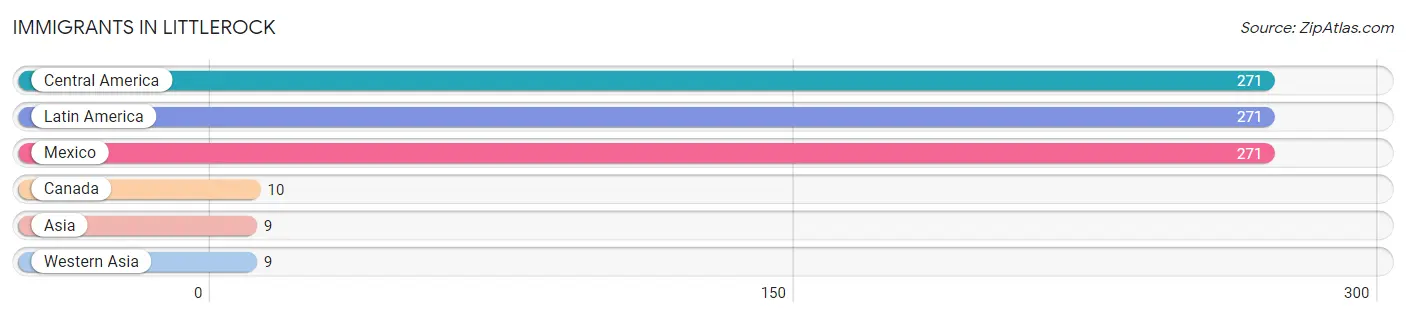
| Immigration Origin | # Population | % Population |
| Asia | 9 | 0.6% |
| Canada | 10 | 0.7% |
| Central America | 271 | 18.0% |
| Latin America | 271 | 18.0% |
| Mexico | 271 | 18.0% |
| Western Asia | 9 | 0.6% | View All 6 Rows |
Sex and Age in Littlerock
Sex and Age in Littlerock
The most populous age groups in Littlerock are 20 to 24 Years (124 | 16.2%) for men and 5 to 9 Years (174 | 23.4%) for women.
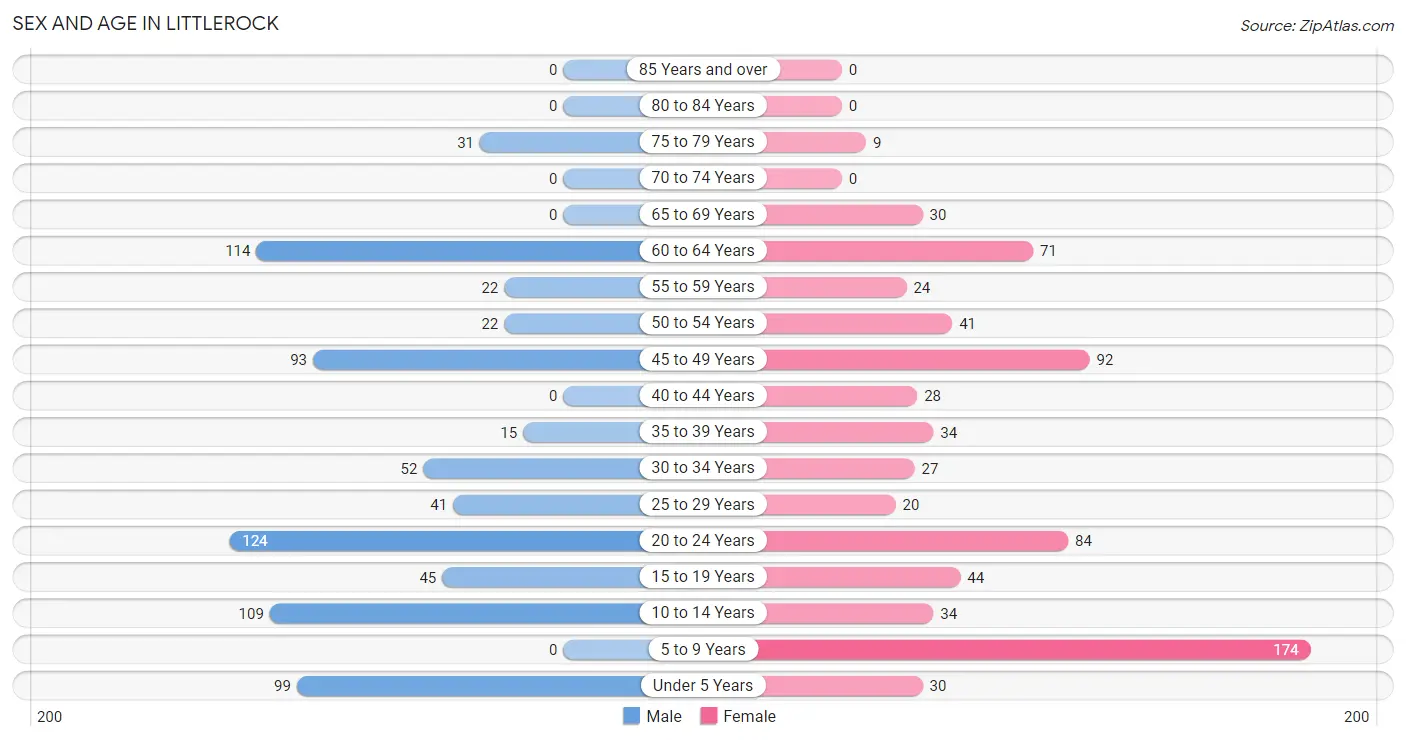
| Age Bracket | Male | Female |
| Under 5 Years | 99 (12.9%) | 30 (4.0%) |
| 5 to 9 Years | 0 (0.0%) | 174 (23.4%) |
| 10 to 14 Years | 109 (14.2%) | 34 (4.6%) |
| 15 to 19 Years | 45 (5.9%) | 44 (5.9%) |
| 20 to 24 Years | 124 (16.2%) | 84 (11.3%) |
| 25 to 29 Years | 41 (5.3%) | 20 (2.7%) |
| 30 to 34 Years | 52 (6.8%) | 27 (3.6%) |
| 35 to 39 Years | 15 (2.0%) | 34 (4.6%) |
| 40 to 44 Years | 0 (0.0%) | 28 (3.8%) |
| 45 to 49 Years | 93 (12.1%) | 92 (12.4%) |
| 50 to 54 Years | 22 (2.9%) | 41 (5.5%) |
| 55 to 59 Years | 22 (2.9%) | 24 (3.2%) |
| 60 to 64 Years | 114 (14.9%) | 71 (9.6%) |
| 65 to 69 Years | 0 (0.0%) | 30 (4.0%) |
| 70 to 74 Years | 0 (0.0%) | 0 (0.0%) |
| 75 to 79 Years | 31 (4.0%) | 9 (1.2%) |
| 80 to 84 Years | 0 (0.0%) | 0 (0.0%) |
| 85 Years and over | 0 (0.0%) | 0 (0.0%) |
| Total | 767 (100.0%) | 742 (100.0%) |
Families and Households in Littlerock
Median Family Size in Littlerock
The median family size in Littlerock is 3.85 persons per family, with married-couple families (183 | 49.9%) accounting for the largest median family size of 3.9 persons per family. On the other hand, single male/father families (58 | 15.8%) represent the smallest median family size with 3.60 persons per family.
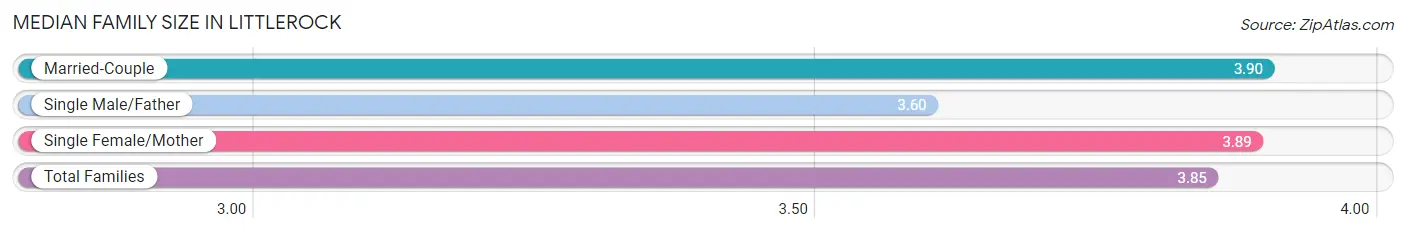
| Family Type | # Families | Family Size |
| Married-Couple | 183 (49.9%) | 3.90 |
| Single Male/Father | 58 (15.8%) | 3.60 |
| Single Female/Mother | 126 (34.3%) | 3.89 |
| Total Families | 367 (100.0%) | 3.85 |
Median Household Size in Littlerock
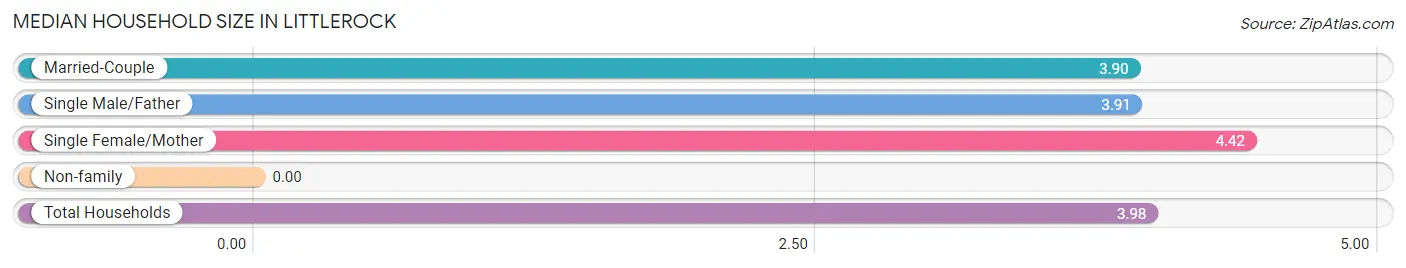
| Household Type | # Households | Household Size |
| Married-Couple | 183 (48.3%) | 3.90 |
| Single Male/Father | 58 (15.3%) | 3.91 |
| Single Female/Mother | 126 (33.3%) | 4.42 |
| Non-family | 12 (3.2%) | - |
| Total Households | 379 (100.0%) | 3.98 |
Household Size by Marriage Status in Littlerock
Out of a total of 379 households in Littlerock, 367 (96.8%) are family households, while 12 (3.2%) are nonfamily households. The most numerous type of family households are 2-person households, comprising 104, and the most common type of nonfamily households are 1-person households, comprising 12.
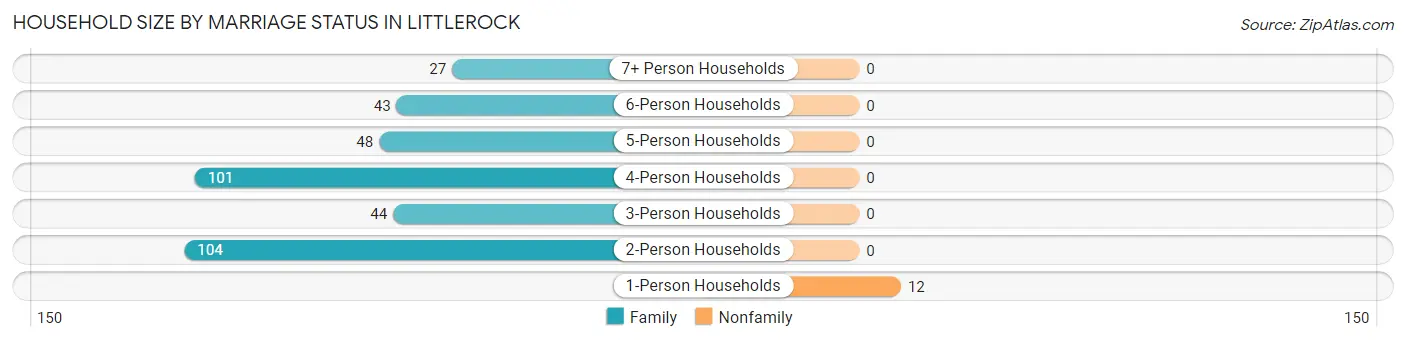
| Household Size | Family Households | Nonfamily Households |
| 1-Person Households | - | 12 (3.2%) |
| 2-Person Households | 104 (27.4%) | 0 (0.0%) |
| 3-Person Households | 44 (11.6%) | 0 (0.0%) |
| 4-Person Households | 101 (26.7%) | 0 (0.0%) |
| 5-Person Households | 48 (12.7%) | 0 (0.0%) |
| 6-Person Households | 43 (11.4%) | 0 (0.0%) |
| 7+ Person Households | 27 (7.1%) | 0 (0.0%) |
| Total | 367 (96.8%) | 12 (3.2%) |
Female Fertility in Littlerock
Fertility by Age in Littlerock
Average fertility rate in Littlerock is 30.0 births per 1,000 women. Women in the age bracket of 35 to 50 years have the highest fertility rate with 65.0 births per 1,000 women. Women in the age bracket of 35 to 50 years acount for 100.0% of all women with births.
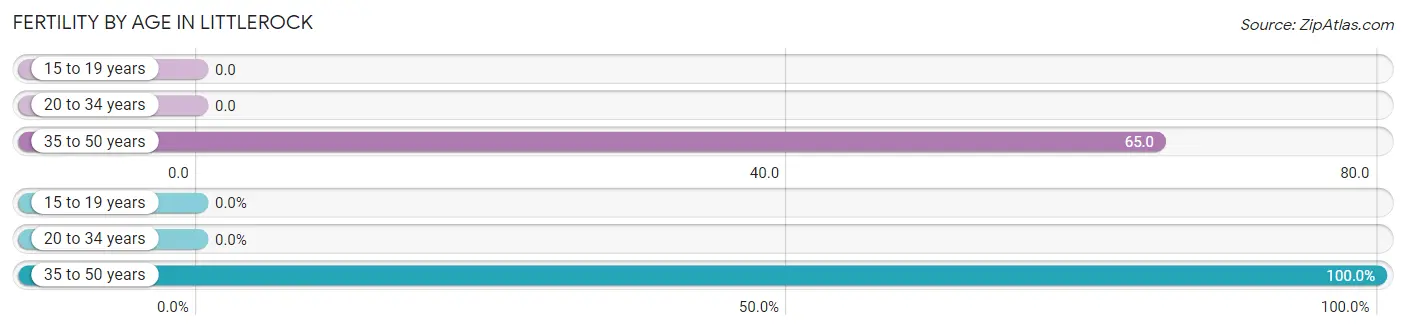
| Age Bracket | Women with Births | Births / 1,000 Women |
| 15 to 19 years | 0 (0.0%) | 0.0 |
| 20 to 34 years | 0 (0.0%) | 0.0 |
| 35 to 50 years | 10 (100.0%) | 65.0 |
| Total | 10 (100.0%) | 30.0 |
Fertility by Age by Marriage Status in Littlerock
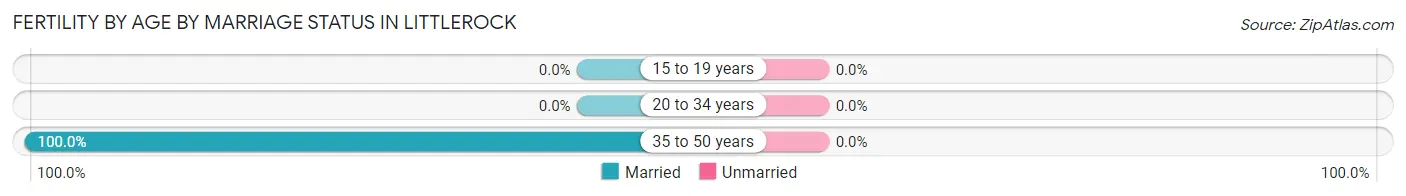
| Age Bracket | Married | Unmarried |
| 15 to 19 years | 0 (0.0%) | 0 (0.0%) |
| 20 to 34 years | 0 (0.0%) | 0 (0.0%) |
| 35 to 50 years | 10 (100.0%) | 0 (0.0%) |
| Total | 10 (100.0%) | 0 (0.0%) |
Fertility by Education in Littlerock
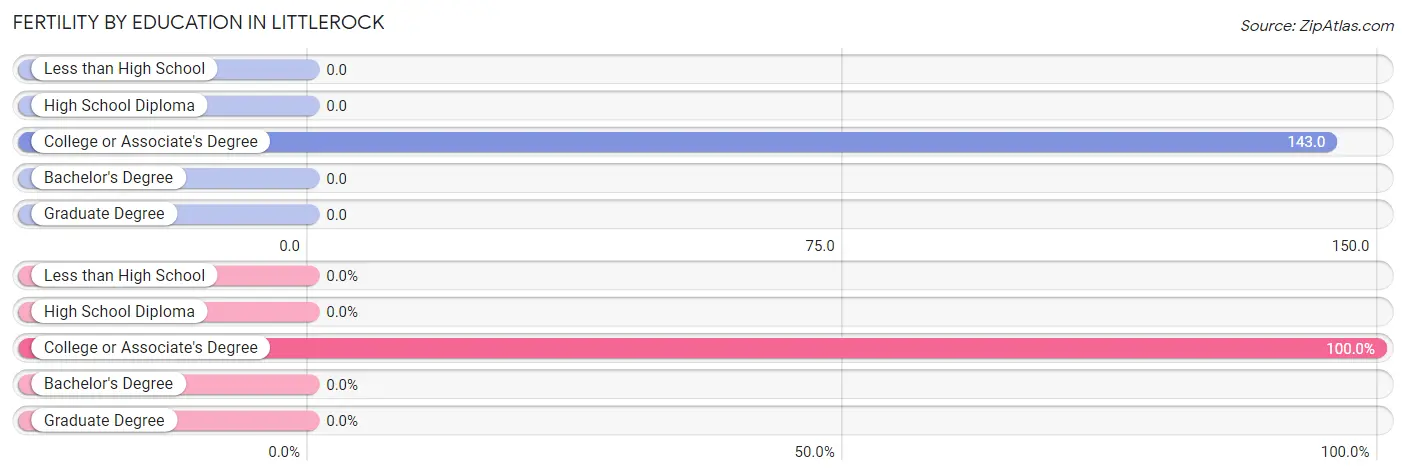
| Educational Attainment | Women with Births | Births / 1,000 Women |
| Less than High School | 0 (0.0%) | 0.0 |
| High School Diploma | 0 (0.0%) | 0.0 |
| College or Associate's Degree | 10 (100.0%) | 143.0 |
| Bachelor's Degree | 0 (0.0%) | 0.0 |
| Graduate Degree | 0 (0.0%) | 0.0 |
| Total | 10 (100.0%) | 30.0 |
Fertility by Education by Marriage Status in Littlerock
| Educational Attainment | Married | Unmarried |
| Less than High School | 0 (0.0%) | 0 (0.0%) |
| High School Diploma | 0 (0.0%) | 0 (0.0%) |
| College or Associate's Degree | 10 (100.0%) | 0 (0.0%) |
| Bachelor's Degree | 0 (0.0%) | 0 (0.0%) |
| Graduate Degree | 0 (0.0%) | 0 (0.0%) |
| Total | 10 (100.0%) | 0 (0.0%) |
Employment Characteristics in Littlerock
Employment by Class of Employer in Littlerock
Among the 595 employed individuals in Littlerock, private company employees (410 | 68.9%), self-employed (not incorporated) (78 | 13.1%), and local government employees (67 | 11.3%) make up the most common classes of employment.
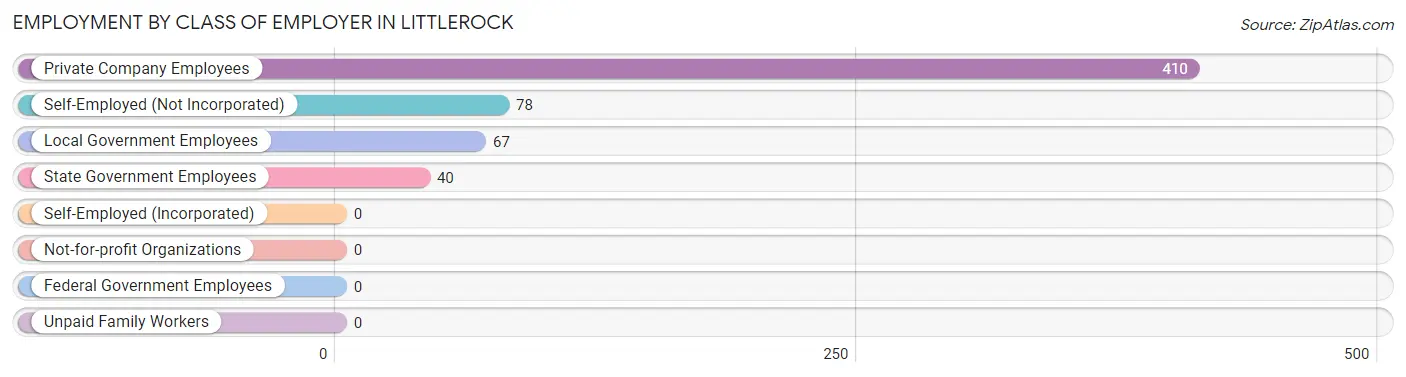
| Employer Class | # Employees | % Employees |
| Private Company Employees | 410 | 68.9% |
| Self-Employed (Incorporated) | 0 | 0.0% |
| Self-Employed (Not Incorporated) | 78 | 13.1% |
| Not-for-profit Organizations | 0 | 0.0% |
| Local Government Employees | 67 | 11.3% |
| State Government Employees | 40 | 6.7% |
| Federal Government Employees | 0 | 0.0% |
| Unpaid Family Workers | 0 | 0.0% |
| Total | 595 | 100.0% |
Employment Status by Age in Littlerock
According to the labor force statistics for Littlerock, out of the total population over 16 years of age (1,063), 63.9% or 679 individuals are in the labor force, with 7.5% or 51 of them unemployed. The age group with the highest labor force participation rate is 20 to 24 years, with 100.0% or 208 individuals in the labor force. Within the labor force, the 20 to 24 years age range has the highest percentage of unemployed individuals, with 24.5% or 51 of them being unemployed.
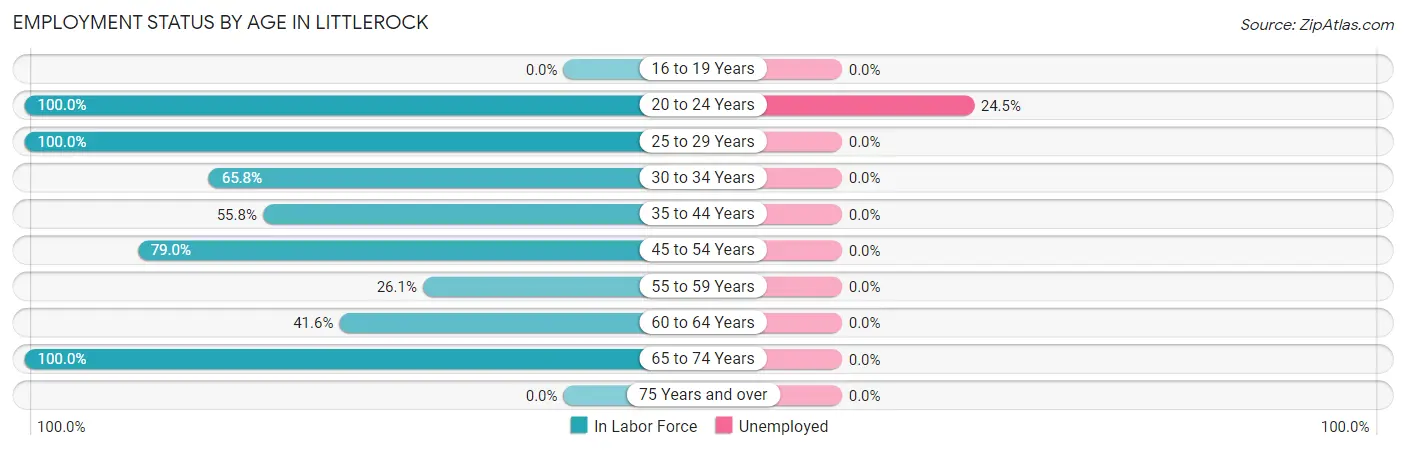
| Age Bracket | In Labor Force | Unemployed |
| 16 to 19 Years | 0 (0.0%) | 0 (0.0%) |
| 20 to 24 Years | 208 (100.0%) | 51 (24.5%) |
| 25 to 29 Years | 61 (100.0%) | 0 (0.0%) |
| 30 to 34 Years | 52 (65.8%) | 0 (0.0%) |
| 35 to 44 Years | 43 (55.8%) | 0 (0.0%) |
| 45 to 54 Years | 196 (79.0%) | 0 (0.0%) |
| 55 to 59 Years | 12 (26.1%) | 0 (0.0%) |
| 60 to 64 Years | 77 (41.6%) | 0 (0.0%) |
| 65 to 74 Years | 30 (100.0%) | 0 (0.0%) |
| 75 Years and over | 0 (0.0%) | 0 (0.0%) |
| Total | 679 (63.9%) | 51 (7.5%) |
Employment Status by Educational Attainment in Littlerock
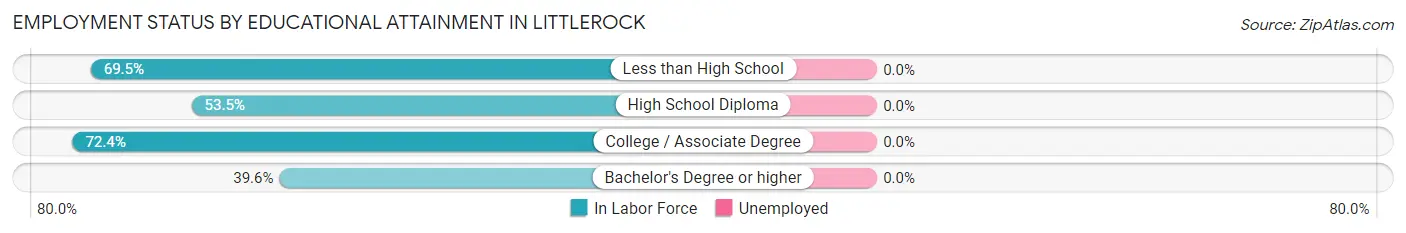
| Educational Attainment | In Labor Force | Unemployed |
| Less than High School | 121 (69.5%) | 0 (0.0%) |
| High School Diploma | 115 (53.5%) | 0 (0.0%) |
| College / Associate Degree | 184 (72.4%) | 0 (0.0%) |
| Bachelor's Degree or higher | 21 (39.6%) | 0 (0.0%) |
| Total | 441 (63.4%) | 0 (0.0%) |
Employment Occupations by Sex in Littlerock
Management, Business, Science and Arts Occupations
The most common Management, Business, Science and Arts occupations in Littlerock are Management (73 | 11.6%), Community & Social Service (51 | 8.1%), and Education Instruction & Library (51 | 8.1%).
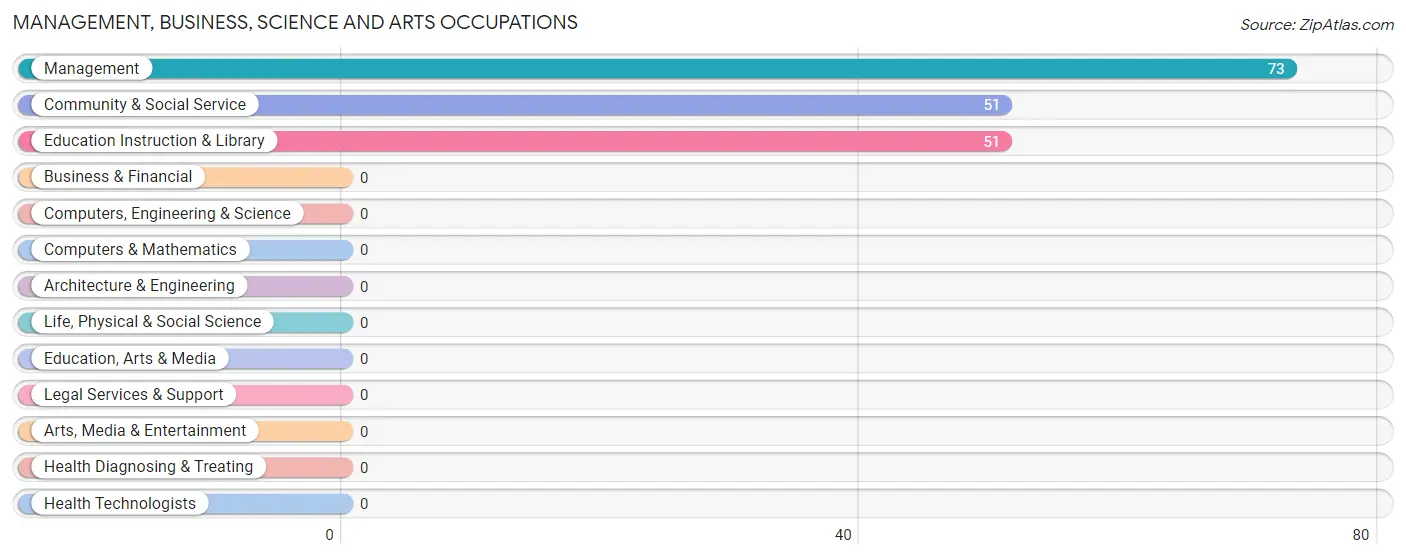
Management, Business, Science and Arts Occupations by Sex
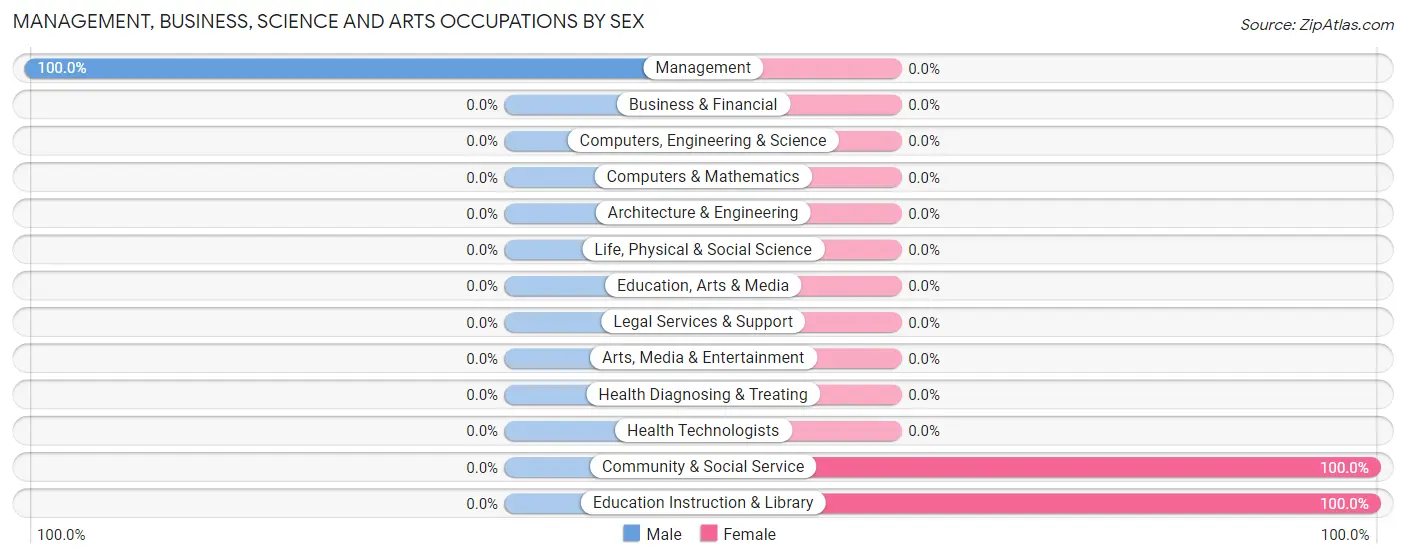
| Occupation | Male | Female |
| Management | 73 (100.0%) | 0 (0.0%) |
| Business & Financial | 0 (0.0%) | 0 (0.0%) |
| Computers, Engineering & Science | 0 (0.0%) | 0 (0.0%) |
| Computers & Mathematics | 0 (0.0%) | 0 (0.0%) |
| Architecture & Engineering | 0 (0.0%) | 0 (0.0%) |
| Life, Physical & Social Science | 0 (0.0%) | 0 (0.0%) |
| Community & Social Service | 0 (0.0%) | 51 (100.0%) |
| Education, Arts & Media | 0 (0.0%) | 0 (0.0%) |
| Legal Services & Support | 0 (0.0%) | 0 (0.0%) |
| Education Instruction & Library | 0 (0.0%) | 51 (100.0%) |
| Arts, Media & Entertainment | 0 (0.0%) | 0 (0.0%) |
| Health Diagnosing & Treating | 0 (0.0%) | 0 (0.0%) |
| Health Technologists | 0 (0.0%) | 0 (0.0%) |
| Total (Category) | 73 (58.9%) | 51 (41.1%) |
| Total (Overall) | 419 (66.7%) | 209 (33.3%) |
Services Occupations
The most common Services occupations in Littlerock are Healthcare Support (40 | 6.4%), Personal Care & Service (37 | 5.9%), and Food Preparation & Serving (24 | 3.8%).
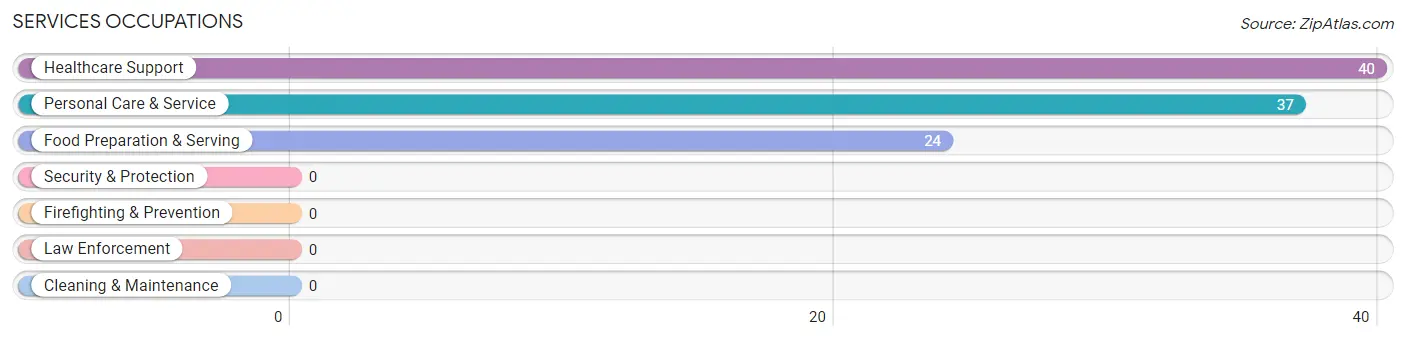
Services Occupations by Sex
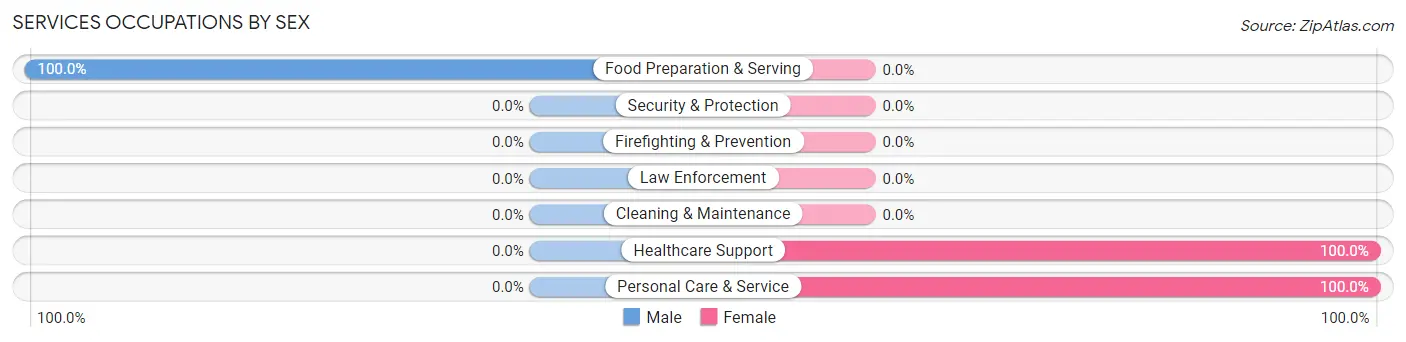
| Occupation | Male | Female |
| Healthcare Support | 0 (0.0%) | 40 (100.0%) |
| Security & Protection | 0 (0.0%) | 0 (0.0%) |
| Firefighting & Prevention | 0 (0.0%) | 0 (0.0%) |
| Law Enforcement | 0 (0.0%) | 0 (0.0%) |
| Food Preparation & Serving | 24 (100.0%) | 0 (0.0%) |
| Cleaning & Maintenance | 0 (0.0%) | 0 (0.0%) |
| Personal Care & Service | 0 (0.0%) | 37 (100.0%) |
| Total (Category) | 24 (23.8%) | 77 (76.2%) |
| Total (Overall) | 419 (66.7%) | 209 (33.3%) |
Sales and Office Occupations
The most common Sales and Office occupations in Littlerock are Sales & Related (69 | 11.0%), and Office & Administration (53 | 8.4%).
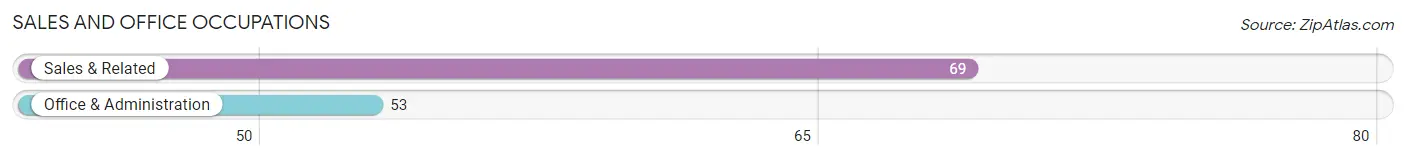
Sales and Office Occupations by Sex

| Occupation | Male | Female |
| Sales & Related | 69 (100.0%) | 0 (0.0%) |
| Office & Administration | 0 (0.0%) | 53 (100.0%) |
| Total (Category) | 69 (56.6%) | 53 (43.4%) |
| Total (Overall) | 419 (66.7%) | 209 (33.3%) |
Natural Resources, Construction and Maintenance Occupations
The most common Natural Resources, Construction and Maintenance occupations in Littlerock are Construction & Extraction (130 | 20.7%), Installation, Maintenance & Repair (15 | 2.4%), and Farming, Fishing & Forestry (3 | 0.5%).
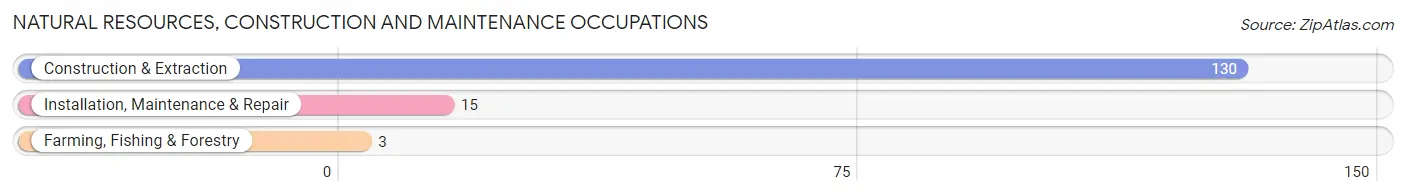
Natural Resources, Construction and Maintenance Occupations by Sex
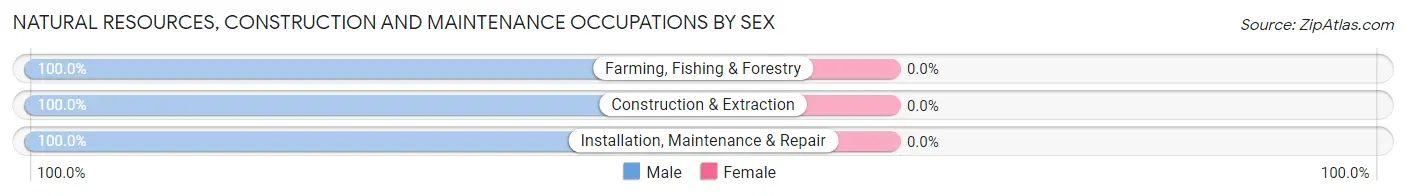
| Occupation | Male | Female |
| Farming, Fishing & Forestry | 3 (100.0%) | 0 (0.0%) |
| Construction & Extraction | 130 (100.0%) | 0 (0.0%) |
| Installation, Maintenance & Repair | 15 (100.0%) | 0 (0.0%) |
| Total (Category) | 148 (100.0%) | 0 (0.0%) |
| Total (Overall) | 419 (66.7%) | 209 (33.3%) |
Production, Transportation and Moving Occupations
The most common Production, Transportation and Moving occupations in Littlerock are Production (92 | 14.6%), and Transportation (41 | 6.5%).
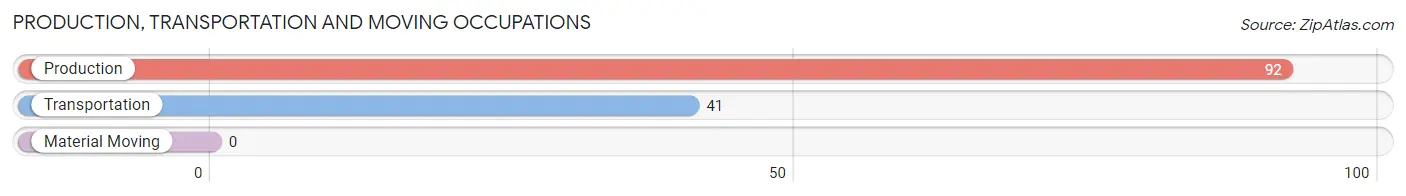
Production, Transportation and Moving Occupations by Sex
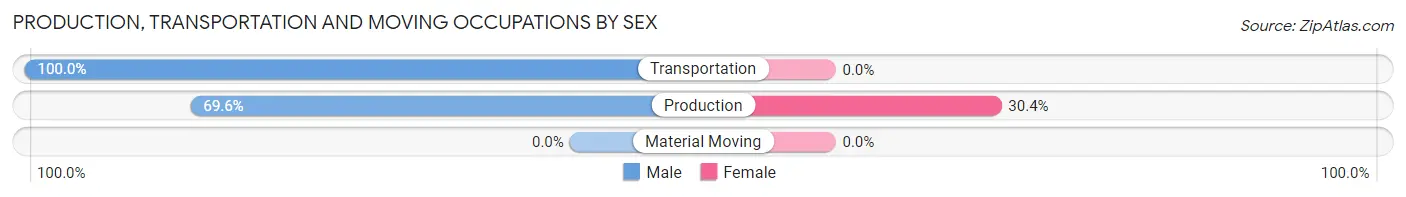
| Occupation | Male | Female |
| Production | 64 (69.6%) | 28 (30.4%) |
| Transportation | 41 (100.0%) | 0 (0.0%) |
| Material Moving | 0 (0.0%) | 0 (0.0%) |
| Total (Category) | 105 (78.9%) | 28 (21.0%) |
| Total (Overall) | 419 (66.7%) | 209 (33.3%) |
Employment Industries by Sex in Littlerock
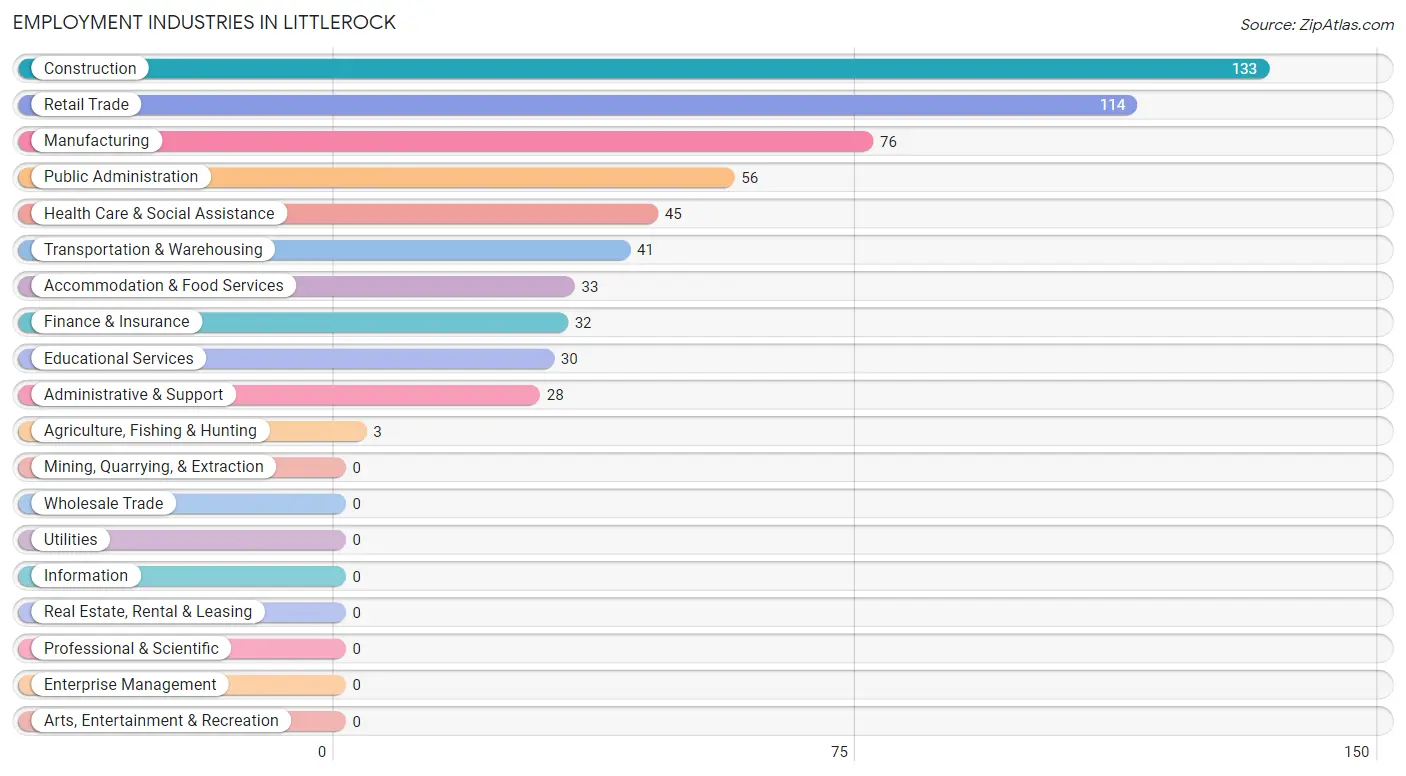
Employment Industries in Littlerock
The major employment industries in Littlerock include Construction (133 | 21.2%), Retail Trade (114 | 18.1%), Manufacturing (76 | 12.1%), Public Administration (56 | 8.9%), and Health Care & Social Assistance (45 | 7.2%).
Employment Industries by Sex in Littlerock
The Littlerock industries that see more men than women are Agriculture, Fishing & Hunting (100.0%), Construction (100.0%), and Retail Trade (100.0%), whereas the industries that tend to have a higher number of women are Educational Services (100.0%), Accommodation & Food Services (100.0%), and Public Administration (71.4%).
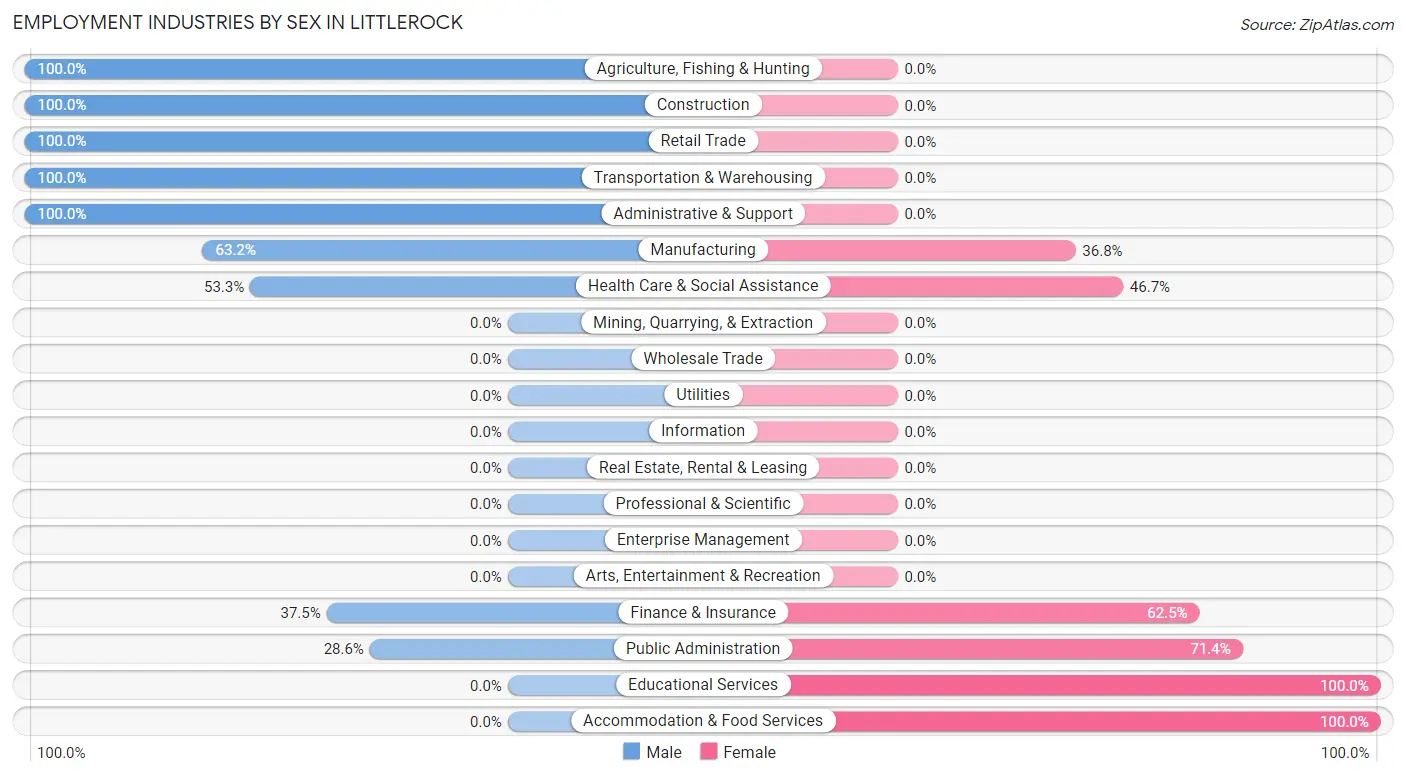
| Industry | Male | Female |
| Agriculture, Fishing & Hunting | 3 (100.0%) | 0 (0.0%) |
| Mining, Quarrying, & Extraction | 0 (0.0%) | 0 (0.0%) |
| Construction | 133 (100.0%) | 0 (0.0%) |
| Manufacturing | 48 (63.2%) | 28 (36.8%) |
| Wholesale Trade | 0 (0.0%) | 0 (0.0%) |
| Retail Trade | 114 (100.0%) | 0 (0.0%) |
| Transportation & Warehousing | 41 (100.0%) | 0 (0.0%) |
| Utilities | 0 (0.0%) | 0 (0.0%) |
| Information | 0 (0.0%) | 0 (0.0%) |
| Finance & Insurance | 12 (37.5%) | 20 (62.5%) |
| Real Estate, Rental & Leasing | 0 (0.0%) | 0 (0.0%) |
| Professional & Scientific | 0 (0.0%) | 0 (0.0%) |
| Enterprise Management | 0 (0.0%) | 0 (0.0%) |
| Administrative & Support | 28 (100.0%) | 0 (0.0%) |
| Educational Services | 0 (0.0%) | 30 (100.0%) |
| Health Care & Social Assistance | 24 (53.3%) | 21 (46.7%) |
| Arts, Entertainment & Recreation | 0 (0.0%) | 0 (0.0%) |
| Accommodation & Food Services | 0 (0.0%) | 33 (100.0%) |
| Public Administration | 16 (28.6%) | 40 (71.4%) |
| Total | 419 (66.7%) | 209 (33.3%) |
Education in Littlerock
School Enrollment in Littlerock
The most common levels of schooling among the 473 students in Littlerock are elementary school (174 | 36.8%), middle school (115 | 24.3%), and college / undergraduate (112 | 23.7%).
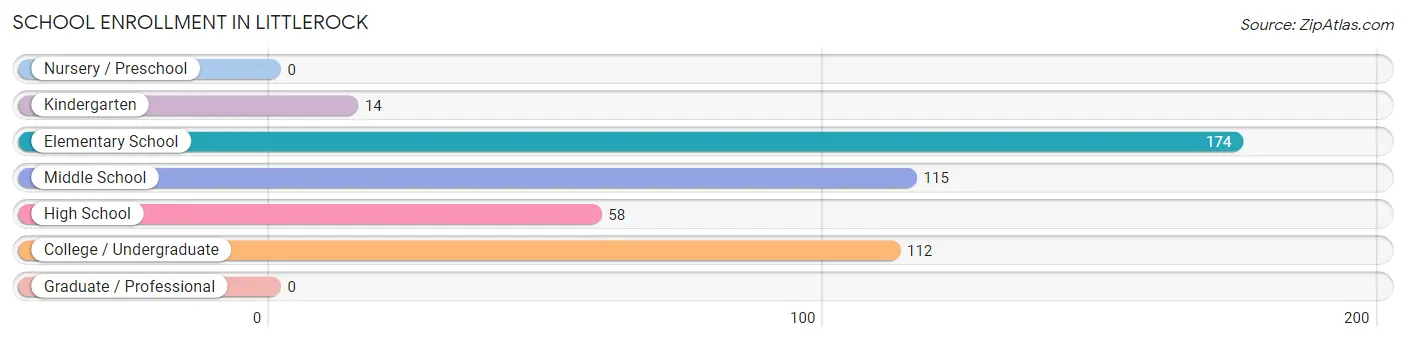
| School Level | # Students | % Students |
| Nursery / Preschool | 0 | 0.0% |
| Kindergarten | 14 | 3.0% |
| Elementary School | 174 | 36.8% |
| Middle School | 115 | 24.3% |
| High School | 58 | 12.3% |
| College / Undergraduate | 112 | 23.7% |
| Graduate / Professional | 0 | 0.0% |
| Total | 473 | 100.0% |
School Enrollment by Age by Funding Source in Littlerock
Out of a total of 473 students who are enrolled in schools in Littlerock, 34 (7.2%) attend a private institution, while the remaining 439 (92.8%) are enrolled in public schools. The age group of 25 to 34 year olds has the highest likelihood of being enrolled in private schools, with 20 (100.0% in the age bracket) enrolled. Conversely, the age group of 10 to 14 year olds has the lowest likelihood of being enrolled in a private school, with 143 (100.0% in the age bracket) attending a public institution.
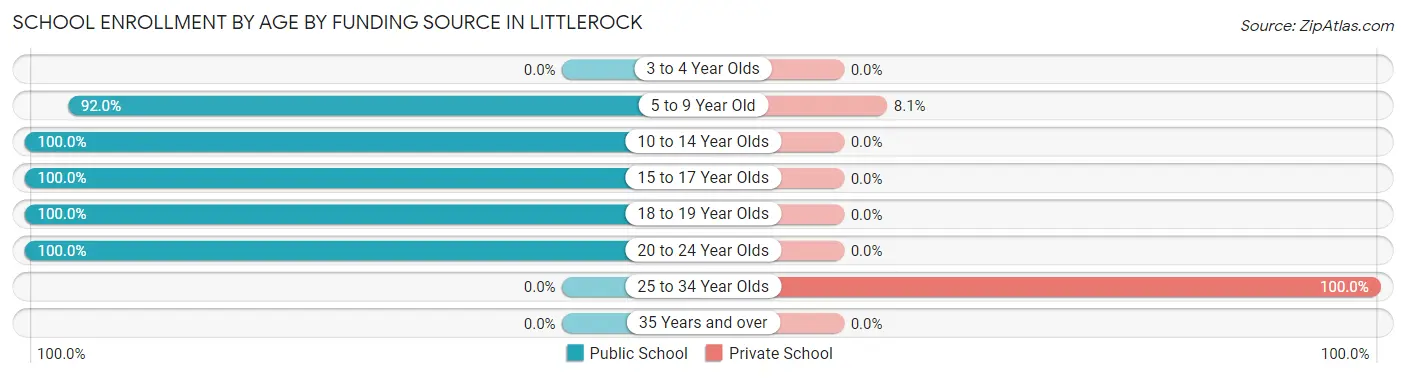
| Age Bracket | Public School | Private School |
| 3 to 4 Year Olds | 0 (0.0%) | 0 (0.0%) |
| 5 to 9 Year Old | 160 (91.9%) | 14 (8.1%) |
| 10 to 14 Year Olds | 143 (100.0%) | 0 (0.0%) |
| 15 to 17 Year Olds | 45 (100.0%) | 0 (0.0%) |
| 18 to 19 Year Olds | 44 (100.0%) | 0 (0.0%) |
| 20 to 24 Year Olds | 47 (100.0%) | 0 (0.0%) |
| 25 to 34 Year Olds | 0 (0.0%) | 20 (100.0%) |
| 35 Years and over | 0 (0.0%) | 0 (0.0%) |
| Total | 439 (92.8%) | 34 (7.2%) |
Educational Attainment by Field of Study in Littlerock
Social sciences (21 | 39.6%), engineering (17 | 32.1%), and business (15 | 28.3%) are the most common fields of study among 53 individuals in Littlerock who have obtained a bachelor's degree or higher.
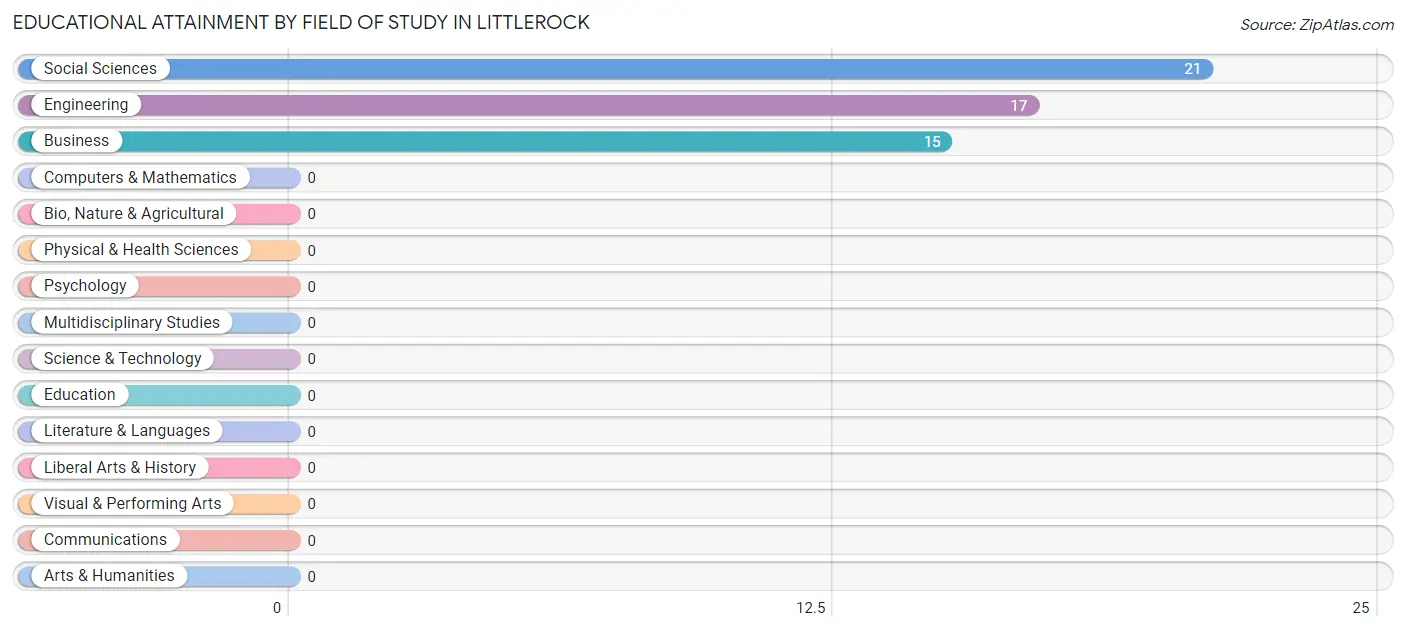
| Field of Study | # Graduates | % Graduates |
| Computers & Mathematics | 0 | 0.0% |
| Bio, Nature & Agricultural | 0 | 0.0% |
| Physical & Health Sciences | 0 | 0.0% |
| Psychology | 0 | 0.0% |
| Social Sciences | 21 | 39.6% |
| Engineering | 17 | 32.1% |
| Multidisciplinary Studies | 0 | 0.0% |
| Science & Technology | 0 | 0.0% |
| Business | 15 | 28.3% |
| Education | 0 | 0.0% |
| Literature & Languages | 0 | 0.0% |
| Liberal Arts & History | 0 | 0.0% |
| Visual & Performing Arts | 0 | 0.0% |
| Communications | 0 | 0.0% |
| Arts & Humanities | 0 | 0.0% |
| Total | 53 | 100.0% |
Transportation & Commute in Littlerock
Vehicle Availability by Sex in Littlerock
The most prevalent vehicle ownership categories in Littlerock are males with 3 vehicles (176, accounting for 42.0%) and females with 3 vehicles (105, making up 100.0%).
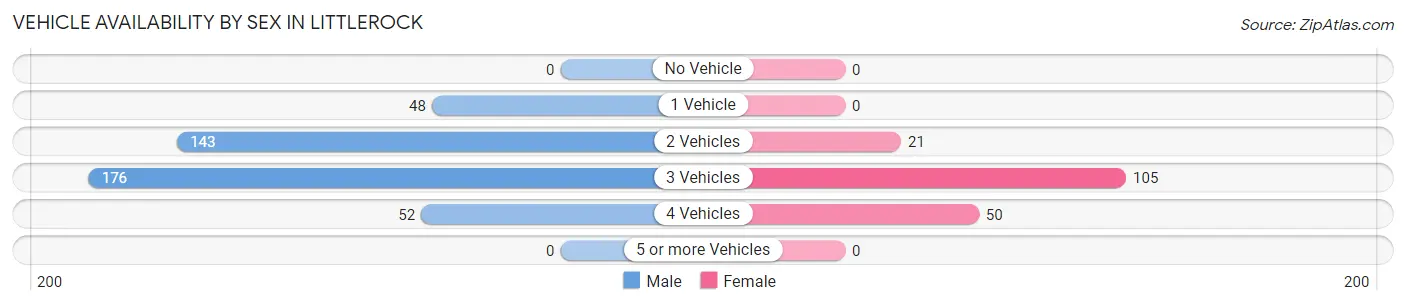
| Vehicles Available | Male | Female |
| No Vehicle | 0 (0.0%) | 0 (0.0%) |
| 1 Vehicle | 48 (11.5%) | 0 (0.0%) |
| 2 Vehicles | 143 (34.1%) | 21 (11.9%) |
| 3 Vehicles | 176 (42.0%) | 105 (59.7%) |
| 4 Vehicles | 52 (12.4%) | 50 (28.4%) |
| 5 or more Vehicles | 0 (0.0%) | 0 (0.0%) |
| Total | 419 (100.0%) | 176 (100.0%) |
Commute Time in Littlerock
The most frequently occuring commute durations in Littlerock are 60 to 89 minutes (193 commuters, 32.4%), 90 or more minutes (146 commuters, 24.5%), and 20 to 24 minutes (91 commuters, 15.3%).
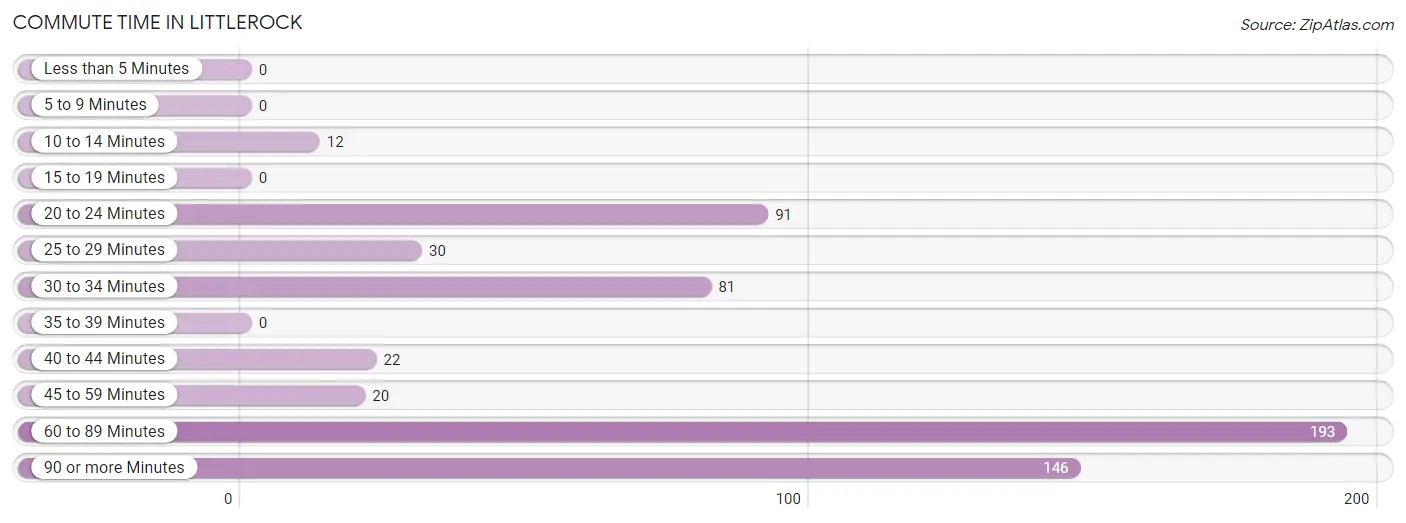
| Commute Time | # Commuters | % Commuters |
| Less than 5 Minutes | 0 | 0.0% |
| 5 to 9 Minutes | 0 | 0.0% |
| 10 to 14 Minutes | 12 | 2.0% |
| 15 to 19 Minutes | 0 | 0.0% |
| 20 to 24 Minutes | 91 | 15.3% |
| 25 to 29 Minutes | 30 | 5.0% |
| 30 to 34 Minutes | 81 | 13.6% |
| 35 to 39 Minutes | 0 | 0.0% |
| 40 to 44 Minutes | 22 | 3.7% |
| 45 to 59 Minutes | 20 | 3.4% |
| 60 to 89 Minutes | 193 | 32.4% |
| 90 or more Minutes | 146 | 24.5% |
Commute Time by Sex in Littlerock
The most common commute times in Littlerock are 60 to 89 minutes (125 commuters, 29.8%) for males and 60 to 89 minutes (68 commuters, 38.6%) for females.
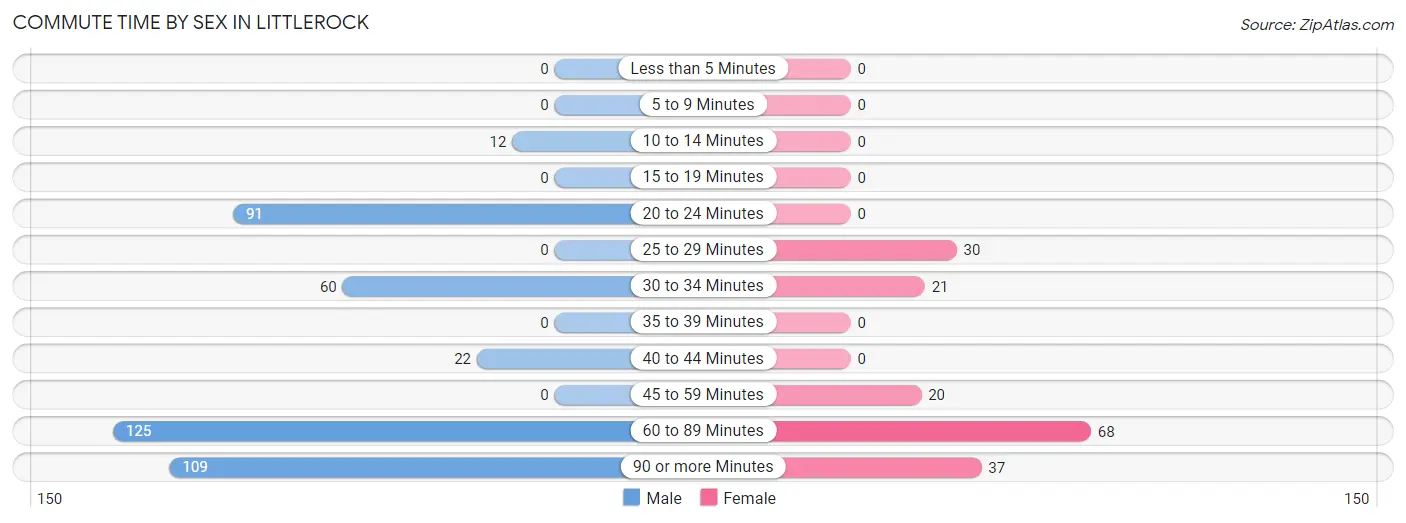
| Commute Time | Male | Female |
| Less than 5 Minutes | 0 (0.0%) | 0 (0.0%) |
| 5 to 9 Minutes | 0 (0.0%) | 0 (0.0%) |
| 10 to 14 Minutes | 12 (2.9%) | 0 (0.0%) |
| 15 to 19 Minutes | 0 (0.0%) | 0 (0.0%) |
| 20 to 24 Minutes | 91 (21.7%) | 0 (0.0%) |
| 25 to 29 Minutes | 0 (0.0%) | 30 (17.1%) |
| 30 to 34 Minutes | 60 (14.3%) | 21 (11.9%) |
| 35 to 39 Minutes | 0 (0.0%) | 0 (0.0%) |
| 40 to 44 Minutes | 22 (5.2%) | 0 (0.0%) |
| 45 to 59 Minutes | 0 (0.0%) | 20 (11.4%) |
| 60 to 89 Minutes | 125 (29.8%) | 68 (38.6%) |
| 90 or more Minutes | 109 (26.0%) | 37 (21.0%) |
Time of Departure to Work by Sex in Littlerock
The most frequent times of departure to work in Littlerock are 12:00 AM to 4:59 AM (130, 31.0%) for males and 8:00 AM to 8:29 AM (81, 46.0%) for females.
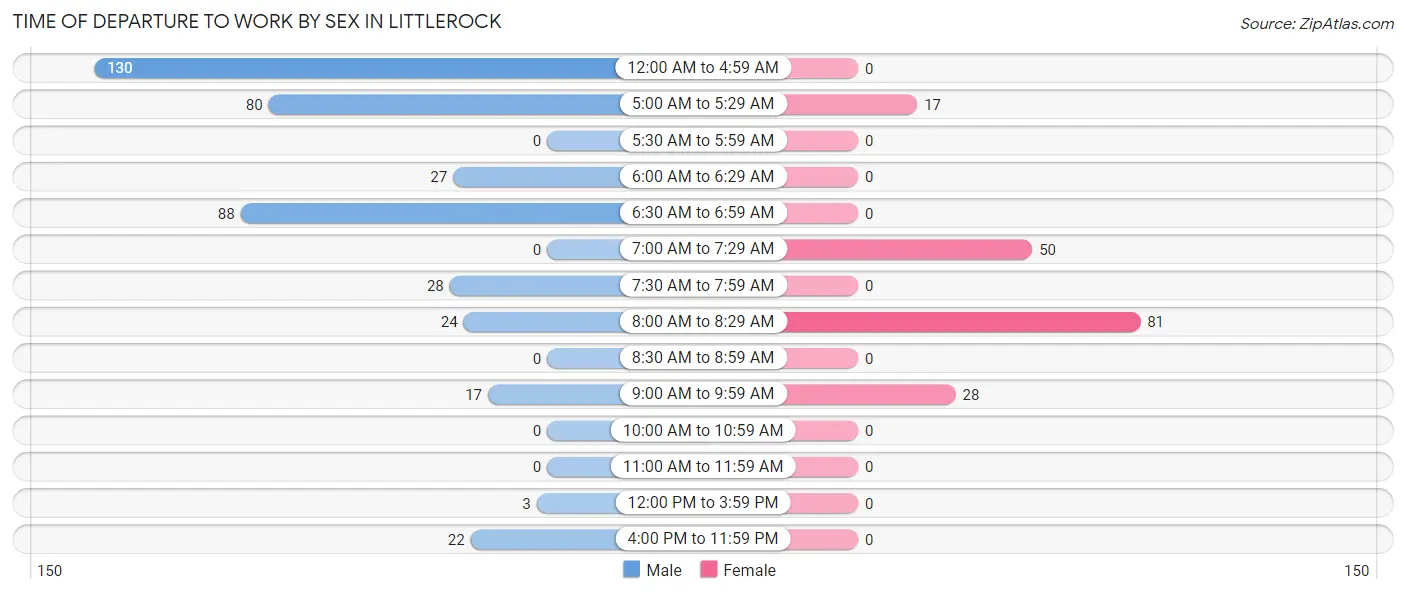
| Time of Departure | Male | Female |
| 12:00 AM to 4:59 AM | 130 (31.0%) | 0 (0.0%) |
| 5:00 AM to 5:29 AM | 80 (19.1%) | 17 (9.7%) |
| 5:30 AM to 5:59 AM | 0 (0.0%) | 0 (0.0%) |
| 6:00 AM to 6:29 AM | 27 (6.4%) | 0 (0.0%) |
| 6:30 AM to 6:59 AM | 88 (21.0%) | 0 (0.0%) |
| 7:00 AM to 7:29 AM | 0 (0.0%) | 50 (28.4%) |
| 7:30 AM to 7:59 AM | 28 (6.7%) | 0 (0.0%) |
| 8:00 AM to 8:29 AM | 24 (5.7%) | 81 (46.0%) |
| 8:30 AM to 8:59 AM | 0 (0.0%) | 0 (0.0%) |
| 9:00 AM to 9:59 AM | 17 (4.1%) | 28 (15.9%) |
| 10:00 AM to 10:59 AM | 0 (0.0%) | 0 (0.0%) |
| 11:00 AM to 11:59 AM | 0 (0.0%) | 0 (0.0%) |
| 12:00 PM to 3:59 PM | 3 (0.7%) | 0 (0.0%) |
| 4:00 PM to 11:59 PM | 22 (5.2%) | 0 (0.0%) |
| Total | 419 (100.0%) | 176 (100.0%) |
Housing Occupancy in Littlerock
Occupancy by Ownership in Littlerock
Of the total 379 dwellings in Littlerock, owner-occupied units account for 259 (68.3%), while renter-occupied units make up 120 (31.7%).
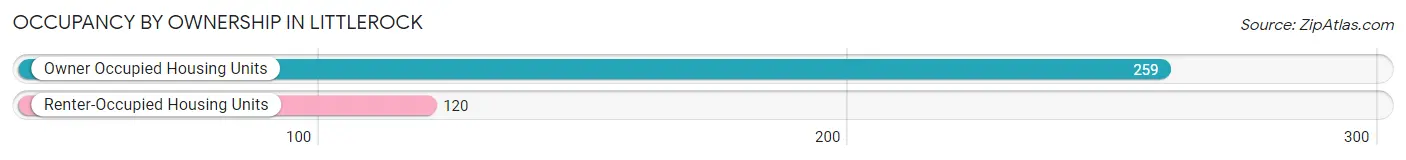
| Occupancy | # Housing Units | % Housing Units |
| Owner Occupied Housing Units | 259 | 68.3% |
| Renter-Occupied Housing Units | 120 | 31.7% |
| Total Occupied Housing Units | 379 | 100.0% |
Occupancy by Household Size in Littlerock
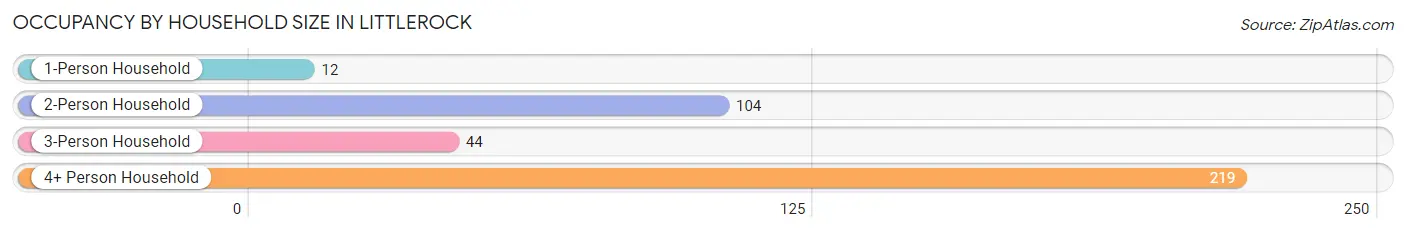
| Household Size | # Housing Units | % Housing Units |
| 1-Person Household | 12 | 3.2% |
| 2-Person Household | 104 | 27.4% |
| 3-Person Household | 44 | 11.6% |
| 4+ Person Household | 219 | 57.8% |
| Total Housing Units | 379 | 100.0% |
Occupancy by Ownership by Household Size in Littlerock
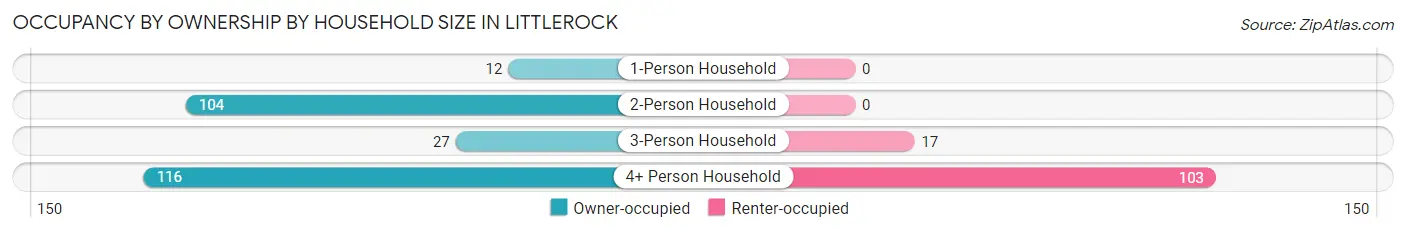
| Household Size | Owner-occupied | Renter-occupied |
| 1-Person Household | 12 (100.0%) | 0 (0.0%) |
| 2-Person Household | 104 (100.0%) | 0 (0.0%) |
| 3-Person Household | 27 (61.4%) | 17 (38.6%) |
| 4+ Person Household | 116 (53.0%) | 103 (47.0%) |
| Total Housing Units | 259 (68.3%) | 120 (31.7%) |
Occupancy by Educational Attainment in Littlerock
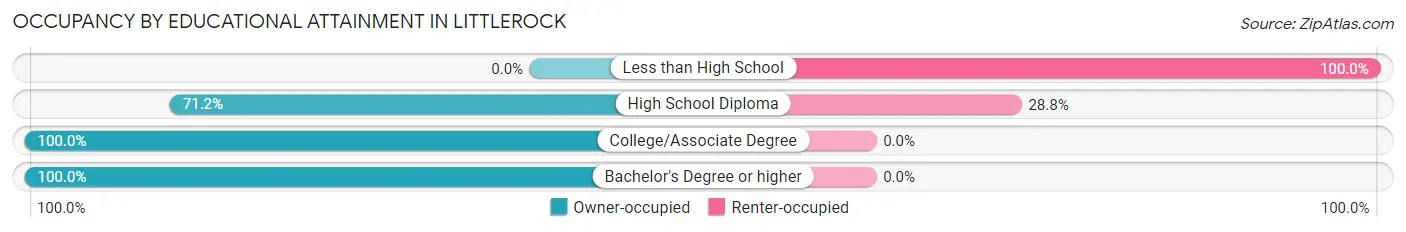
| Household Size | Owner-occupied | Renter-occupied |
| Less than High School | 0 (0.0%) | 103 (100.0%) |
| High School Diploma | 42 (71.2%) | 17 (28.8%) |
| College/Associate Degree | 181 (100.0%) | 0 (0.0%) |
| Bachelor's Degree or higher | 36 (100.0%) | 0 (0.0%) |
Occupancy by Age of Householder in Littlerock
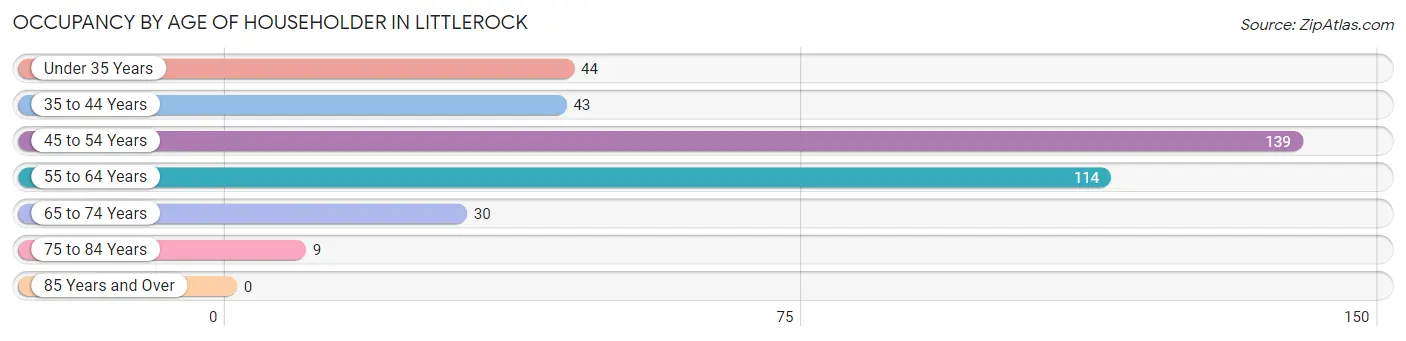
| Age Bracket | # Households | % Households |
| Under 35 Years | 44 | 11.6% |
| 35 to 44 Years | 43 | 11.4% |
| 45 to 54 Years | 139 | 36.7% |
| 55 to 64 Years | 114 | 30.1% |
| 65 to 74 Years | 30 | 7.9% |
| 75 to 84 Years | 9 | 2.4% |
| 85 Years and Over | 0 | 0.0% |
| Total | 379 | 100.0% |
Housing Finances in Littlerock
Median Income by Occupancy in Littlerock
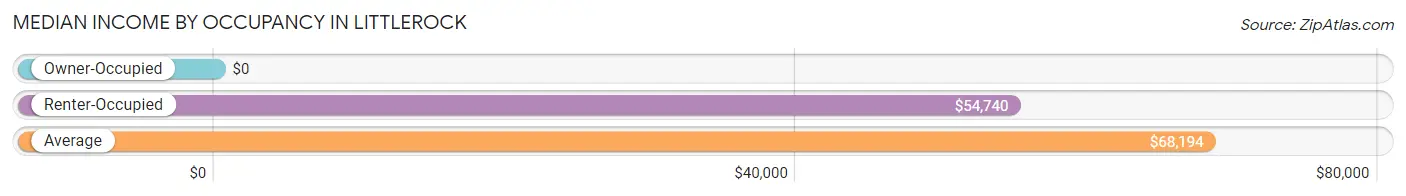
| Occupancy Type | # Households | Median Income |
| Owner-Occupied | 259 (68.3%) | $0 |
| Renter-Occupied | 120 (31.7%) | $54,740 |
| Average | 379 (100.0%) | $68,194 |
Occupancy by Householder Income Bracket in Littlerock
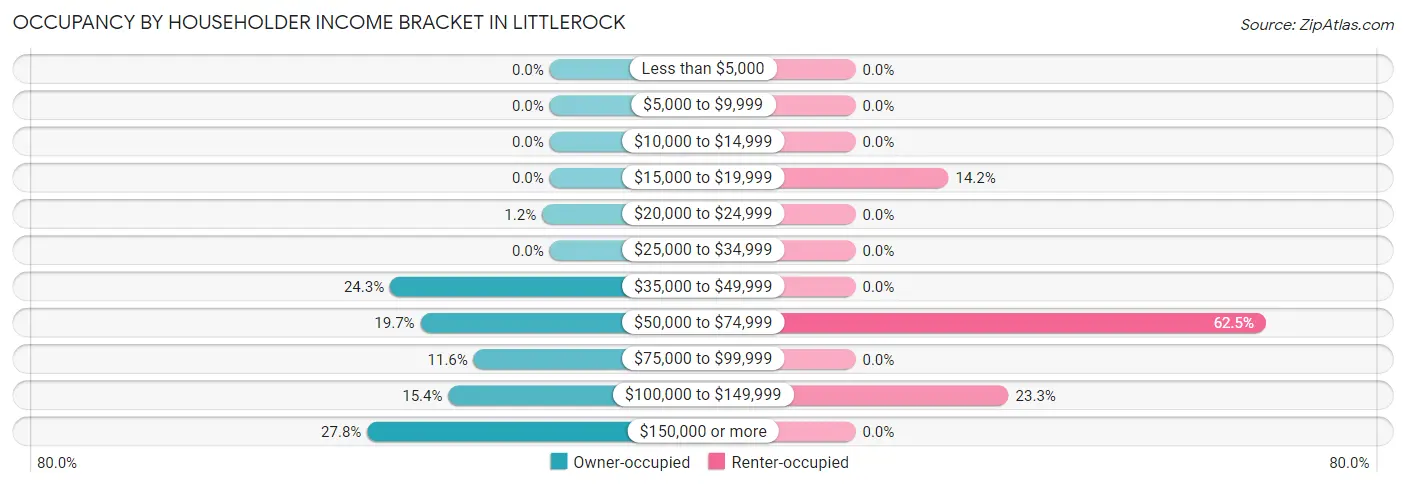
| Income Bracket | Owner-occupied | Renter-occupied |
| Less than $5,000 | 0 (0.0%) | 0 (0.0%) |
| $5,000 to $9,999 | 0 (0.0%) | 0 (0.0%) |
| $10,000 to $14,999 | 0 (0.0%) | 0 (0.0%) |
| $15,000 to $19,999 | 0 (0.0%) | 17 (14.2%) |
| $20,000 to $24,999 | 3 (1.2%) | 0 (0.0%) |
| $25,000 to $34,999 | 0 (0.0%) | 0 (0.0%) |
| $35,000 to $49,999 | 63 (24.3%) | 0 (0.0%) |
| $50,000 to $74,999 | 51 (19.7%) | 75 (62.5%) |
| $75,000 to $99,999 | 30 (11.6%) | 0 (0.0%) |
| $100,000 to $149,999 | 40 (15.4%) | 28 (23.3%) |
| $150,000 or more | 72 (27.8%) | 0 (0.0%) |
| Total | 259 (100.0%) | 120 (100.0%) |
Monthly Housing Cost Tiers in Littlerock
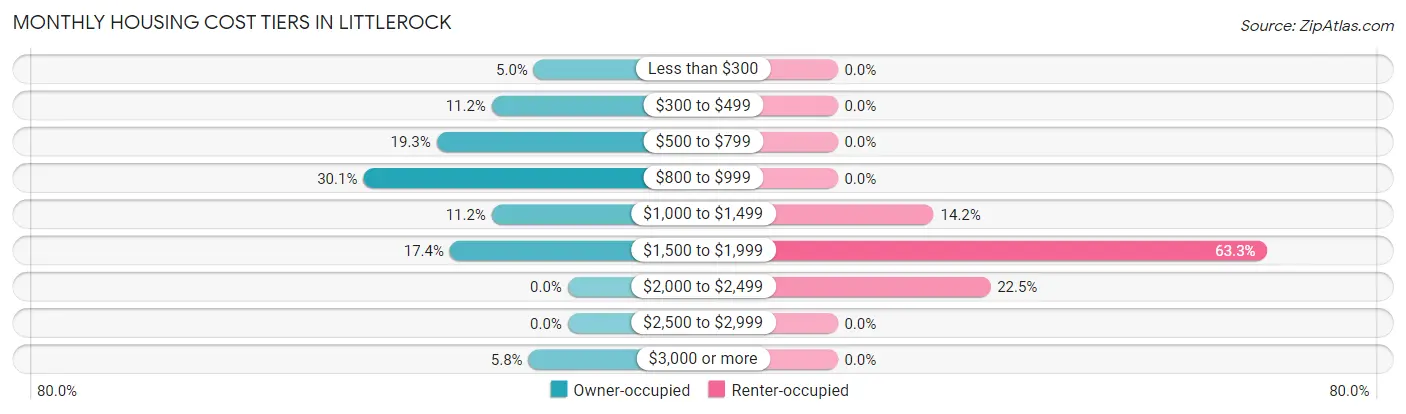
| Monthly Cost | Owner-occupied | Renter-occupied |
| Less than $300 | 13 (5.0%) | 0 (0.0%) |
| $300 to $499 | 29 (11.2%) | 0 (0.0%) |
| $500 to $799 | 50 (19.3%) | 0 (0.0%) |
| $800 to $999 | 78 (30.1%) | 0 (0.0%) |
| $1,000 to $1,499 | 29 (11.2%) | 17 (14.2%) |
| $1,500 to $1,999 | 45 (17.4%) | 76 (63.3%) |
| $2,000 to $2,499 | 0 (0.0%) | 27 (22.5%) |
| $2,500 to $2,999 | 0 (0.0%) | 0 (0.0%) |
| $3,000 or more | 15 (5.8%) | 0 (0.0%) |
| Total | 259 (100.0%) | 120 (100.0%) |
Physical Housing Characteristics in Littlerock
Housing Structures in Littlerock
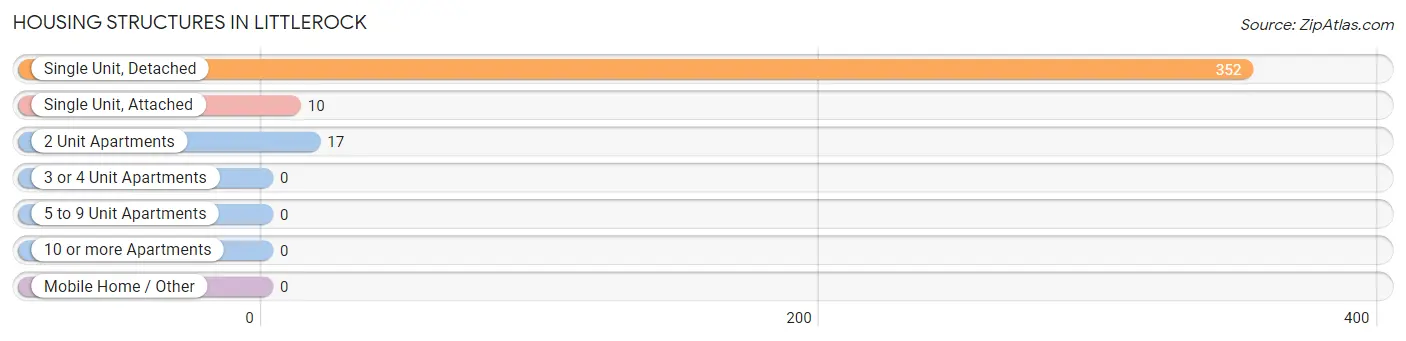
| Structure Type | # Housing Units | % Housing Units |
| Single Unit, Detached | 352 | 92.9% |
| Single Unit, Attached | 10 | 2.6% |
| 2 Unit Apartments | 17 | 4.5% |
| 3 or 4 Unit Apartments | 0 | 0.0% |
| 5 to 9 Unit Apartments | 0 | 0.0% |
| 10 or more Apartments | 0 | 0.0% |
| Mobile Home / Other | 0 | 0.0% |
| Total | 379 | 100.0% |
Housing Structures by Occupancy in Littlerock
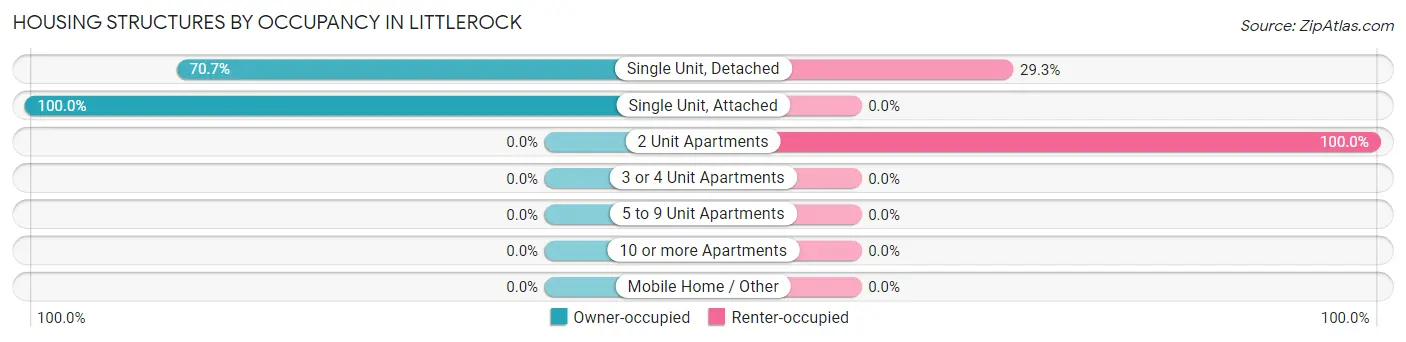
| Structure Type | Owner-occupied | Renter-occupied |
| Single Unit, Detached | 249 (70.7%) | 103 (29.3%) |
| Single Unit, Attached | 10 (100.0%) | 0 (0.0%) |
| 2 Unit Apartments | 0 (0.0%) | 17 (100.0%) |
| 3 or 4 Unit Apartments | 0 (0.0%) | 0 (0.0%) |
| 5 to 9 Unit Apartments | 0 (0.0%) | 0 (0.0%) |
| 10 or more Apartments | 0 (0.0%) | 0 (0.0%) |
| Mobile Home / Other | 0 (0.0%) | 0 (0.0%) |
| Total | 259 (68.3%) | 120 (31.7%) |
Housing Structures by Number of Rooms in Littlerock
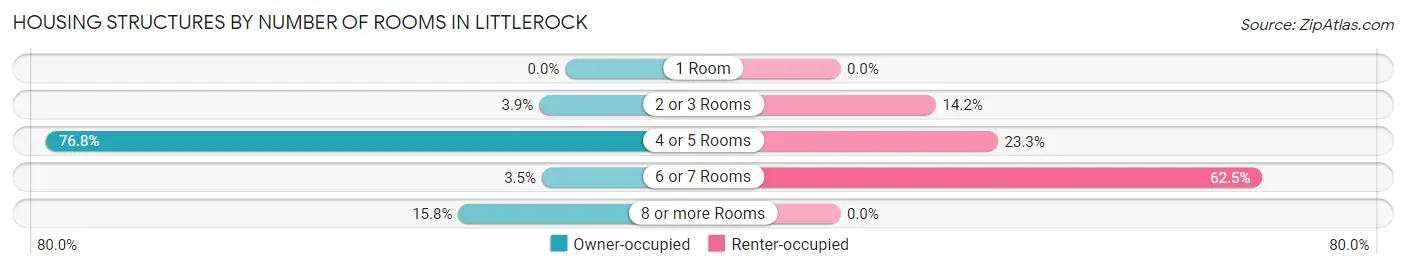
| Number of Rooms | Owner-occupied | Renter-occupied |
| 1 Room | 0 (0.0%) | 0 (0.0%) |
| 2 or 3 Rooms | 10 (3.9%) | 17 (14.2%) |
| 4 or 5 Rooms | 199 (76.8%) | 28 (23.3%) |
| 6 or 7 Rooms | 9 (3.5%) | 75 (62.5%) |
| 8 or more Rooms | 41 (15.8%) | 0 (0.0%) |
| Total | 259 (100.0%) | 120 (100.0%) |
Housing Structure by Heating Type in Littlerock
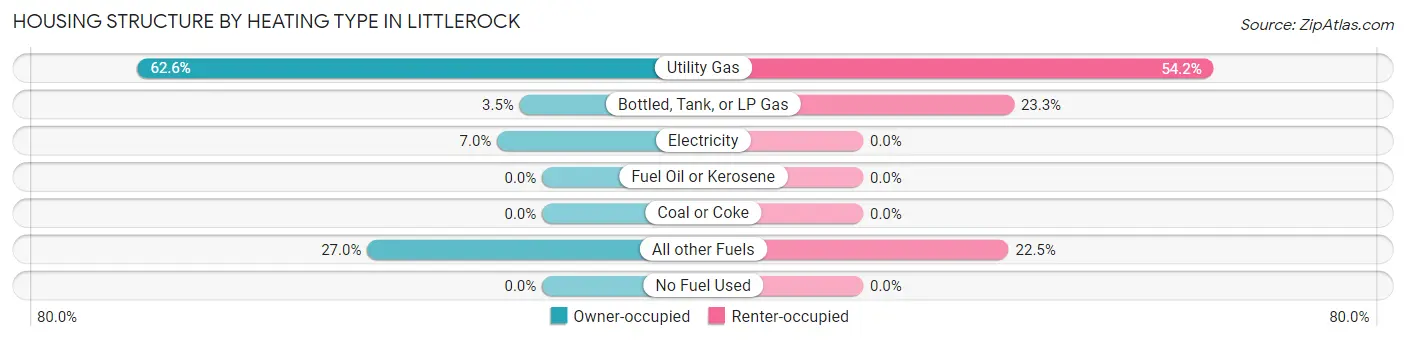
| Heating Type | Owner-occupied | Renter-occupied |
| Utility Gas | 162 (62.5%) | 65 (54.2%) |
| Bottled, Tank, or LP Gas | 9 (3.5%) | 28 (23.3%) |
| Electricity | 18 (7.0%) | 0 (0.0%) |
| Fuel Oil or Kerosene | 0 (0.0%) | 0 (0.0%) |
| Coal or Coke | 0 (0.0%) | 0 (0.0%) |
| All other Fuels | 70 (27.0%) | 27 (22.5%) |
| No Fuel Used | 0 (0.0%) | 0 (0.0%) |
| Total | 259 (100.0%) | 120 (100.0%) |
Household Vehicle Usage in Littlerock
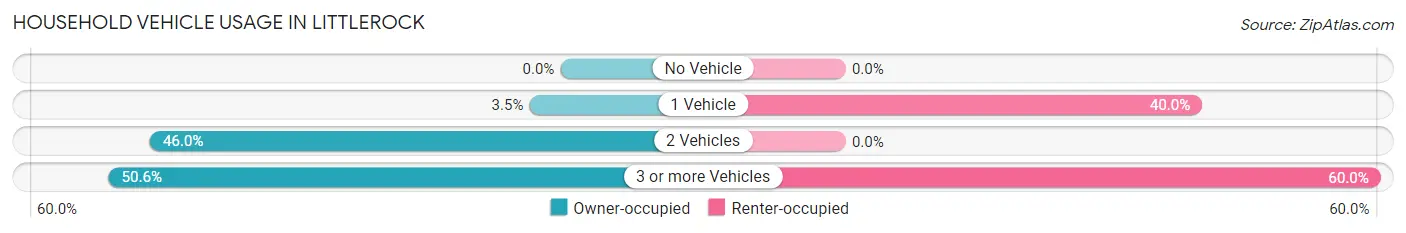
| Vehicles per Household | Owner-occupied | Renter-occupied |
| No Vehicle | 0 (0.0%) | 0 (0.0%) |
| 1 Vehicle | 9 (3.5%) | 48 (40.0%) |
| 2 Vehicles | 119 (46.0%) | 0 (0.0%) |
| 3 or more Vehicles | 131 (50.6%) | 72 (60.0%) |
| Total | 259 (100.0%) | 120 (100.0%) |
Real Estate & Mortgages in Littlerock
Real Estate and Mortgage Overview in Littlerock
| Characteristic | Without Mortgage | With Mortgage |
| Housing Units | 51 | 208 |
| Median Property Value | $275,000 | $337,800 |
| Median Household Income | - | - |
| Monthly Housing Costs | $443 | $15 |
| Real Estate Taxes | $2,603 | $0 |
Property Value by Mortgage Status in Littlerock
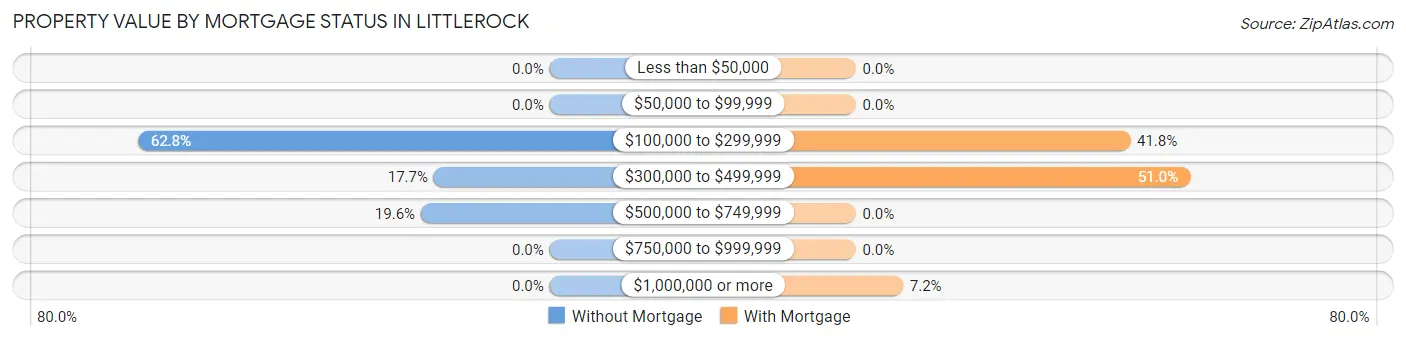
| Property Value | Without Mortgage | With Mortgage |
| Less than $50,000 | 0 (0.0%) | 0 (0.0%) |
| $50,000 to $99,999 | 0 (0.0%) | 0 (0.0%) |
| $100,000 to $299,999 | 32 (62.7%) | 87 (41.8%) |
| $300,000 to $499,999 | 9 (17.6%) | 106 (51.0%) |
| $500,000 to $749,999 | 10 (19.6%) | 0 (0.0%) |
| $750,000 to $999,999 | 0 (0.0%) | 0 (0.0%) |
| $1,000,000 or more | 0 (0.0%) | 15 (7.2%) |
| Total | 51 (100.0%) | 208 (100.0%) |
Household Income by Mortgage Status in Littlerock
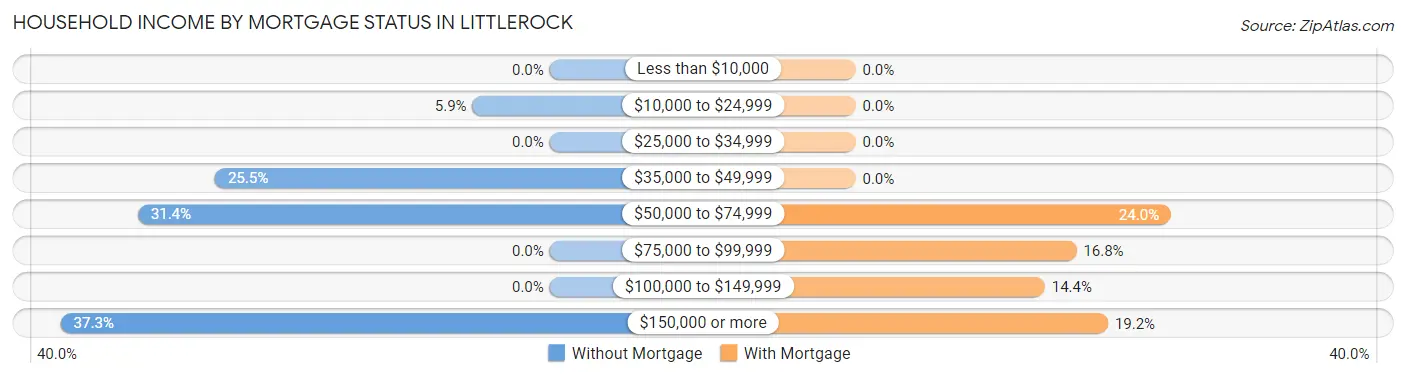
| Household Income | Without Mortgage | With Mortgage |
| Less than $10,000 | 0 (0.0%) | 0 (0.0%) |
| $10,000 to $24,999 | 3 (5.9%) | 0 (0.0%) |
| $25,000 to $34,999 | 0 (0.0%) | 0 (0.0%) |
| $35,000 to $49,999 | 13 (25.5%) | 0 (0.0%) |
| $50,000 to $74,999 | 16 (31.4%) | 50 (24.0%) |
| $75,000 to $99,999 | 0 (0.0%) | 35 (16.8%) |
| $100,000 to $149,999 | 0 (0.0%) | 30 (14.4%) |
| $150,000 or more | 19 (37.2%) | 40 (19.2%) |
| Total | 51 (100.0%) | 208 (100.0%) |
Property Value to Household Income Ratio in Littlerock
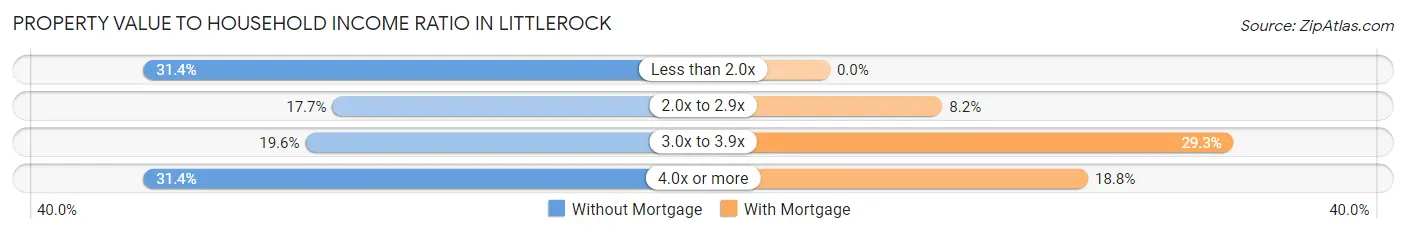
| Value-to-Income Ratio | Without Mortgage | With Mortgage |
| Less than 2.0x | 16 (31.4%) | 0 (0.0%) |
| 2.0x to 2.9x | 9 (17.6%) | 17 (8.2%) |
| 3.0x to 3.9x | 10 (19.6%) | 61 (29.3%) |
| 4.0x or more | 16 (31.4%) | 39 (18.8%) |
| Total | 51 (100.0%) | 208 (100.0%) |
Real Estate Taxes by Mortgage Status in Littlerock
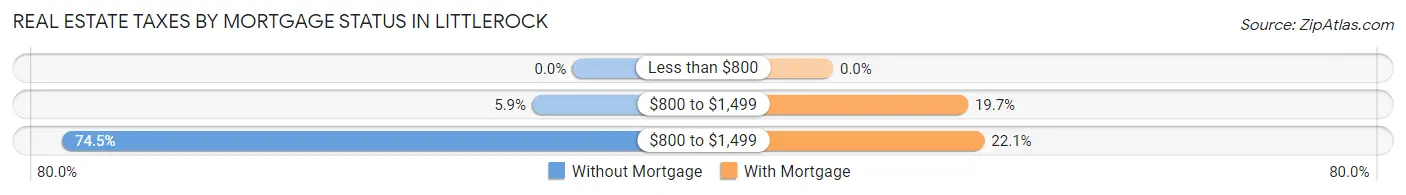
| Property Taxes | Without Mortgage | With Mortgage |
| Less than $800 | 0 (0.0%) | 0 (0.0%) |
| $800 to $1,499 | 3 (5.9%) | 41 (19.7%) |
| $800 to $1,499 | 38 (74.5%) | 46 (22.1%) |
| Total | 51 (100.0%) | 208 (100.0%) |
Health & Disability in Littlerock
Health Insurance Coverage by Age in Littlerock
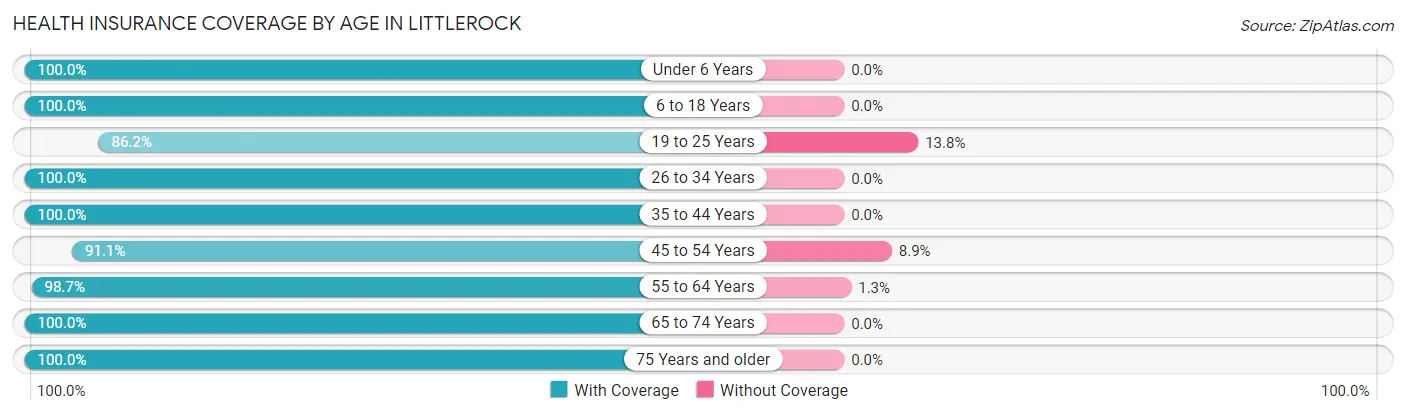
| Age Bracket | With Coverage | Without Coverage |
| Under 6 Years | 191 (100.0%) | 0 (0.0%) |
| 6 to 18 Years | 344 (100.0%) | 0 (0.0%) |
| 19 to 25 Years | 200 (86.2%) | 32 (13.8%) |
| 26 to 34 Years | 116 (100.0%) | 0 (0.0%) |
| 35 to 44 Years | 77 (100.0%) | 0 (0.0%) |
| 45 to 54 Years | 226 (91.1%) | 22 (8.9%) |
| 55 to 64 Years | 228 (98.7%) | 3 (1.3%) |
| 65 to 74 Years | 30 (100.0%) | 0 (0.0%) |
| 75 Years and older | 40 (100.0%) | 0 (0.0%) |
| Total | 1,452 (96.2%) | 57 (3.8%) |
Health Insurance Coverage by Citizenship Status in Littlerock
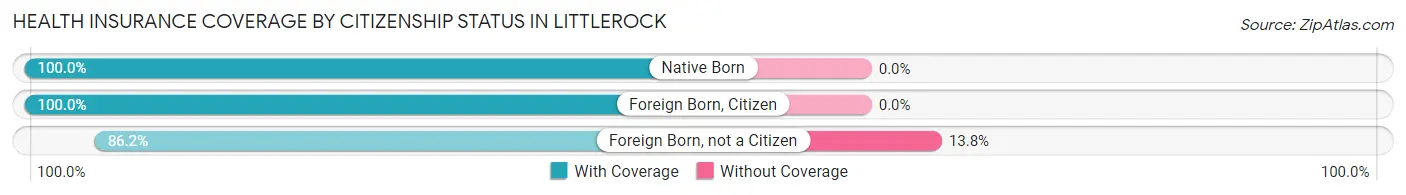
| Citizenship Status | With Coverage | Without Coverage |
| Native Born | 191 (100.0%) | 0 (0.0%) |
| Foreign Born, Citizen | 344 (100.0%) | 0 (0.0%) |
| Foreign Born, not a Citizen | 200 (86.2%) | 32 (13.8%) |
Health Insurance Coverage by Household Income in Littlerock
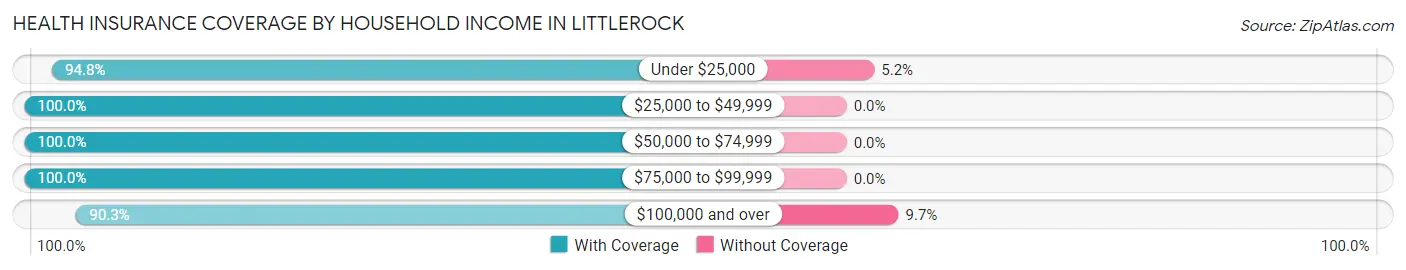
| Household Income | With Coverage | Without Coverage |
| Under $25,000 | 55 (94.8%) | 3 (5.2%) |
| $25,000 to $49,999 | 208 (100.0%) | 0 (0.0%) |
| $50,000 to $74,999 | 626 (100.0%) | 0 (0.0%) |
| $75,000 to $99,999 | 61 (100.0%) | 0 (0.0%) |
| $100,000 and over | 502 (90.3%) | 54 (9.7%) |
Public vs Private Health Insurance Coverage by Age in Littlerock
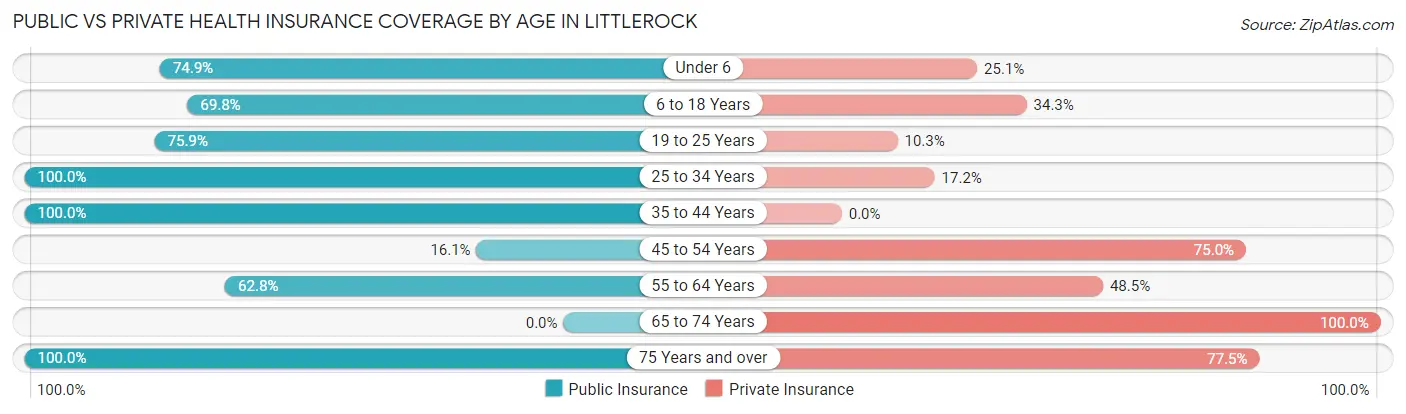
| Age Bracket | Public Insurance | Private Insurance |
| Under 6 | 143 (74.9%) | 48 (25.1%) |
| 6 to 18 Years | 240 (69.8%) | 118 (34.3%) |
| 19 to 25 Years | 176 (75.9%) | 24 (10.3%) |
| 25 to 34 Years | 116 (100.0%) | 20 (17.2%) |
| 35 to 44 Years | 77 (100.0%) | 0 (0.0%) |
| 45 to 54 Years | 40 (16.1%) | 186 (75.0%) |
| 55 to 64 Years | 145 (62.8%) | 112 (48.5%) |
| 65 to 74 Years | 0 (0.0%) | 30 (100.0%) |
| 75 Years and over | 40 (100.0%) | 31 (77.5%) |
| Total | 977 (64.7%) | 569 (37.7%) |
Disability Status by Sex by Age in Littlerock
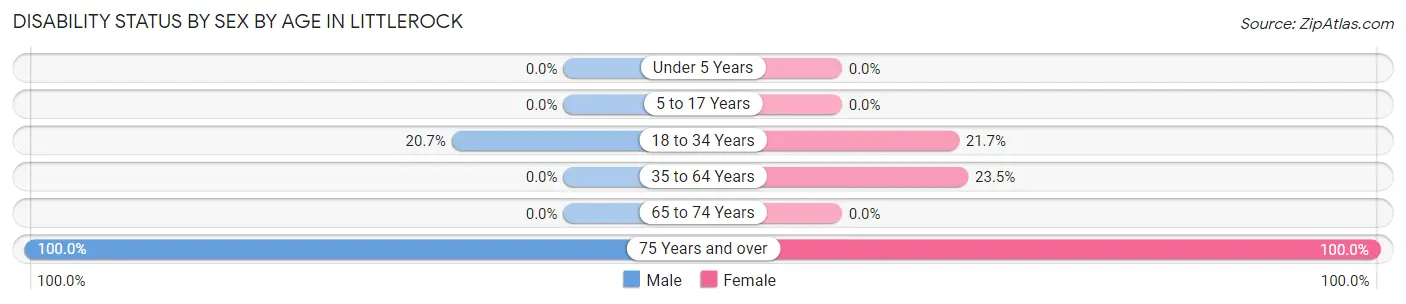
| Age Bracket | Male | Female |
| Under 5 Years | 0 (0.0%) | 0 (0.0%) |
| 5 to 17 Years | 0 (0.0%) | 0 (0.0%) |
| 18 to 34 Years | 45 (20.7%) | 38 (21.7%) |
| 35 to 64 Years | 0 (0.0%) | 68 (23.4%) |
| 65 to 74 Years | 0 (0.0%) | 0 (0.0%) |
| 75 Years and over | 31 (100.0%) | 9 (100.0%) |
Disability Class by Sex by Age in Littlerock
Disability Class: Hearing Difficulty
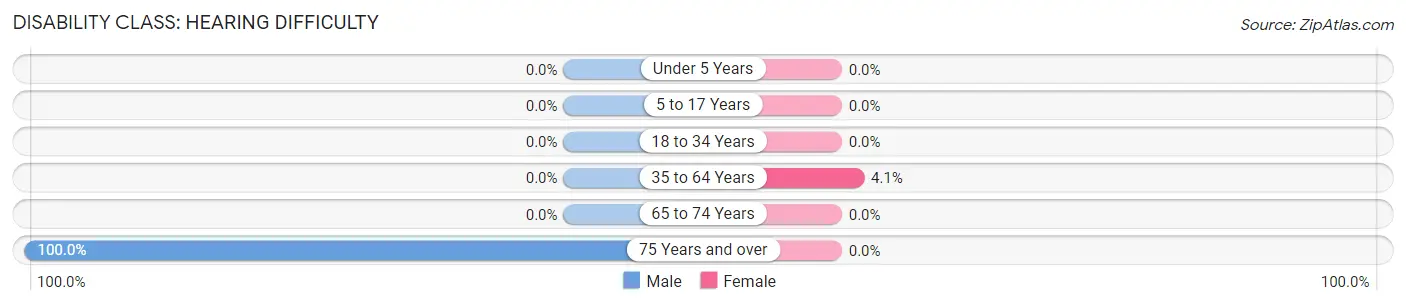
| Age Bracket | Male | Female |
| Under 5 Years | 0 (0.0%) | 0 (0.0%) |
| 5 to 17 Years | 0 (0.0%) | 0 (0.0%) |
| 18 to 34 Years | 0 (0.0%) | 0 (0.0%) |
| 35 to 64 Years | 0 (0.0%) | 12 (4.1%) |
| 65 to 74 Years | 0 (0.0%) | 0 (0.0%) |
| 75 Years and over | 31 (100.0%) | 0 (0.0%) |
Disability Class: Vision Difficulty
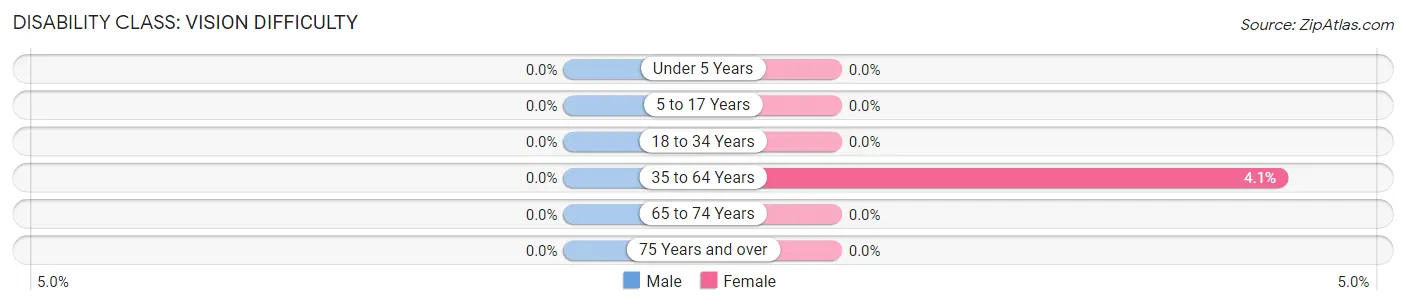
| Age Bracket | Male | Female |
| Under 5 Years | 0 (0.0%) | 0 (0.0%) |
| 5 to 17 Years | 0 (0.0%) | 0 (0.0%) |
| 18 to 34 Years | 0 (0.0%) | 0 (0.0%) |
| 35 to 64 Years | 0 (0.0%) | 12 (4.1%) |
| 65 to 74 Years | 0 (0.0%) | 0 (0.0%) |
| 75 Years and over | 0 (0.0%) | 0 (0.0%) |
Disability Class: Cognitive Difficulty
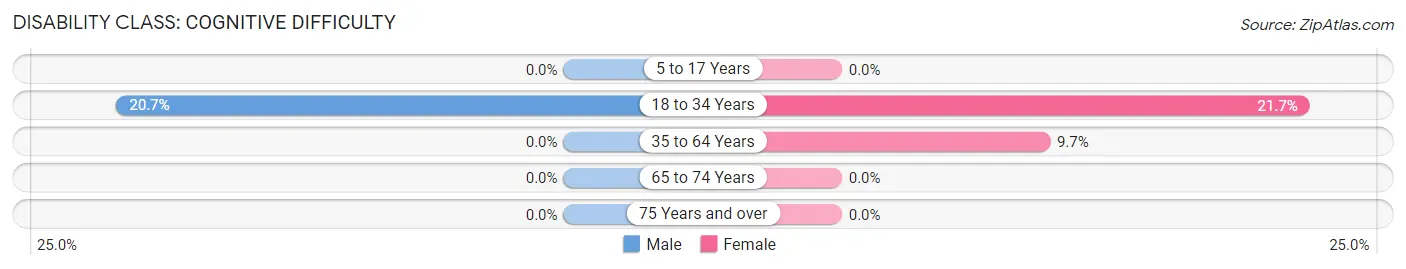
| Age Bracket | Male | Female |
| 5 to 17 Years | 0 (0.0%) | 0 (0.0%) |
| 18 to 34 Years | 45 (20.7%) | 38 (21.7%) |
| 35 to 64 Years | 0 (0.0%) | 28 (9.7%) |
| 65 to 74 Years | 0 (0.0%) | 0 (0.0%) |
| 75 Years and over | 0 (0.0%) | 0 (0.0%) |
Disability Class: Ambulatory Difficulty
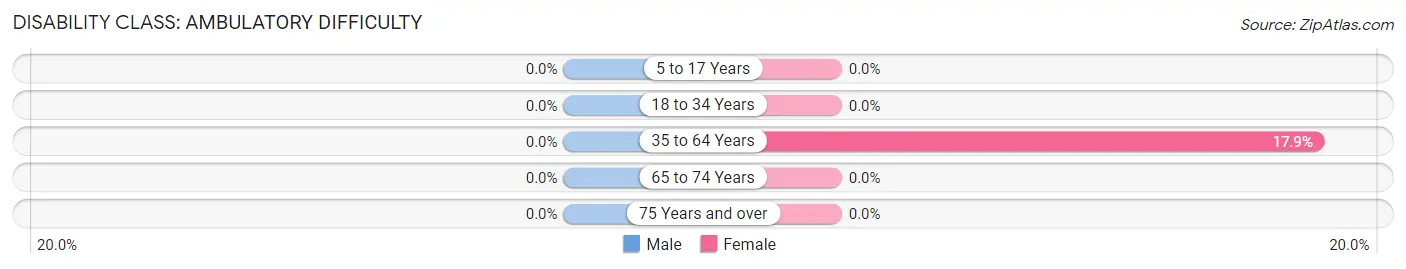
| Age Bracket | Male | Female |
| 5 to 17 Years | 0 (0.0%) | 0 (0.0%) |
| 18 to 34 Years | 0 (0.0%) | 0 (0.0%) |
| 35 to 64 Years | 0 (0.0%) | 52 (17.9%) |
| 65 to 74 Years | 0 (0.0%) | 0 (0.0%) |
| 75 Years and over | 0 (0.0%) | 0 (0.0%) |
Disability Class: Self-Care Difficulty
| Age Bracket | Male | Female |
| 5 to 17 Years | 0 (0.0%) | 0 (0.0%) |
| 18 to 34 Years | 0 (0.0%) | 0 (0.0%) |
| 35 to 64 Years | 0 (0.0%) | 0 (0.0%) |
| 65 to 74 Years | 0 (0.0%) | 0 (0.0%) |
| 75 Years and over | 0 (0.0%) | 0 (0.0%) |
Technology Access in Littlerock
Computing Device Access in Littlerock
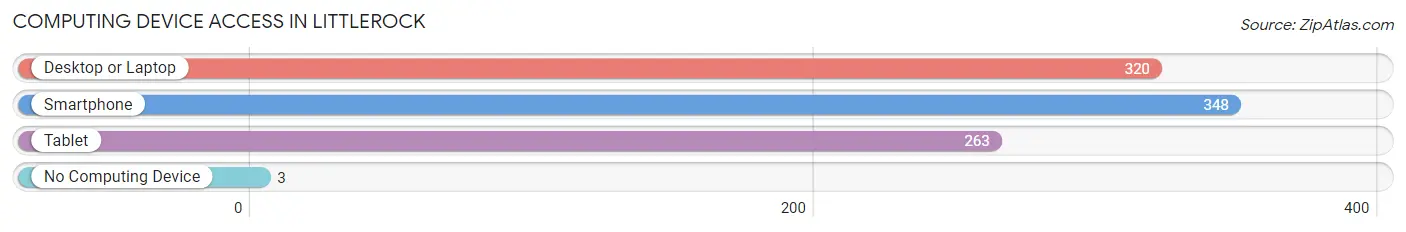
| Device Type | # Households | % Households |
| Desktop or Laptop | 320 | 84.4% |
| Smartphone | 348 | 91.8% |
| Tablet | 263 | 69.4% |
| No Computing Device | 3 | 0.8% |
| Total | 379 | 100.0% |
Internet Access in Littlerock
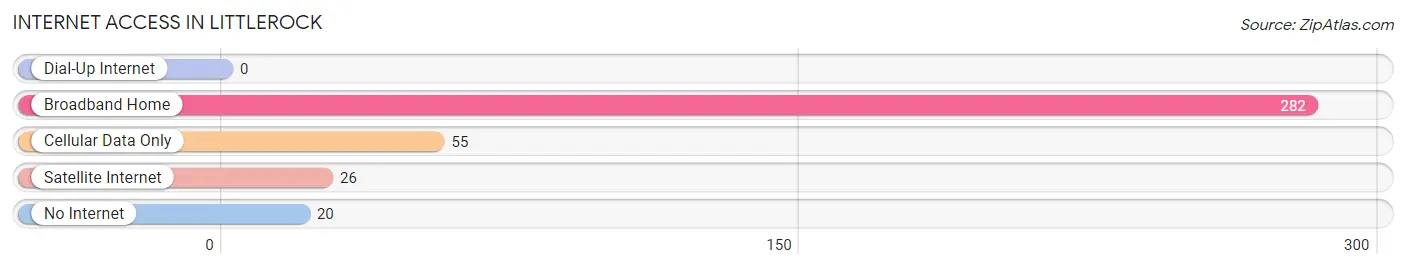
| Internet Type | # Households | % Households |
| Dial-Up Internet | 0 | 0.0% |
| Broadband Home | 282 | 74.4% |
| Cellular Data Only | 55 | 14.5% |
| Satellite Internet | 26 | 6.9% |
| No Internet | 20 | 5.3% |
| Total | 379 | 100.0% |
Littlerock Summary
Littlerock is a small unincorporated community located in the Antelope Valley of northern Los Angeles County, California. It is located about 13 miles east of Palmdale and is part of the Antelope Valley region. The population of Littlerock was 1,377 at the 2010 census.
History
Littlerock was originally inhabited by the Tataviam Native American tribe. The area was first settled by European Americans in the late 19th century. The town was founded in 1888 by William L. Little and his wife, Mary, who purchased the land from the Southern Pacific Railroad. The town was named after William Little, who was a rancher and farmer in the area.
The town grew slowly over the years, and by the 1950s, it had become a popular destination for weekenders from Los Angeles. In the 1960s, the town began to experience rapid growth as the Antelope Valley became a popular destination for people looking to escape the hustle and bustle of the city.
Geography
Littlerock is located at 34°37'25" North, 118°14'17" West (34.623, -118.238). It is situated in the Antelope Valley of northern Los Angeles County, California. The town is located about 13 miles east of Palmdale and is part of the Antelope Valley region.
The town is located in the Mojave Desert and is surrounded by the San Gabriel Mountains to the south and the Tehachapi Mountains to the north. The town is located at an elevation of 2,845 feet above sea level.
Economy
Littlerock is a small, rural community with a population of 1,377 as of the 2010 census. The town is primarily a bedroom community, with most of its residents commuting to nearby cities for work.
The town is home to several small businesses, including a gas station, a grocery store, a post office, and a few restaurants. The town is also home to a few small manufacturing companies, including a furniture manufacturer and a plastics manufacturer.
Demographics
As of the 2010 census, the population of Littlerock was 1,377. The racial makeup of the town was 68.2% White, 0.7% African American, 0.7% Native American, 0.7% Asian, 0.1% Pacific Islander, 25.3% from other races, and 4.3% from two or more races. Hispanic or Latino of any race were 44.2% of the population.
The median household income in Littlerock was $41,250, and the median family income was $45,000. The per capita income for the town was $17,845. About 17.2% of families and 20.2% of the population were below the poverty line, including 28.3% of those under age 18 and 8.3% of those age 65 or over.
Common Questions
What is Per Capita Income in Littlerock?
Per Capita income in Littlerock is $24,619.
What is the Median Family Income in Littlerock?
Median Family Income in Littlerock is $59,563.
What is the Median Household income in Littlerock?
Median Household Income in Littlerock is $68,194.
What is Income or Wage Gap in Littlerock?
Income or Wage Gap in Littlerock is 29.3%.
Women in Littlerock earn 70.7 cents for every dollar earned by a man.
What is Inequality or Gini Index in Littlerock?
Inequality or Gini Index in Littlerock is 0.33.
What is the Total Population of Littlerock?
Total Population of Littlerock is 1,509.
What is the Total Male Population of Littlerock?
Total Male Population of Littlerock is 767.
What is the Total Female Population of Littlerock?
Total Female Population of Littlerock is 742.
What is the Ratio of Males per 100 Females in Littlerock?
There are 103.37 Males per 100 Females in Littlerock.
What is the Ratio of Females per 100 Males in Littlerock?
There are 96.74 Females per 100 Males in Littlerock.
What is the Median Population Age in Littlerock?
Median Population Age in Littlerock is 25.5 Years.
What is the Average Family Size in Littlerock
Average Family Size in Littlerock is 3.9 People.
What is the Average Household Size in Littlerock
Average Household Size in Littlerock is 4.0 People.
How Large is the Labor Force in Littlerock?
There are 679 People in the Labor Forcein in Littlerock.
What is the Percentage of People in the Labor Force in Littlerock?
63.9% of People are in the Labor Force in Littlerock.
What is the Unemployment Rate in Littlerock?
Unemployment Rate in Littlerock is 7.5%.