Cities with the Highest Percentage of Population with a Degree in Engineering in Nevada
RELATED REPORTS & OPTIONS
Engineering
Nevada
Compare Cities
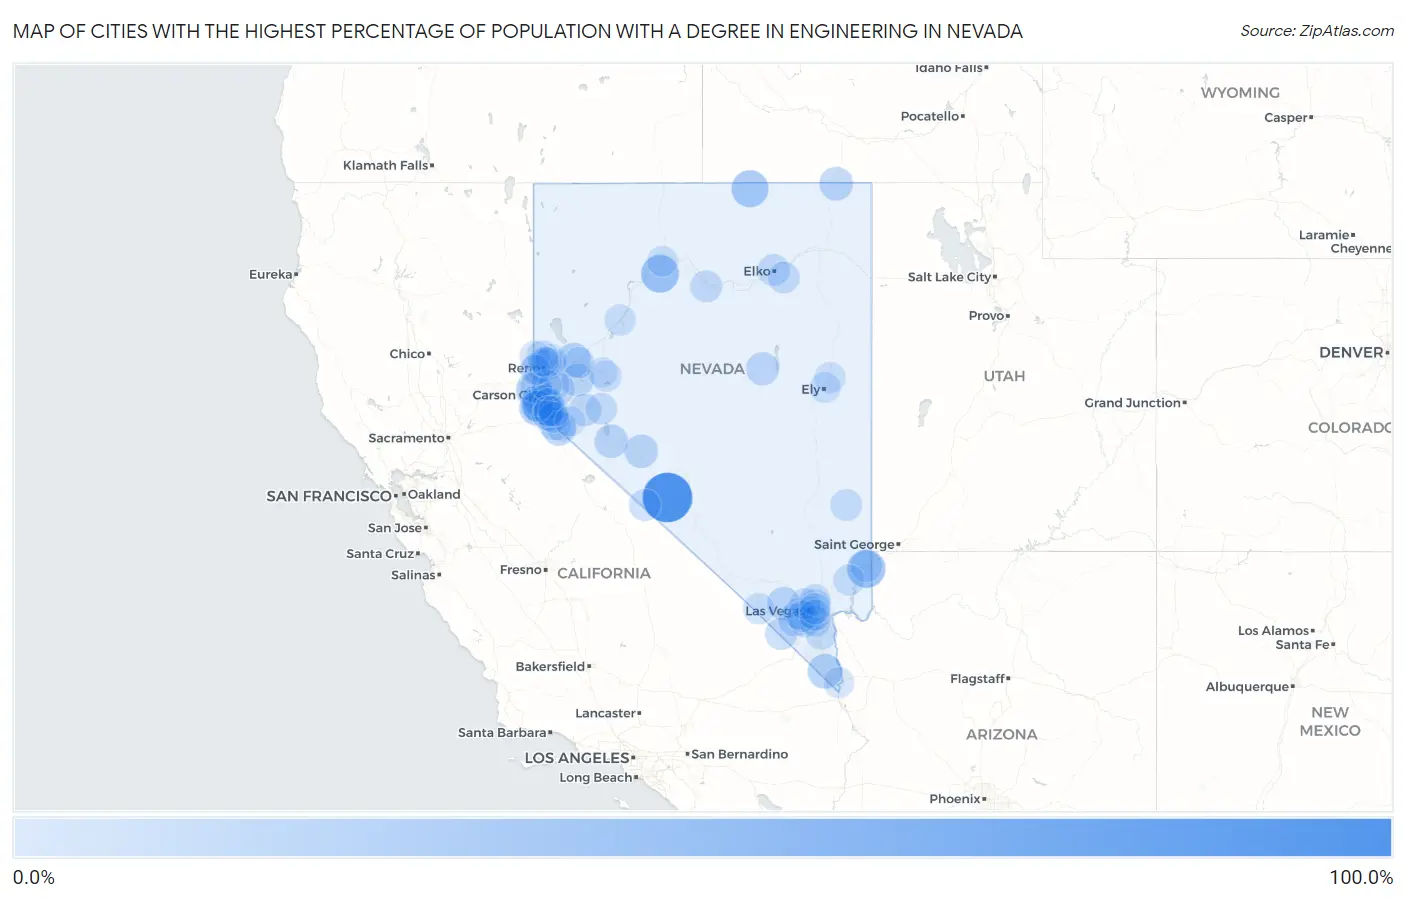
Map of Cities with the Highest Percentage of Population with a Degree in Engineering in Nevada
0.0%
100.0%
Cities with the Highest Percentage of Population with a Degree in Engineering in Nevada
| City | % Graduates | vs State | vs National | |
| 1. | Silver Peak | 100.0% | 6.9%(+93.1)#1 | 7.6%(+92.4)#20 |
| 2. | Bunkerville | 40.4% | 6.9%(+33.6)#2 | 7.6%(+32.8)#260 |
| 3. | Grass Valley | 38.2% | 6.9%(+31.3)#3 | 7.6%(+30.5)#290 |
| 4. | Owyhee | 33.3% | 6.9%(+26.5)#4 | 7.6%(+25.7)#355 |
| 5. | Round Hill Village | 29.9% | 6.9%(+23.0)#5 | 7.6%(+22.3)#450 |
| 6. | Crystal Bay | 25.1% | 6.9%(+18.3)#6 | 7.6%(+17.5)#632 |
| 7. | Cal Nev Ari | 22.2% | 6.9%(+15.3)#7 | 7.6%(+14.6)#835 |
| 8. | Genoa | 20.9% | 6.9%(+14.1)#8 | 7.6%(+13.3)#957 |
| 9. | Wadsworth | 20.0% | 6.9%(+13.1)#9 | 7.6%(+12.4)#1,032 |
| 10. | Topaz Lake | 17.4% | 6.9%(+10.5)#10 | 7.6%(+9.74)#1,381 |
| 11. | Jackpot | 17.3% | 6.9%(+10.4)#11 | 7.6%(+9.66)#1,393 |
| 12. | Mount Charleston | 16.4% | 6.9%(+9.52)#12 | 7.6%(+8.75)#1,583 |
| 13. | Hawthorne | 16.4% | 6.9%(+9.49)#13 | 7.6%(+8.71)#1,589 |
| 14. | Mina | 16.3% | 6.9%(+9.45)#14 | 7.6%(+8.68)#1,594 |
| 15. | Kingsbury | 15.5% | 6.9%(+8.67)#15 | 7.6%(+7.90)#1,759 |
| 16. | Eureka | 14.3% | 6.9%(+7.41)#16 | 7.6%(+6.64)#2,043 |
| 17. | Silver Springs | 13.9% | 6.9%(+7.00)#17 | 7.6%(+6.23)#2,191 |
| 18. | Minden | 13.3% | 6.9%(+6.43)#18 | 7.6%(+5.66)#2,386 |
| 19. | Blue Diamond | 13.2% | 6.9%(+6.32)#19 | 7.6%(+5.55)#2,415 |
| 20. | Ruhenstroth | 12.8% | 6.9%(+5.88)#20 | 7.6%(+5.11)#2,580 |
| 21. | Indian Hills | 12.6% | 6.9%(+5.71)#21 | 7.6%(+4.93)#2,641 |
| 22. | Double Spring | 12.5% | 6.9%(+5.63)#22 | 7.6%(+4.85)#2,687 |
| 23. | Skyland | 12.3% | 6.9%(+5.43)#23 | 7.6%(+4.65)#2,775 |
| 24. | Yerington | 10.9% | 6.9%(+4.04)#24 | 7.6%(+3.26)#3,457 |
| 25. | Dayton | 10.9% | 6.9%(+4.01)#25 | 7.6%(+3.23)#3,473 |
| 26. | Incline Village | 10.4% | 6.9%(+3.58)#26 | 7.6%(+2.80)#3,751 |
| 27. | Sandy Valley | 10.2% | 6.9%(+3.34)#27 | 7.6%(+2.57)#3,923 |
| 28. | Reno | 9.3% | 6.9%(+2.40)#28 | 7.6%(+1.63)#4,659 |
| 29. | East Valley | 9.1% | 6.9%(+2.23)#29 | 7.6%(+1.46)#4,779 |
| 30. | Sparks | 9.0% | 6.9%(+2.08)#30 | 7.6%(+1.31)#4,979 |
| 31. | Battle Mountain | 8.9% | 6.9%(+2.04)#31 | 7.6%(+1.26)#5,016 |
| 32. | Glenbrook | 8.8% | 6.9%(+1.89)#32 | 7.6%(+1.11)#5,148 |
| 33. | Dyer | 8.7% | 6.9%(+1.82)#33 | 7.6%(+1.05)#5,215 |
| 34. | Elko | 8.7% | 6.9%(+1.82)#34 | 7.6%(+1.04)#5,228 |
| 35. | Spring Creek | 8.5% | 6.9%(+1.66)#35 | 7.6%(+0.886)#5,366 |
| 36. | Mesquite | 8.5% | 6.9%(+1.65)#36 | 7.6%(+0.873)#5,375 |
| 37. | Mogul | 8.4% | 6.9%(+1.49)#37 | 7.6%(+0.717)#5,518 |
| 38. | Paradise | 7.8% | 6.9%(+0.962)#38 | 7.6%(+0.188)#6,172 |
| 39. | Caliente | 7.6% | 6.9%(+0.713)#39 | 7.6%(-0.061)#6,495 |
| 40. | Nellis Afb | 7.4% | 6.9%(+0.561)#40 | 7.6%(-0.213)#6,667 |
| 41. | Schurz | 7.2% | 6.9%(+0.374)#41 | 7.6%(-0.401)#6,926 |
| 42. | Carson | 7.1% | 6.9%(+0.249)#42 | 7.6%(-0.526)#7,115 |
| 43. | Enterprise | 7.0% | 6.9%(+0.086)#43 | 7.6%(-0.689)#7,328 |
| 44. | Virginia City | 6.8% | 6.9%(-0.093)#44 | 7.6%(-0.868)#7,582 |
| 45. | Summerlin South | 6.8% | 6.9%(-0.099)#45 | 7.6%(-0.874)#7,596 |
| 46. | Zephyr Cove | 6.7% | 6.9%(-0.206)#46 | 7.6%(-0.981)#7,739 |
| 47. | Boulder City | 6.4% | 6.9%(-0.438)#47 | 7.6%(-1.21)#8,098 |
| 48. | Spanish Springs | 6.3% | 6.9%(-0.599)#48 | 7.6%(-1.37)#8,346 |
| 49. | Winchester | 6.2% | 6.9%(-0.661)#49 | 7.6%(-1.44)#8,476 |
| 50. | Henderson | 6.2% | 6.9%(-0.687)#50 | 7.6%(-1.46)#8,528 |
| 51. | Las Vegas | 6.0% | 6.9%(-0.826)#51 | 7.6%(-1.60)#8,769 |
| 52. | Spring Valley | 6.0% | 6.9%(-0.845)#52 | 7.6%(-1.62)#8,791 |
| 53. | Lemmon Valley | 6.0% | 6.9%(-0.870)#53 | 7.6%(-1.64)#8,826 |
| 54. | North Las Vegas | 5.9% | 6.9%(-0.981)#54 | 7.6%(-1.76)#8,992 |
| 55. | Johnson Lane | 5.9% | 6.9%(-1.00)#55 | 7.6%(-1.78)#9,055 |
| 56. | Pahrump | 5.9% | 6.9%(-1.01)#56 | 7.6%(-1.78)#9,062 |
| 57. | Whitney | 5.7% | 6.9%(-1.21)#57 | 7.6%(-1.98)#9,395 |
| 58. | Sunrise Manor | 5.4% | 6.9%(-1.45)#58 | 7.6%(-2.22)#9,783 |
| 59. | Gardnerville Ranchos | 5.3% | 6.9%(-1.52)#59 | 7.6%(-2.30)#9,927 |
| 60. | Fernley | 5.3% | 6.9%(-1.57)#60 | 7.6%(-2.34)#10,002 |
| 61. | Moapa Valley | 5.3% | 6.9%(-1.60)#61 | 7.6%(-2.37)#10,049 |
| 62. | Lovelock | 4.7% | 6.9%(-2.19)#62 | 7.6%(-2.97)#11,099 |
| 63. | Fallon Station | 4.5% | 6.9%(-2.41)#63 | 7.6%(-3.18)#11,495 |
| 64. | Topaz Ranch Estates | 4.2% | 6.9%(-2.66)#64 | 7.6%(-3.44)#11,924 |
| 65. | Mcgill | 4.2% | 6.9%(-2.66)#65 | 7.6%(-3.44)#11,930 |
| 66. | Cold Springs | 4.2% | 6.9%(-2.71)#66 | 7.6%(-3.48)#12,004 |
| 67. | Ely | 3.9% | 6.9%(-2.93)#67 | 7.6%(-3.70)#12,411 |
| 68. | Washoe Valley | 3.7% | 6.9%(-3.16)#68 | 7.6%(-3.94)#12,808 |
| 69. | Winnemucca | 3.4% | 6.9%(-3.49)#69 | 7.6%(-4.27)#13,428 |
| 70. | Carter Springs | 3.3% | 6.9%(-3.59)#70 | 7.6%(-4.37)#13,601 |
| 71. | Laughlin | 3.3% | 6.9%(-3.62)#71 | 7.6%(-4.39)#13,635 |
| 72. | Gardnerville | 3.2% | 6.9%(-3.68)#72 | 7.6%(-4.45)#13,735 |
| 73. | Fish Springs | 3.2% | 6.9%(-3.68)#73 | 7.6%(-4.46)#13,743 |
| 74. | Sun Valley | 2.6% | 6.9%(-4.29)#74 | 7.6%(-5.07)#14,761 |
| 75. | Verdi | 2.4% | 6.9%(-4.52)#75 | 7.6%(-5.29)#15,101 |
| 76. | Smith Valley | 1.2% | 6.9%(-5.63)#76 | 7.6%(-6.41)#16,743 |
| 77. | Fallon | 0.90% | 6.9%(-5.97)#77 | 7.6%(-6.74)#17,090 |
| 78. | Golden Valley | 0.75% | 6.9%(-6.12)#78 | 7.6%(-6.89)#17,203 |
1
2Common Questions
What are the Top 10 Cities with the Highest Percentage of Population with a Degree in Engineering in Nevada?
Top 10 Cities with the Highest Percentage of Population with a Degree in Engineering in Nevada are:
#1
100.0%
#2
40.4%
#3
38.2%
#4
33.3%
#5
29.9%
#6
25.1%
#7
22.2%
#8
20.9%
#9
20.0%
#10
17.4%
What city has the Highest Percentage of Population with a Degree in Engineering in Nevada?
Silver Peak has the Highest Percentage of Population with a Degree in Engineering in Nevada with 100.0%.
What is the Percentage of Population with a Degree in Engineering in the State of Nevada?
Percentage of Population with a Degree in Engineering in Nevada is 6.9%.
What is the Percentage of Population with a Degree in Engineering in the United States?
Percentage of Population with a Degree in Engineering in the United States is 7.6%.