Cities with the Highest Percentage of Population with a Degree in Engineering in Connecticut
RELATED REPORTS & OPTIONS
Engineering
Connecticut
Compare Cities
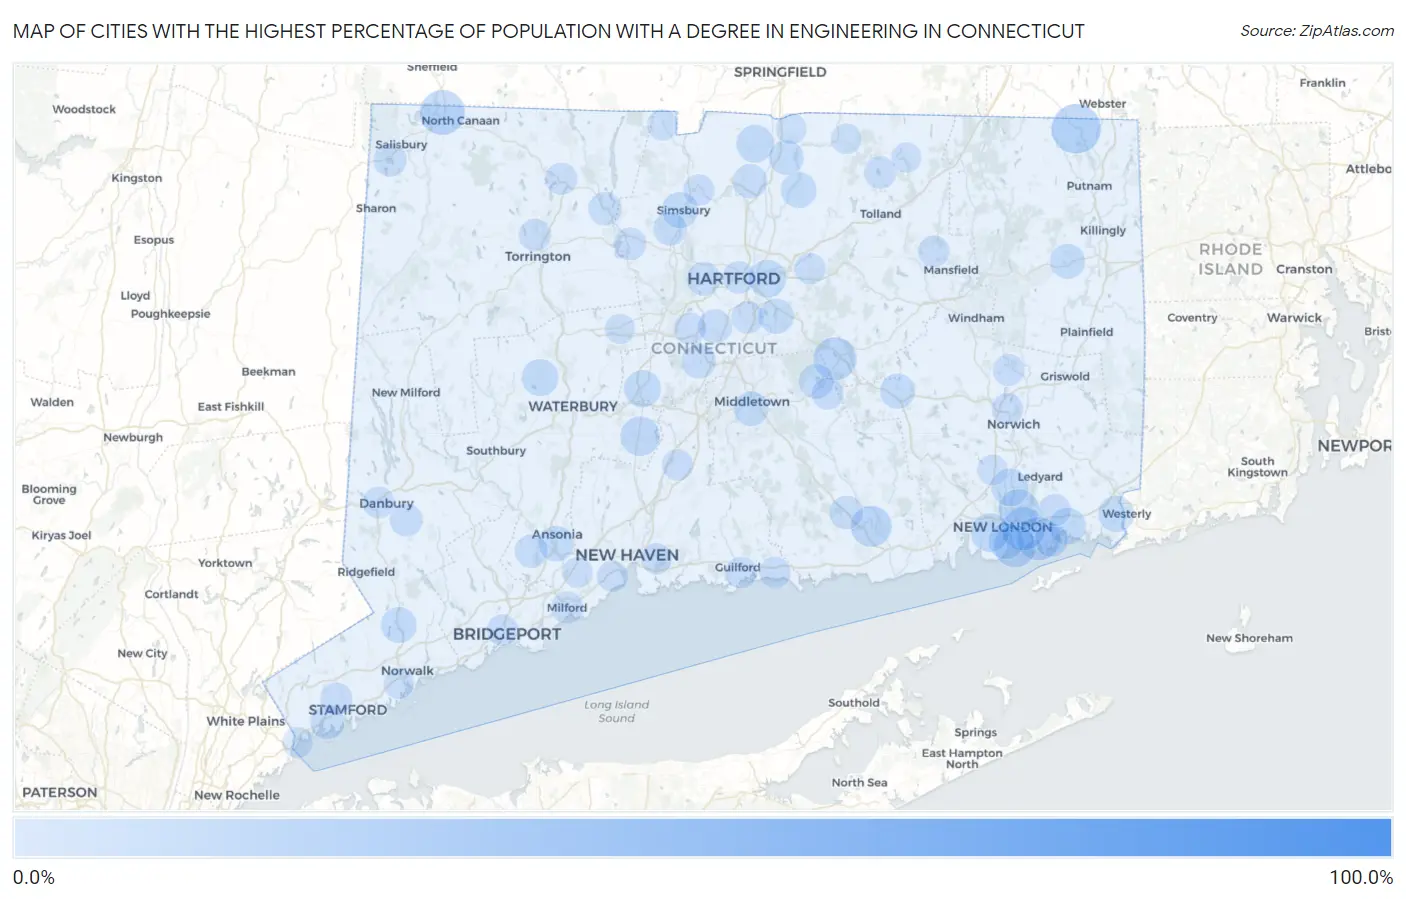
Map of Cities with the Highest Percentage of Population with a Degree in Engineering in Connecticut
0.0%
100.0%
Cities with the Highest Percentage of Population with a Degree in Engineering in Connecticut
| City | % Graduates | vs State | vs National | |
| 1. | Fairfield University | 100.0% | 7.4%(+92.6)#1 | 7.6%(+92.4)#1 |
| 2. | Lake Bungee | 27.2% | 7.4%(+19.8)#2 | 7.6%(+19.5)#556 |
| 3. | Quinebaug | 23.2% | 7.4%(+15.8)#3 | 7.6%(+15.5)#770 |
| 4. | Canaan | 18.9% | 7.4%(+11.6)#4 | 7.6%(+11.3)#1,167 |
| 5. | Poquonock Bridge | 17.4% | 7.4%(+10.0)#5 | 7.6%(+9.74)#1,370 |
| 6. | Bantam Borough | 17.4% | 7.4%(+9.97)#6 | 7.6%(+9.71)#1,385 |
| 7. | Long Hill | 17.3% | 7.4%(+9.89)#7 | 7.6%(+9.63)#1,400 |
| 8. | Terramuggus | 17.3% | 7.4%(+9.88)#8 | 7.6%(+9.63)#1,402 |
| 9. | Weston | 17.2% | 7.4%(+9.81)#9 | 7.6%(+9.55)#1,409 |
| 10. | Groton | 16.6% | 7.4%(+9.17)#10 | 7.6%(+8.91)#1,553 |
| 11. | Conning Towers Nautilus Park | 15.6% | 7.4%(+8.20)#11 | 7.6%(+7.94)#1,751 |
| 12. | Essex Village | 15.5% | 7.4%(+8.15)#12 | 7.6%(+7.89)#1,765 |
| 13. | Cheshire Village | 14.0% | 7.4%(+6.62)#13 | 7.6%(+6.36)#2,142 |
| 14. | Waterford | 13.1% | 7.4%(+5.76)#14 | 7.6%(+5.50)#2,430 |
| 15. | Candlewood Knolls | 12.9% | 7.4%(+5.55)#15 | 7.6%(+5.29)#2,521 |
| 16. | South Wilton | 12.7% | 7.4%(+5.35)#16 | 7.6%(+5.09)#2,583 |
| 17. | Suffield Depot | 12.2% | 7.4%(+4.86)#17 | 7.6%(+4.60)#2,792 |
| 18. | East Hartford | 12.2% | 7.4%(+4.82)#18 | 7.6%(+4.56)#2,808 |
| 19. | Gales Ferry | 12.2% | 7.4%(+4.77)#19 | 7.6%(+4.51)#2,822 |
| 20. | Plantsville | 12.0% | 7.4%(+4.60)#20 | 7.6%(+4.34)#2,895 |
| 21. | Mystic | 11.8% | 7.4%(+4.42)#21 | 7.6%(+4.16)#2,980 |
| 22. | Watertown | 11.6% | 7.4%(+4.20)#22 | 7.6%(+3.94)#3,078 |
| 23. | Murray | 11.2% | 7.4%(+3.85)#23 | 7.6%(+3.59)#3,255 |
| 24. | Sacred Heart University | 11.1% | 7.4%(+3.72)#24 | 7.6%(+3.46)#3,322 |
| 25. | Pawcatuck | 10.9% | 7.4%(+3.53)#25 | 7.6%(+3.27)#3,454 |
| 26. | Indian Field | 10.9% | 7.4%(+3.48)#26 | 7.6%(+3.22)#3,485 |
| 27. | Simsbury Center | 10.8% | 7.4%(+3.41)#27 | 7.6%(+3.15)#3,521 |
| 28. | Gaylordsville | 10.7% | 7.4%(+3.29)#28 | 7.6%(+3.03)#3,604 |
| 29. | Wilton Center | 10.6% | 7.4%(+3.22)#29 | 7.6%(+2.96)#3,638 |
| 30. | New London | 10.6% | 7.4%(+3.21)#30 | 7.6%(+2.95)#3,647 |
| 31. | Broad Brook | 10.6% | 7.4%(+3.19)#31 | 7.6%(+2.93)#3,665 |
| 32. | Daniels Farm | 10.3% | 7.4%(+2.95)#32 | 7.6%(+2.69)#3,840 |
| 33. | Derby | 10.3% | 7.4%(+2.91)#33 | 7.6%(+2.65)#3,877 |
| 34. | Glastonbury Center | 10.2% | 7.4%(+2.78)#34 | 7.6%(+2.52)#3,960 |
| 35. | Colchester | 10.0% | 7.4%(+2.60)#35 | 7.6%(+2.34)#4,110 |
| 36. | Brooklyn | 9.9% | 7.4%(+2.53)#36 | 7.6%(+2.27)#4,154 |
| 37. | Lake Pocotopaug | 9.9% | 7.4%(+2.49)#37 | 7.6%(+2.23)#4,180 |
| 38. | Middletown | 9.8% | 7.4%(+2.43)#38 | 7.6%(+2.17)#4,241 |
| 39. | Southwood Acres | 9.6% | 7.4%(+2.22)#39 | 7.6%(+1.96)#4,378 |
| 40. | Kensington | 9.4% | 7.4%(+2.01)#40 | 7.6%(+1.75)#4,550 |
| 41. | Windsor Locks | 9.4% | 7.4%(+1.98)#41 | 7.6%(+1.72)#4,579 |
| 42. | Riverside | 9.1% | 7.4%(+1.67)#42 | 7.6%(+1.41)#4,846 |
| 43. | West Hartford | 9.0% | 7.4%(+1.63)#43 | 7.6%(+1.37)#4,890 |
| 44. | Northford | 9.0% | 7.4%(+1.61)#44 | 7.6%(+1.35)#4,913 |
| 45. | Newington | 8.8% | 7.4%(+1.40)#45 | 7.6%(+1.14)#5,126 |
| 46. | Weatogue | 8.5% | 7.4%(+1.14)#46 | 7.6%(+0.884)#5,368 |
| 47. | Deep River Center | 8.5% | 7.4%(+1.14)#47 | 7.6%(+0.876)#5,374 |
| 48. | Noank | 8.5% | 7.4%(+1.12)#48 | 7.6%(+0.863)#5,382 |
| 49. | New Hartford Center | 8.4% | 7.4%(+1.01)#49 | 7.6%(+0.746)#5,497 |
| 50. | Lakeville | 8.3% | 7.4%(+0.893)#50 | 7.6%(+0.633)#5,637 |
| 51. | Shelton | 8.1% | 7.4%(+0.725)#51 | 7.6%(+0.466)#5,824 |
| 52. | Bethel | 8.0% | 7.4%(+0.594)#52 | 7.6%(+0.334)#5,993 |
| 53. | Noroton Heights | 8.0% | 7.4%(+0.585)#53 | 7.6%(+0.325)#5,999 |
| 54. | Bridgewater | 7.8% | 7.4%(+0.404)#54 | 7.6%(+0.145)#6,217 |
| 55. | Collinsville | 7.8% | 7.4%(+0.403)#55 | 7.6%(+0.143)#6,218 |
| 56. | Crystal Lake | 7.6% | 7.4%(+0.224)#56 | 7.6%(-0.036)#6,462 |
| 57. | Hartford | 7.6% | 7.4%(+0.211)#57 | 7.6%(-0.049)#6,480 |
| 58. | Plattsville | 7.6% | 7.4%(+0.184)#58 | 7.6%(-0.076)#6,512 |
| 59. | Torrington | 7.6% | 7.4%(+0.165)#59 | 7.6%(-0.095)#6,532 |
| 60. | Stamford | 7.5% | 7.4%(+0.151)#60 | 7.6%(-0.109)#6,547 |
| 61. | Wethersfield | 7.5% | 7.4%(+0.083)#61 | 7.6%(-0.176)#6,633 |
| 62. | Winsted | 7.4% | 7.4%(-0.000)#62 | 7.6%(-0.260)#6,739 |
| 63. | Old Mystic | 7.3% | 7.4%(-0.105)#63 | 7.6%(-0.365)#6,881 |
| 64. | Milford City Balance | 7.3% | 7.4%(-0.118)#64 | 7.6%(-0.378)#6,898 |
| 65. | New Britain | 7.2% | 7.4%(-0.172)#65 | 7.6%(-0.432)#6,970 |
| 66. | Trumbull Center | 7.0% | 7.4%(-0.368)#66 | 7.6%(-0.628)#7,241 |
| 67. | Danbury | 7.0% | 7.4%(-0.373)#67 | 7.6%(-0.632)#7,251 |
| 68. | East Hampton | 6.9% | 7.4%(-0.487)#68 | 7.6%(-0.747)#7,410 |
| 69. | Baltic | 6.8% | 7.4%(-0.538)#69 | 7.6%(-0.798)#7,477 |
| 70. | East | 6.8% | 7.4%(-0.565)#70 | 7.6%(-0.825)#7,515 |
| 71. | Guilford Center | 6.7% | 7.4%(-0.671)#71 | 7.6%(-0.930)#7,668 |
| 72. | Groton Long Point Borough | 6.7% | 7.4%(-0.685)#72 | 7.6%(-0.945)#7,681 |
| 73. | Storrs | 6.7% | 7.4%(-0.706)#73 | 7.6%(-0.966)#7,703 |
| 74. | Madison Center | 6.7% | 7.4%(-0.706)#74 | 7.6%(-0.966)#7,705 |
| 75. | Norwich | 6.7% | 7.4%(-0.733)#75 | 7.6%(-0.993)#7,773 |
| 76. | Bridgeport | 6.6% | 7.4%(-0.806)#76 | 7.6%(-1.07)#7,870 |
| 77. | Wallingford Center | 6.5% | 7.4%(-0.849)#77 | 7.6%(-1.11)#7,936 |
| 78. | Staples | 6.5% | 7.4%(-0.869)#78 | 7.6%(-1.13)#7,968 |
| 79. | Tariffville | 6.5% | 7.4%(-0.894)#79 | 7.6%(-1.15)#7,996 |
| 80. | Stepney | 6.4% | 7.4%(-0.974)#80 | 7.6%(-1.23)#8,124 |
| 81. | West Haven | 6.4% | 7.4%(-1.03)#81 | 7.6%(-1.29)#8,213 |
| 82. | Stratford Downtown | 6.3% | 7.4%(-1.04)#82 | 7.6%(-1.30)#8,232 |
| 83. | East Haven | 6.3% | 7.4%(-1.07)#83 | 7.6%(-1.33)#8,281 |
| 84. | Manchester | 6.3% | 7.4%(-1.08)#84 | 7.6%(-1.34)#8,298 |
| 85. | North Granby | 6.3% | 7.4%(-1.11)#85 | 7.6%(-1.37)#8,336 |
| 86. | Noroton | 6.2% | 7.4%(-1.15)#86 | 7.6%(-1.41)#8,439 |
| 87. | Bigelow Corners | 6.2% | 7.4%(-1.16)#87 | 7.6%(-1.42)#8,456 |
| 88. | Byram | 6.2% | 7.4%(-1.17)#88 | 7.6%(-1.43)#8,463 |
| 89. | Saugatuck | 6.2% | 7.4%(-1.18)#89 | 7.6%(-1.44)#8,477 |
| 90. | Westport | 6.1% | 7.4%(-1.32)#90 | 7.6%(-1.58)#8,713 |
| 91. | Oxoboxo River | 6.0% | 7.4%(-1.34)#91 | 7.6%(-1.60)#8,772 |
| 92. | Sherwood Manor | 6.0% | 7.4%(-1.36)#92 | 7.6%(-1.62)#8,804 |
| 93. | Orange | 6.0% | 7.4%(-1.43)#93 | 7.6%(-1.69)#8,890 |
| 94. | Old Hill | 5.8% | 7.4%(-1.60)#94 | 7.6%(-1.86)#9,166 |
| 95. | Naugatuck Borough | 5.8% | 7.4%(-1.62)#95 | 7.6%(-1.88)#9,212 |
| 96. | Somers | 5.7% | 7.4%(-1.69)#96 | 7.6%(-1.95)#9,311 |
| 97. | Norwalk | 5.6% | 7.4%(-1.75)#97 | 7.6%(-2.01)#9,446 |
| 98. | Compo | 5.6% | 7.4%(-1.83)#98 | 7.6%(-2.09)#9,548 |
| 99. | Bristol | 5.5% | 7.4%(-1.87)#99 | 7.6%(-2.13)#9,631 |
| 100. | Stafford Springs | 5.5% | 7.4%(-1.88)#100 | 7.6%(-2.14)#9,641 |
Common Questions
What are the Top 10 Cities with the Highest Percentage of Population with a Degree in Engineering in Connecticut?
Top 10 Cities with the Highest Percentage of Population with a Degree in Engineering in Connecticut are:
#1
23.2%
#2
18.9%
#3
17.4%
#4
17.3%
#5
17.3%
#6
16.6%
#7
15.6%
#8
15.5%
#9
14.0%
#10
13.1%
What city has the Highest Percentage of Population with a Degree in Engineering in Connecticut?
Quinebaug has the Highest Percentage of Population with a Degree in Engineering in Connecticut with 23.2%.
What is the Percentage of Population with a Degree in Engineering in the State of Connecticut?
Percentage of Population with a Degree in Engineering in Connecticut is 7.4%.
What is the Percentage of Population with a Degree in Engineering in the United States?
Percentage of Population with a Degree in Engineering in the United States is 7.6%.