Cities with the Highest Percentage of Population with a Degree in Engineering in Iowa
RELATED REPORTS & OPTIONS
Engineering
Iowa
Compare Cities
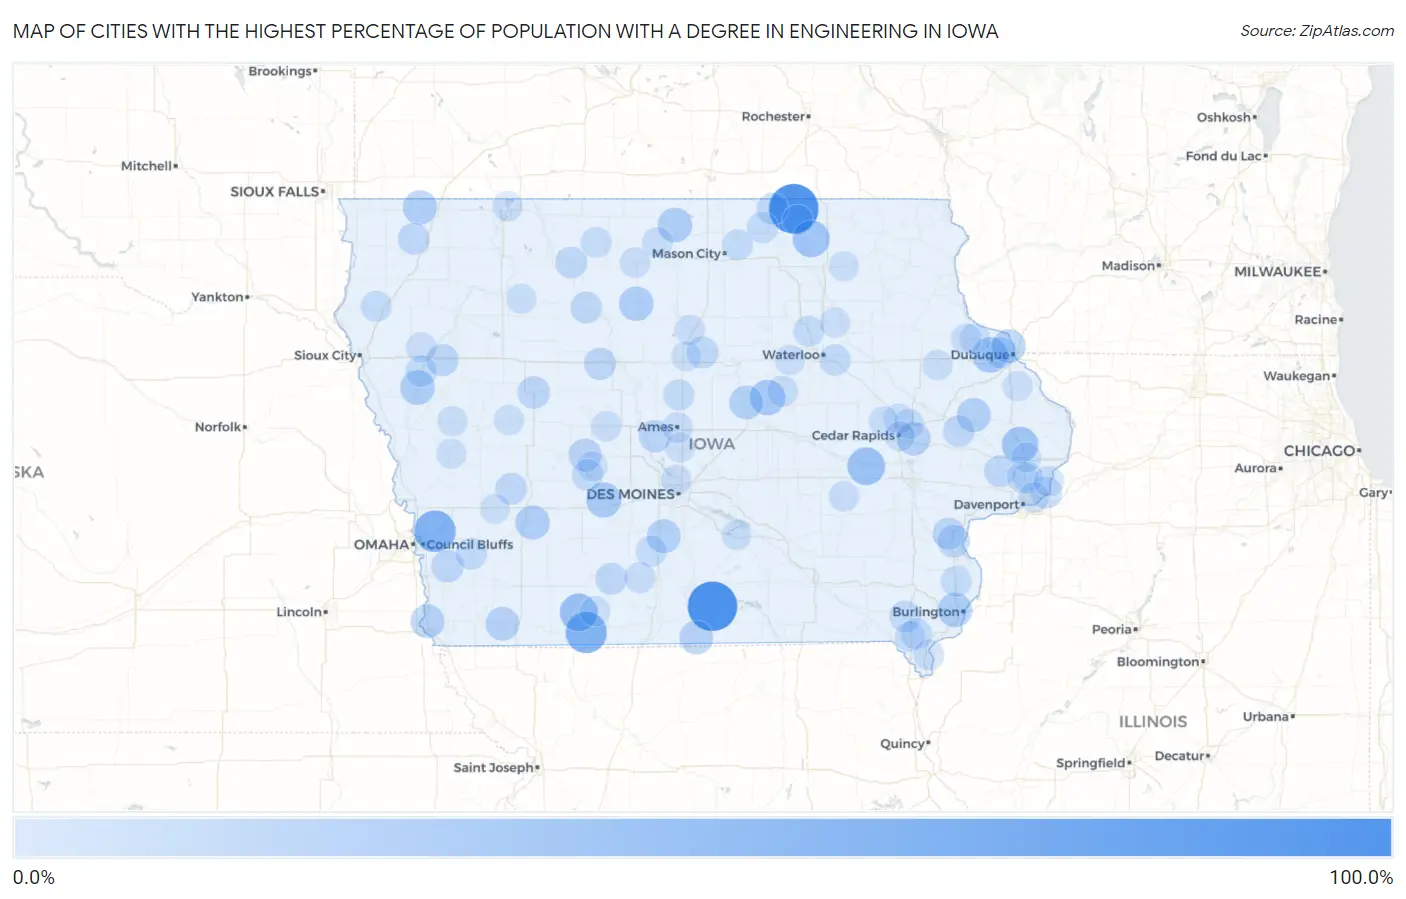
Map of Cities with the Highest Percentage of Population with a Degree in Engineering in Iowa
0.0%
100.0%
Cities with the Highest Percentage of Population with a Degree in Engineering in Iowa
| City | % Graduates | vs State | vs National | |
| 1. | Mcintire | 100.0% | 5.6%(+94.4)#1 | 7.6%(+92.4)#40 |
| 2. | Millerton | 100.0% | 5.6%(+94.4)#2 | 7.6%(+92.4)#54 |
| 3. | Weston | 61.4% | 5.6%(+55.8)#3 | 7.6%(+53.7)#113 |
| 4. | Maloy | 60.0% | 5.6%(+54.4)#4 | 7.6%(+52.4)#125 |
| 5. | Clearfield | 44.2% | 5.6%(+38.7)#5 | 7.6%(+36.6)#221 |
| 6. | South Amana | 43.2% | 5.6%(+37.6)#6 | 7.6%(+35.5)#227 |
| 7. | Elma | 40.0% | 5.6%(+34.4)#7 | 7.6%(+32.4)#264 |
| 8. | Welton | 37.5% | 5.6%(+31.9)#8 | 7.6%(+29.9)#297 |
| 9. | Beaman | 33.3% | 5.6%(+27.8)#9 | 7.6%(+25.7)#369 |
| 10. | Graf | 33.3% | 5.6%(+27.8)#10 | 7.6%(+25.7)#378 |
| 11. | Diamondhead Lake | 31.5% | 5.6%(+25.9)#11 | 7.6%(+23.8)#404 |
| 12. | Oto | 29.4% | 5.6%(+23.9)#12 | 7.6%(+21.8)#463 |
| 13. | West Burlington | 28.8% | 5.6%(+23.3)#13 | 7.6%(+21.2)#478 |
| 14. | Renwick | 28.6% | 5.6%(+23.0)#14 | 7.6%(+20.9)#490 |
| 15. | Leland | 28.6% | 5.6%(+23.0)#15 | 7.6%(+20.9)#491 |
| 16. | Wiota | 27.3% | 5.6%(+21.7)#16 | 7.6%(+19.6)#551 |
| 17. | Little Rock | 27.0% | 5.6%(+21.5)#17 | 7.6%(+19.4)#559 |
| 18. | Onslow | 26.3% | 5.6%(+20.8)#18 | 7.6%(+18.7)#584 |
| 19. | St Marys | 26.1% | 5.6%(+20.5)#19 | 7.6%(+18.4)#597 |
| 20. | Sageville | 26.1% | 5.6%(+20.5)#20 | 7.6%(+18.4)#598 |
| 21. | Liscomb | 25.9% | 5.6%(+20.4)#21 | 7.6%(+18.3)#601 |
| 22. | Percival | 25.0% | 5.6%(+19.4)#22 | 7.6%(+17.4)#669 |
| 23. | Clio | 25.0% | 5.6%(+19.4)#23 | 7.6%(+17.4)#679 |
| 24. | Yorktown | 25.0% | 5.6%(+19.4)#24 | 7.6%(+17.4)#680 |
| 25. | Bertram | 24.6% | 5.6%(+19.0)#25 | 7.6%(+16.9)#694 |
| 26. | Bagley | 21.1% | 5.6%(+15.5)#26 | 7.6%(+13.4)#938 |
| 27. | Grandview | 20.0% | 5.6%(+14.4)#27 | 7.6%(+12.4)#1,039 |
| 28. | Luther | 19.2% | 5.6%(+13.7)#28 | 7.6%(+11.6)#1,141 |
| 29. | Auburn | 19.2% | 5.6%(+13.7)#29 | 7.6%(+11.6)#1,142 |
| 30. | Silver City | 19.0% | 5.6%(+13.5)#30 | 7.6%(+11.4)#1,155 |
| 31. | Cushing | 18.2% | 5.6%(+12.6)#31 | 7.6%(+10.5)#1,266 |
| 32. | Moorland | 18.2% | 5.6%(+12.6)#32 | 7.6%(+10.5)#1,270 |
| 33. | Letts | 17.9% | 5.6%(+12.3)#33 | 7.6%(+10.2)#1,307 |
| 34. | Oak Hills | 17.5% | 5.6%(+12.0)#34 | 7.6%(+9.90)#1,347 |
| 35. | Matlock | 17.4% | 5.6%(+11.8)#35 | 7.6%(+9.74)#1,382 |
| 36. | Alden | 17.0% | 5.6%(+11.4)#36 | 7.6%(+9.35)#1,445 |
| 37. | Afton | 16.9% | 5.6%(+11.3)#37 | 7.6%(+9.21)#1,469 |
| 38. | Le Claire | 16.7% | 5.6%(+11.1)#38 | 7.6%(+9.05)#1,494 |
| 39. | Kimballton | 16.7% | 5.6%(+11.1)#39 | 7.6%(+9.02)#1,520 |
| 40. | Bradgate | 16.7% | 5.6%(+11.1)#40 | 7.6%(+9.02)#1,529 |
| 41. | Cylinder | 16.7% | 5.6%(+11.1)#41 | 7.6%(+9.02)#1,536 |
| 42. | Stacyville | 16.2% | 5.6%(+10.7)#42 | 7.6%(+8.57)#1,618 |
| 43. | Olin | 16.0% | 5.6%(+10.4)#43 | 7.6%(+8.35)#1,648 |
| 44. | Dixon | 16.0% | 5.6%(+10.4)#44 | 7.6%(+8.35)#1,652 |
| 45. | Houghton | 15.8% | 5.6%(+10.2)#45 | 7.6%(+8.14)#1,710 |
| 46. | Raymond | 15.2% | 5.6%(+9.68)#46 | 7.6%(+7.59)#1,821 |
| 47. | Asbury | 15.1% | 5.6%(+9.58)#47 | 7.6%(+7.49)#1,843 |
| 48. | Anthon | 14.9% | 5.6%(+9.29)#48 | 7.6%(+7.20)#1,901 |
| 49. | Macedonia | 14.8% | 5.6%(+9.25)#49 | 7.6%(+7.17)#1,910 |
| 50. | Lake Panorama | 14.7% | 5.6%(+9.11)#50 | 7.6%(+7.02)#1,944 |
| 51. | Truro | 14.3% | 5.6%(+8.73)#51 | 7.6%(+6.64)#2,034 |
| 52. | Randall | 14.3% | 5.6%(+8.73)#52 | 7.6%(+6.64)#2,052 |
| 53. | Franklin | 14.3% | 5.6%(+8.73)#53 | 7.6%(+6.64)#2,056 |
| 54. | Mitchell | 14.3% | 5.6%(+8.73)#54 | 7.6%(+6.64)#2,063 |
| 55. | Janesville | 13.4% | 5.6%(+7.81)#55 | 7.6%(+5.72)#2,351 |
| 56. | Brunsville | 13.3% | 5.6%(+7.77)#56 | 7.6%(+5.69)#2,376 |
| 57. | Rock Falls | 13.3% | 5.6%(+7.77)#57 | 7.6%(+5.69)#2,379 |
| 58. | Long Grove | 13.2% | 5.6%(+7.68)#58 | 7.6%(+5.59)#2,398 |
| 59. | Mediapolis | 13.1% | 5.6%(+7.51)#59 | 7.6%(+5.43)#2,455 |
| 60. | Crystal Lake | 12.5% | 5.6%(+6.94)#60 | 7.6%(+4.85)#2,688 |
| 61. | Lincoln | 12.5% | 5.6%(+6.94)#61 | 7.6%(+4.85)#2,706 |
| 62. | Lone Rock | 12.5% | 5.6%(+6.94)#62 | 7.6%(+4.85)#2,707 |
| 63. | Murray | 12.3% | 5.6%(+6.79)#63 | 7.6%(+4.70)#2,755 |
| 64. | Montrose | 12.3% | 5.6%(+6.75)#64 | 7.6%(+4.66)#2,773 |
| 65. | Park View | 12.2% | 5.6%(+6.68)#65 | 7.6%(+4.59)#2,798 |
| 66. | Holy Cross | 11.9% | 5.6%(+6.34)#66 | 7.6%(+4.26)#2,933 |
| 67. | Bettendorf | 11.4% | 5.6%(+5.88)#67 | 7.6%(+3.79)#3,149 |
| 68. | Grand Junction | 11.4% | 5.6%(+5.80)#68 | 7.6%(+3.72)#3,188 |
| 69. | Princeton | 11.2% | 5.6%(+5.63)#69 | 7.6%(+3.54)#3,281 |
| 70. | Donnellson | 11.2% | 5.6%(+5.62)#70 | 7.6%(+3.53)#3,289 |
| 71. | Kent Estates | 11.1% | 5.6%(+5.56)#71 | 7.6%(+3.48)#3,308 |
| 72. | Saylorville | 11.1% | 5.6%(+5.55)#72 | 7.6%(+3.46)#3,317 |
| 73. | Ames | 11.0% | 5.6%(+5.40)#73 | 7.6%(+3.31)#3,430 |
| 74. | Delhi | 10.8% | 5.6%(+5.28)#74 | 7.6%(+3.20)#3,498 |
| 75. | Millersburg | 10.8% | 5.6%(+5.25)#75 | 7.6%(+3.16)#3,514 |
| 76. | Robins | 10.8% | 5.6%(+5.24)#76 | 7.6%(+3.16)#3,517 |
| 77. | Pierson | 10.5% | 5.6%(+4.97)#77 | 7.6%(+2.88)#3,705 |
| 78. | Wesley | 10.3% | 5.6%(+4.78)#78 | 7.6%(+2.70)#3,834 |
| 79. | Palo | 10.3% | 5.6%(+4.77)#79 | 7.6%(+2.68)#3,848 |
| 80. | Dows | 10.2% | 5.6%(+4.61)#80 | 7.6%(+2.52)#3,956 |
| 81. | Westside | 10.2% | 5.6%(+4.61)#81 | 7.6%(+2.52)#3,958 |
| 82. | Riceville | 10.1% | 5.6%(+4.57)#82 | 7.6%(+2.49)#3,981 |
| 83. | Knoxville | 10.1% | 5.6%(+4.55)#83 | 7.6%(+2.46)#4,003 |
| 84. | Charter Oak | 10.0% | 5.6%(+4.44)#84 | 7.6%(+2.35)#4,077 |
| 85. | Luxemburg | 10.0% | 5.6%(+4.44)#85 | 7.6%(+2.35)#4,091 |
| 86. | Marathon | 10.0% | 5.6%(+4.44)#86 | 7.6%(+2.35)#4,094 |
| 87. | Marion | 10.0% | 5.6%(+4.44)#87 | 7.6%(+2.35)#4,106 |
| 88. | Dike | 9.9% | 5.6%(+4.36)#88 | 7.6%(+2.27)#4,153 |
| 89. | Readlyn | 9.9% | 5.6%(+4.33)#89 | 7.6%(+2.24)#4,174 |
| 90. | Williams | 9.5% | 5.6%(+3.96)#90 | 7.6%(+1.88)#4,452 |
| 91. | Yale | 9.5% | 5.6%(+3.96)#91 | 7.6%(+1.88)#4,453 |
| 92. | La Motte | 9.5% | 5.6%(+3.96)#92 | 7.6%(+1.88)#4,454 |
| 93. | Dunlap | 9.4% | 5.6%(+3.88)#93 | 7.6%(+1.80)#4,516 |
| 94. | Lawler | 9.4% | 5.6%(+3.87)#94 | 7.6%(+1.79)#4,526 |
| 95. | Orleans | 9.4% | 5.6%(+3.83)#95 | 7.6%(+1.74)#4,559 |
| 96. | Dewitt | 9.4% | 5.6%(+3.82)#96 | 7.6%(+1.73)#4,565 |
| 97. | Diagonal | 9.4% | 5.6%(+3.81)#97 | 7.6%(+1.73)#4,569 |
| 98. | Huxley | 9.3% | 5.6%(+3.75)#98 | 7.6%(+1.66)#4,622 |
| 99. | Walnut | 9.2% | 5.6%(+3.67)#99 | 7.6%(+1.58)#4,689 |
| 100. | Cedar Rapids | 9.2% | 5.6%(+3.59)#100 | 7.6%(+1.50)#4,756 |
Common Questions
What are the Top 10 Cities with the Highest Percentage of Population with a Degree in Engineering in Iowa?
Top 10 Cities with the Highest Percentage of Population with a Degree in Engineering in Iowa are:
#1
100.0%
#2
100.0%
#3
61.4%
#4
60.0%
#5
44.2%
#6
43.2%
#7
40.0%
#8
37.5%
#9
33.3%
#10
33.3%
What city has the Highest Percentage of Population with a Degree in Engineering in Iowa?
McIntire has the Highest Percentage of Population with a Degree in Engineering in Iowa with 100.0%.
What is the Percentage of Population with a Degree in Engineering in the State of Iowa?
Percentage of Population with a Degree in Engineering in Iowa is 5.6%.
What is the Percentage of Population with a Degree in Engineering in the United States?
Percentage of Population with a Degree in Engineering in the United States is 7.6%.