Sun Village, CA Map & Demographics
Sun Village Map
Sun Village Overview
$20,973
PER CAPITA INCOME
$65,316
AVG FAMILY INCOME
$66,158
AVG HOUSEHOLD INCOME
10.1%
WAGE / INCOME GAP [ % ]
89.9¢/ $1
WAGE / INCOME GAP [ $ ]
$16,118
FAMILY INCOME DEFICIT
0.39
INEQUALITY / GINI INDEX
11,472
TOTAL POPULATION
5,745
MALE POPULATION
5,727
FEMALE POPULATION
100.31
MALES / 100 FEMALES
99.69
FEMALES / 100 MALES
36.9
MEDIAN AGE
4.1
AVG FAMILY SIZE
3.6
AVG HOUSEHOLD SIZE
4,530
LABOR FORCE [ PEOPLE ]
52.8%
PERCENT IN LABOR FORCE
7.8%
UNEMPLOYMENT RATE
Sun Village Area Codes
Income in Sun Village
Income Overview in Sun Village
Per Capita Income in Sun Village is $20,973, while median incomes of families and households are $65,316 and $66,158 respectively.
| Characteristic | Number | Measure |
| Per Capita Income | 11,472 | $20,973 |
| Median Family Income | 2,548 | $65,316 |
| Mean Family Income | 2,548 | $71,920 |
| Median Household Income | 3,158 | $66,158 |
| Mean Household Income | 3,158 | $74,416 |
| Income Deficit | 2,548 | $16,118 |
| Wage / Income Gap (%) | 11,472 | 10.08% |
| Wage / Income Gap ($) | 11,472 | 89.92¢ per $1 |
| Gini / Inequality Index | 11,472 | 0.39 |
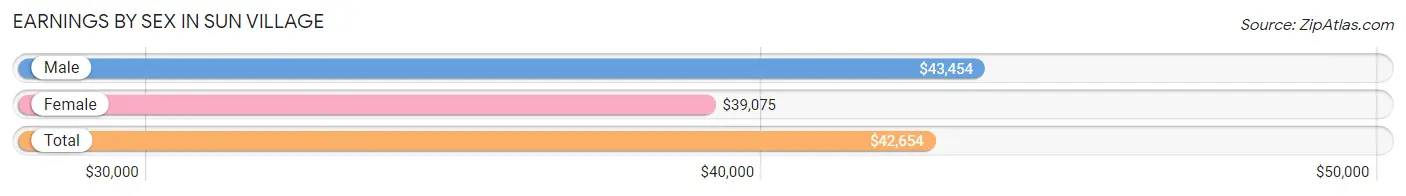
Earnings by Sex in Sun Village
Average Earnings in Sun Village are $42,654, $43,454 for men and $39,075 for women, a difference of 10.1%.
| Sex | Number | Average Earnings |
| Male | 2,889 (65.4%) | $43,454 |
| Female | 1,526 (34.6%) | $39,075 |
| Total | 4,415 (100.0%) | $42,654 |
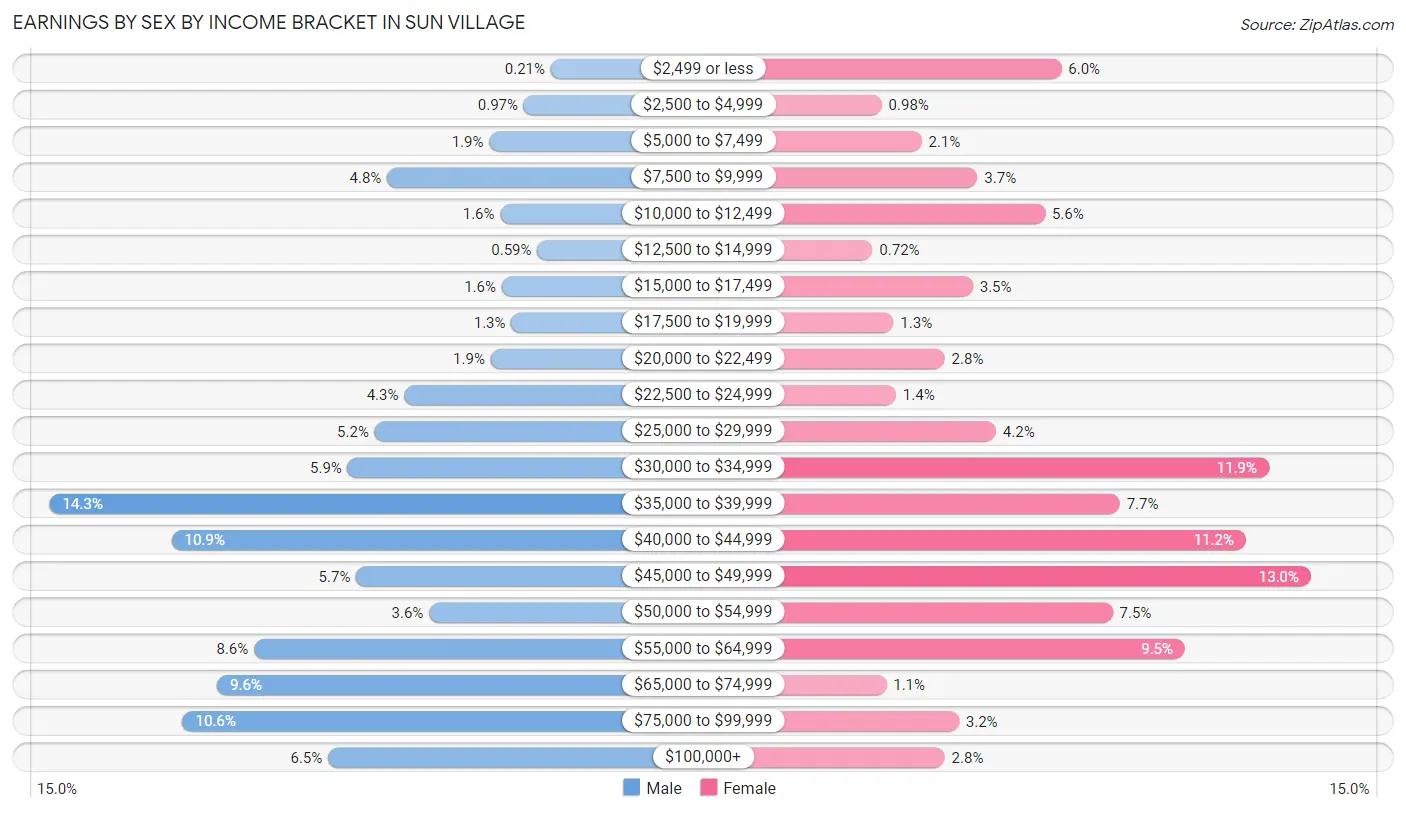
Earnings by Sex by Income Bracket in Sun Village
The most common earnings brackets in Sun Village are $35,000 to $39,999 for men (413 | 14.3%) and $45,000 to $49,999 for women (199 | 13.0%).
| Income | Male | Female |
| $2,499 or less | 6 (0.2%) | 92 (6.0%) |
| $2,500 to $4,999 | 28 (1.0%) | 15 (1.0%) |
| $5,000 to $7,499 | 56 (1.9%) | 32 (2.1%) |
| $7,500 to $9,999 | 139 (4.8%) | 56 (3.7%) |
| $10,000 to $12,499 | 47 (1.6%) | 85 (5.6%) |
| $12,500 to $14,999 | 17 (0.6%) | 11 (0.7%) |
| $15,000 to $17,499 | 46 (1.6%) | 54 (3.5%) |
| $17,500 to $19,999 | 38 (1.3%) | 20 (1.3%) |
| $20,000 to $22,499 | 55 (1.9%) | 42 (2.8%) |
| $22,500 to $24,999 | 125 (4.3%) | 21 (1.4%) |
| $25,000 to $29,999 | 149 (5.2%) | 64 (4.2%) |
| $30,000 to $34,999 | 171 (5.9%) | 181 (11.9%) |
| $35,000 to $39,999 | 413 (14.3%) | 117 (7.7%) |
| $40,000 to $44,999 | 314 (10.9%) | 171 (11.2%) |
| $45,000 to $49,999 | 164 (5.7%) | 199 (13.0%) |
| $50,000 to $54,999 | 105 (3.6%) | 114 (7.5%) |
| $55,000 to $64,999 | 247 (8.6%) | 145 (9.5%) |
| $65,000 to $74,999 | 277 (9.6%) | 17 (1.1%) |
| $75,000 to $99,999 | 305 (10.6%) | 48 (3.2%) |
| $100,000+ | 187 (6.5%) | 42 (2.8%) |
| Total | 2,889 (100.0%) | 1,526 (100.0%) |
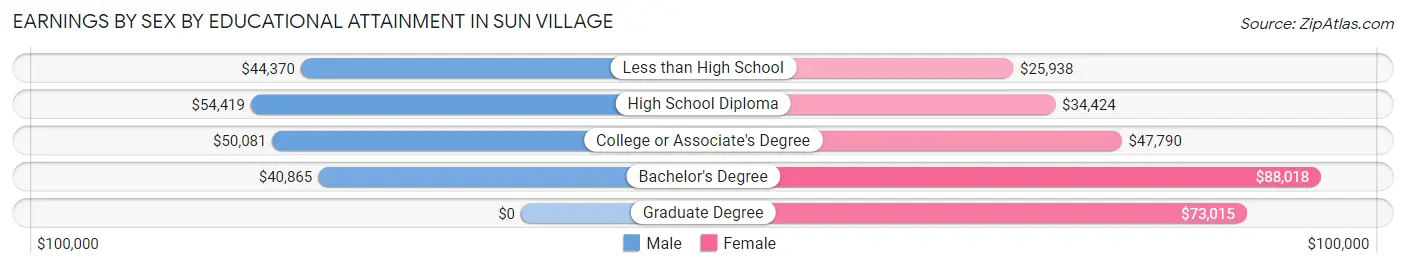
Earnings by Sex by Educational Attainment in Sun Village
Average earnings in Sun Village are $45,509 for men and $43,191 for women, a difference of 5.1%. Men with an educational attainment of high school diploma enjoy the highest average annual earnings of $54,419, while those with bachelor's degree education earn the least with $40,865. Women with an educational attainment of bachelor's degree earn the most with the average annual earnings of $88,018, while those with less than high school education have the smallest earnings of $25,938.
| Educational Attainment | Male Income | Female Income |
| Less than High School | $44,370 | $25,938 |
| High School Diploma | $54,419 | $34,424 |
| College or Associate's Degree | $50,081 | $47,790 |
| Bachelor's Degree | $40,865 | $88,018 |
| Graduate Degree | - | - |
| Total | $45,509 | $43,191 |
Family Income in Sun Village
Family Income Brackets in Sun Village
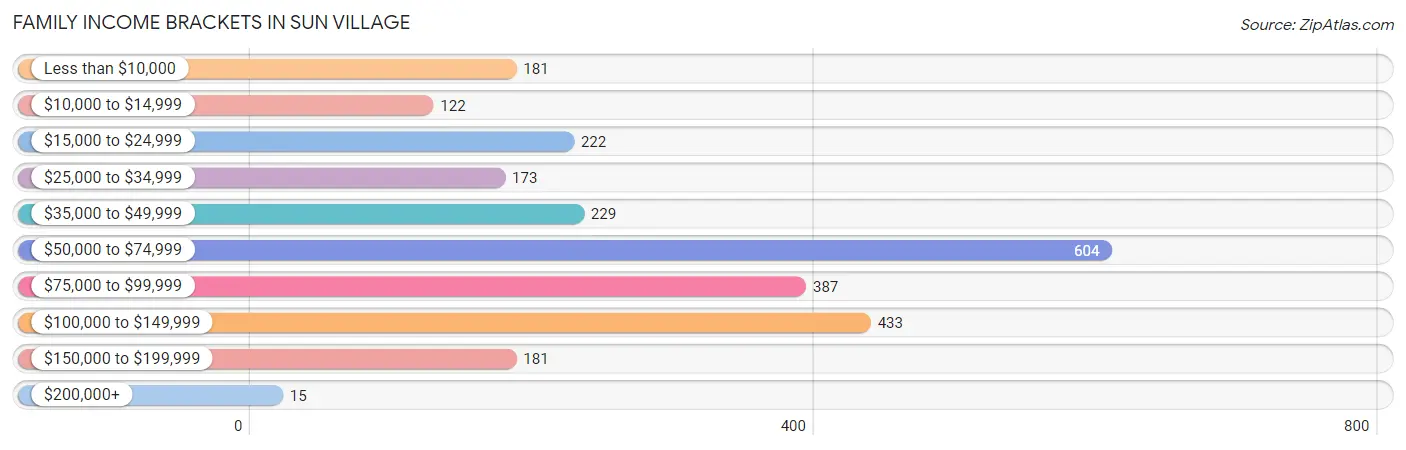
According to the Sun Village family income data, there are 604 families falling into the $50,000 to $74,999 income range, which is the most common income bracket and makes up 23.7% of all families. Conversely, the $200,000+ income bracket is the least frequent group with only 15 families (0.6%) belonging to this category.
| Income Bracket | # Families | % Families |
| Less than $10,000 | 181 | 7.1% |
| $10,000 to $14,999 | 122 | 4.8% |
| $15,000 to $24,999 | 222 | 8.7% |
| $25,000 to $34,999 | 173 | 6.8% |
| $35,000 to $49,999 | 229 | 9.0% |
| $50,000 to $74,999 | 604 | 23.7% |
| $75,000 to $99,999 | 387 | 15.2% |
| $100,000 to $149,999 | 433 | 17.0% |
| $150,000 to $199,999 | 181 | 7.1% |
| $200,000+ | 15 | 0.6% |
Family Income by Famaliy Size in Sun Village
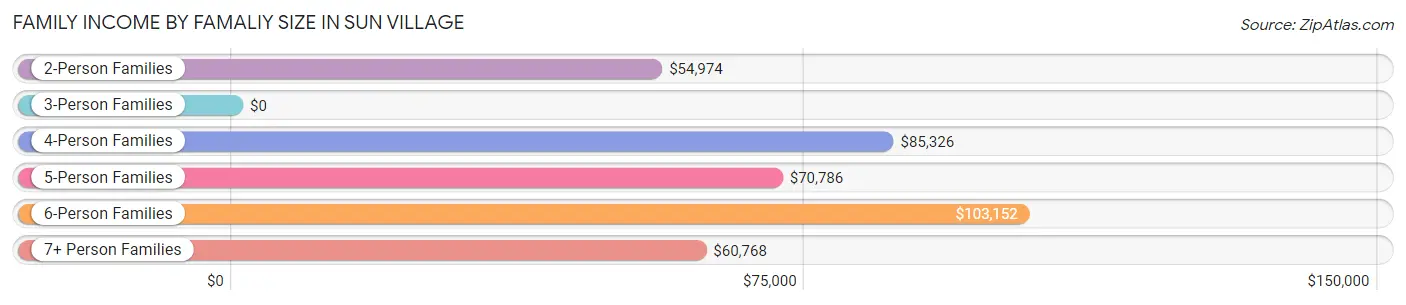
6-person families (204 | 8.0%) account for the highest median family income in Sun Village with $103,152 per family, while 2-person families (867 | 34.0%) have the highest median income of $27,487 per family member.
| Income Bracket | # Families | Median Income |
| 2-Person Families | 867 (34.0%) | $54,974 |
| 3-Person Families | 443 (17.4%) | $0 |
| 4-Person Families | 274 (10.7%) | $85,326 |
| 5-Person Families | 465 (18.2%) | $70,786 |
| 6-Person Families | 204 (8.0%) | $103,152 |
| 7+ Person Families | 295 (11.6%) | $60,768 |
| Total | 2,548 (100.0%) | $65,316 |
Family Income by Number of Earners in Sun Village
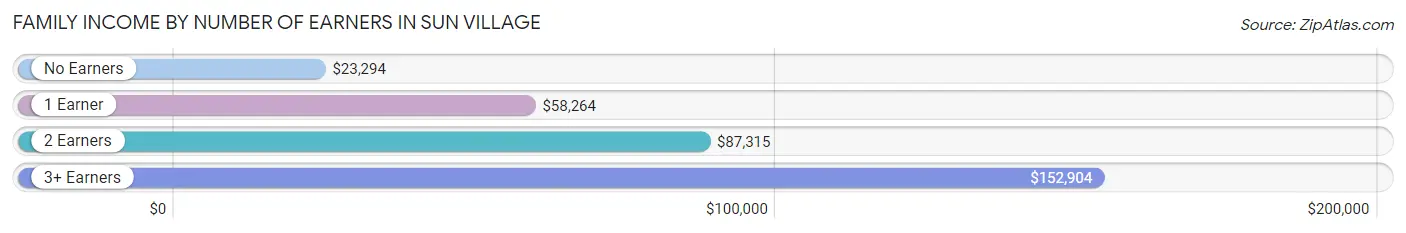
The median family income in Sun Village is $65,316, with families comprising 3+ earners (291) having the highest median family income of $152,904, while families with no earners (482) have the lowest median family income of $23,294, accounting for 11.4% and 18.9% of families, respectively.
| Number of Earners | # Families | Median Income |
| No Earners | 482 (18.9%) | $23,294 |
| 1 Earner | 1,103 (43.3%) | $58,264 |
| 2 Earners | 672 (26.4%) | $87,315 |
| 3+ Earners | 291 (11.4%) | $152,904 |
| Total | 2,548 (100.0%) | $65,316 |
Household Income in Sun Village
Household Income Brackets in Sun Village
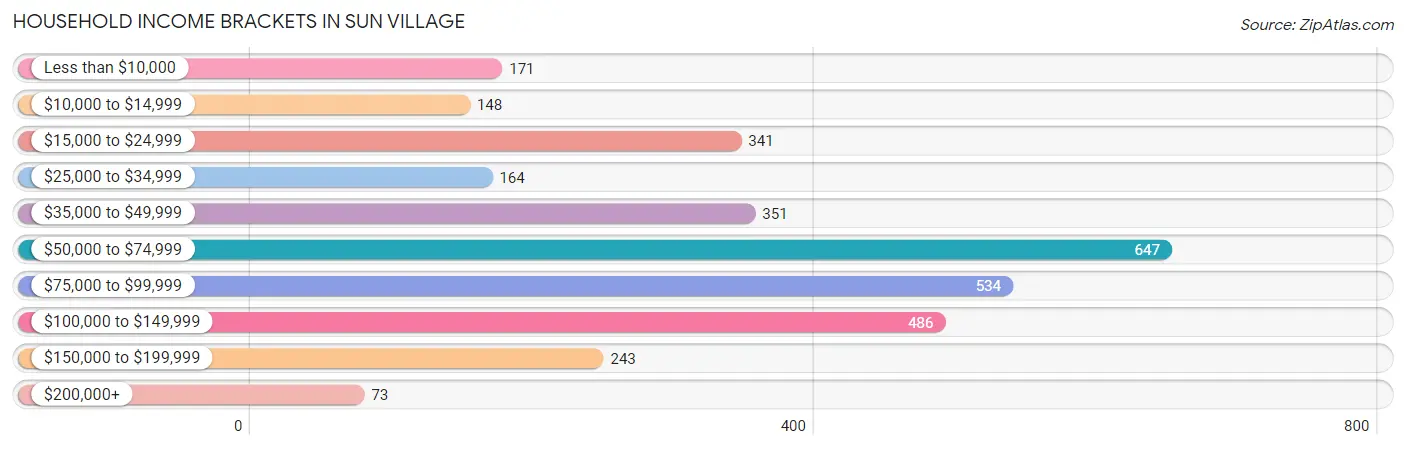
With 647 households falling in the category, the $50,000 to $74,999 income range is the most frequent in Sun Village, accounting for 20.5% of all households. In contrast, only 73 households (2.3%) fall into the $200,000+ income bracket, making it the least populous group.
| Income Bracket | # Households | % Households |
| Less than $10,000 | 171 | 5.4% |
| $10,000 to $14,999 | 148 | 4.7% |
| $15,000 to $24,999 | 341 | 10.8% |
| $25,000 to $34,999 | 164 | 5.2% |
| $35,000 to $49,999 | 351 | 11.1% |
| $50,000 to $74,999 | 647 | 20.5% |
| $75,000 to $99,999 | 534 | 16.9% |
| $100,000 to $149,999 | 486 | 15.4% |
| $150,000 to $199,999 | 243 | 7.7% |
| $200,000+ | 73 | 2.3% |
Household Income by Householder Age in Sun Village
The median household income in Sun Village is $66,158, with the highest median household income of $73,427 found in the 45 to 64 years age bracket for the primary householder. A total of 1,613 households (51.1%) fall into this category.
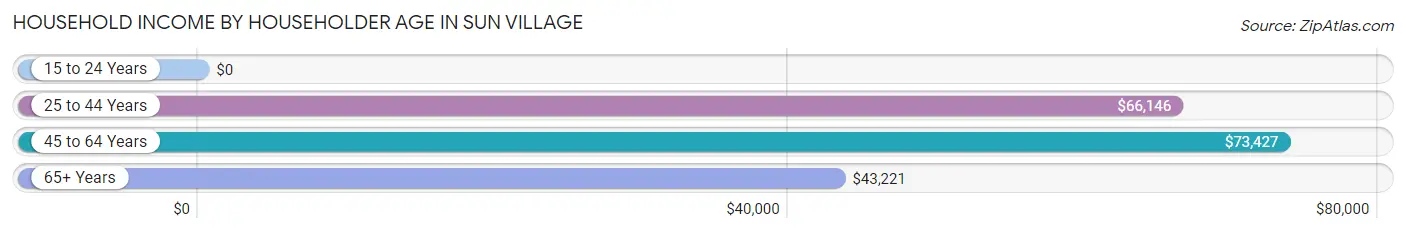
| Income Bracket | # Households | Median Income |
| 15 to 24 Years | 0 (0.0%) | $0 |
| 25 to 44 Years | 684 (21.7%) | $66,146 |
| 45 to 64 Years | 1,613 (51.1%) | $73,427 |
| 65+ Years | 861 (27.3%) | $43,221 |
| Total | 3,158 (100.0%) | $66,158 |
Poverty in Sun Village
Income Below Poverty by Sex and Age in Sun Village
With 16.9% poverty level for males and 22.7% for females among the residents of Sun Village, 15 year old males and 15 year old females are the most vulnerable to poverty, with 19 males (39.6%) and 49 females (64.5%) in their respective age groups living below the poverty level.
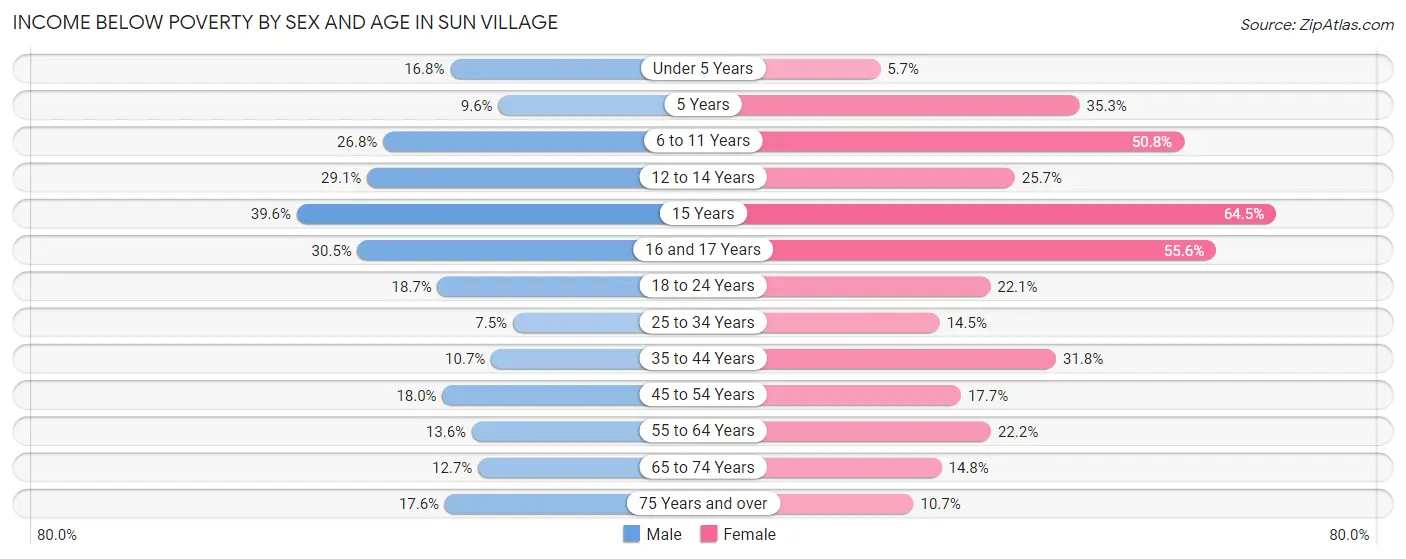
| Age Bracket | Male | Female |
| Under 5 Years | 61 (16.8%) | 23 (5.7%) |
| 5 Years | 8 (9.6%) | 77 (35.3%) |
| 6 to 11 Years | 133 (26.8%) | 127 (50.8%) |
| 12 to 14 Years | 90 (29.1%) | 166 (25.7%) |
| 15 Years | 19 (39.6%) | 49 (64.5%) |
| 16 and 17 Years | 62 (30.5%) | 50 (55.6%) |
| 18 to 24 Years | 98 (18.7%) | 99 (22.1%) |
| 25 to 34 Years | 43 (7.5%) | 81 (14.5%) |
| 35 to 44 Years | 64 (10.7%) | 216 (31.8%) |
| 45 to 54 Years | 180 (17.9%) | 168 (17.7%) |
| 55 to 64 Years | 112 (13.6%) | 142 (22.2%) |
| 65 to 74 Years | 70 (12.7%) | 75 (14.8%) |
| 75 Years and over | 29 (17.6%) | 28 (10.6%) |
| Total | 969 (16.9%) | 1,301 (22.7%) |
Income Above Poverty by Sex and Age in Sun Village
According to the poverty statistics in Sun Village, males aged 25 to 34 years and females aged under 5 years are the age groups that are most secure financially, with 92.5% of males and 94.3% of females in these age groups living above the poverty line.
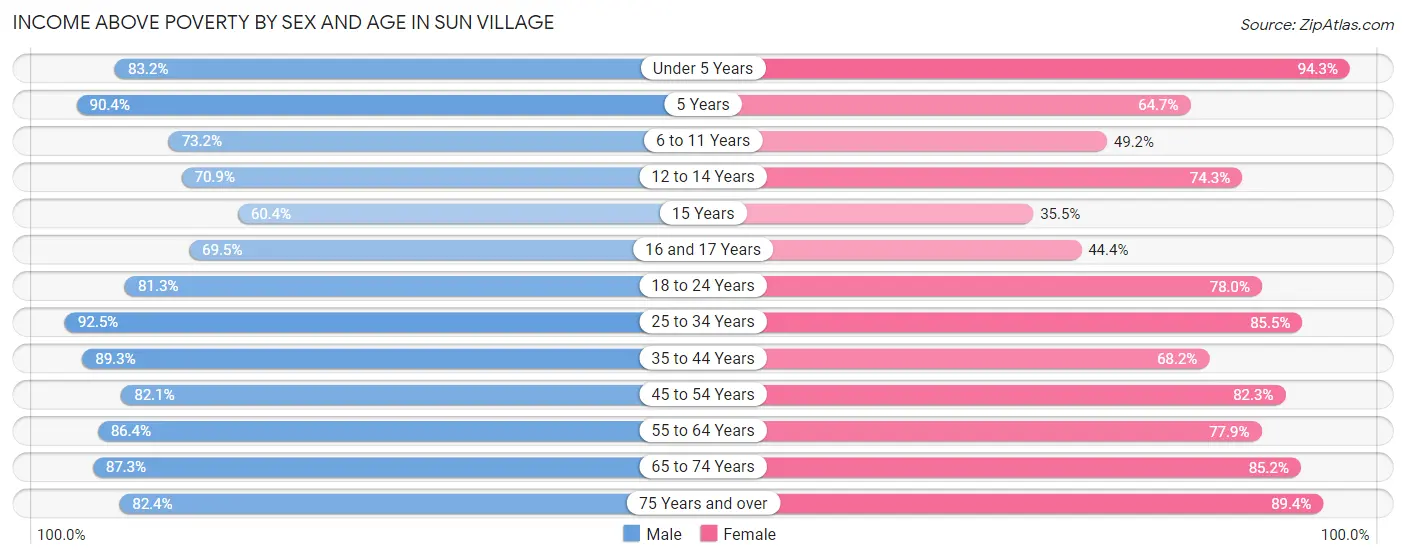
| Age Bracket | Male | Female |
| Under 5 Years | 302 (83.2%) | 380 (94.3%) |
| 5 Years | 75 (90.4%) | 141 (64.7%) |
| 6 to 11 Years | 364 (73.2%) | 123 (49.2%) |
| 12 to 14 Years | 219 (70.9%) | 480 (74.3%) |
| 15 Years | 29 (60.4%) | 27 (35.5%) |
| 16 and 17 Years | 141 (69.5%) | 40 (44.4%) |
| 18 to 24 Years | 427 (81.3%) | 350 (77.9%) |
| 25 to 34 Years | 531 (92.5%) | 476 (85.5%) |
| 35 to 44 Years | 533 (89.3%) | 463 (68.2%) |
| 45 to 54 Years | 823 (82.1%) | 781 (82.3%) |
| 55 to 64 Years | 713 (86.4%) | 499 (77.8%) |
| 65 to 74 Years | 483 (87.3%) | 431 (85.2%) |
| 75 Years and over | 136 (82.4%) | 235 (89.3%) |
| Total | 4,776 (83.1%) | 4,426 (77.3%) |
Income Below Poverty Among Married-Couple Families in Sun Village
The poverty statistics for married-couple families in Sun Village show that 12.8% or 259 of the total 2,032 families live below the poverty line. Families with 1 or 2 children have the highest poverty rate of 17.4%, comprising of 137 families. On the other hand, families with 5 or more children have the lowest poverty rate of 6.9%, which includes 5 families.
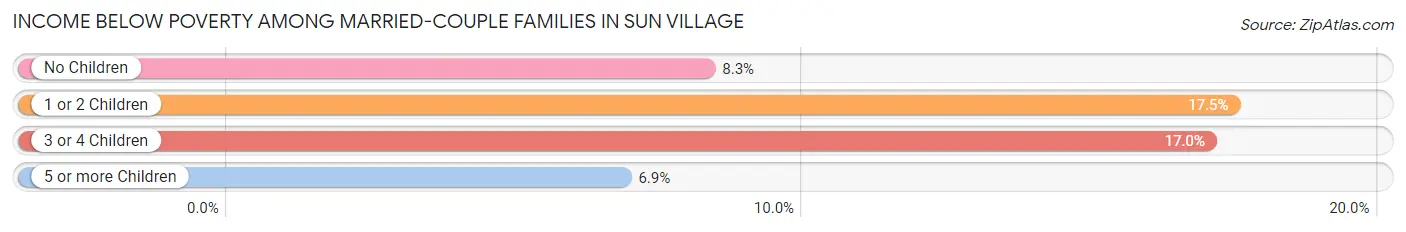
| Children | Above Poverty | Below Poverty |
| No Children | 872 (91.7%) | 79 (8.3%) |
| 1 or 2 Children | 648 (82.6%) | 137 (17.4%) |
| 3 or 4 Children | 185 (83.0%) | 38 (17.0%) |
| 5 or more Children | 68 (93.1%) | 5 (6.9%) |
| Total | 1,773 (87.3%) | 259 (12.8%) |
Income Below Poverty Among Single-Parent Households in Sun Village
According to the poverty data in Sun Village, 32.3% or 64 single-father households and 39.0% or 124 single-mother households are living below the poverty line. Among single-father households, those with no children have the highest poverty rate, with 64 households (53.8%) experiencing poverty. Likewise, among single-mother households, those with 5 or more children have the highest poverty rate, with 29 households (100.0%) falling below the poverty line.
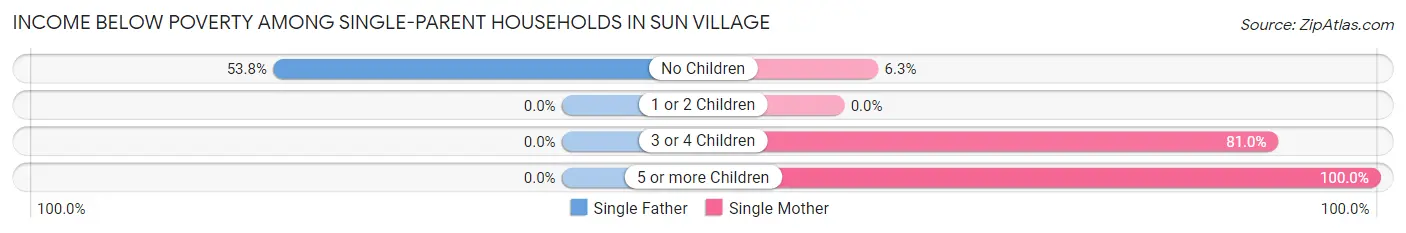
| Children | Single Father | Single Mother |
| No Children | 64 (53.8%) | 10 (6.3%) |
| 1 or 2 Children | 0 (0.0%) | 0 (0.0%) |
| 3 or 4 Children | 0 (0.0%) | 85 (80.9%) |
| 5 or more Children | 0 (0.0%) | 29 (100.0%) |
| Total | 64 (32.3%) | 124 (39.0%) |
Income Below Poverty Among Married-Couple vs Single-Parent Households in Sun Village
The poverty data for Sun Village shows that 259 of the married-couple family households (12.8%) and 188 of the single-parent households (36.4%) are living below the poverty level. Within the married-couple family households, those with 1 or 2 children have the highest poverty rate, with 137 households (17.4%) falling below the poverty line. Among the single-parent households, those with 5 or more children have the highest poverty rate, with 29 household (100.0%) living below poverty.
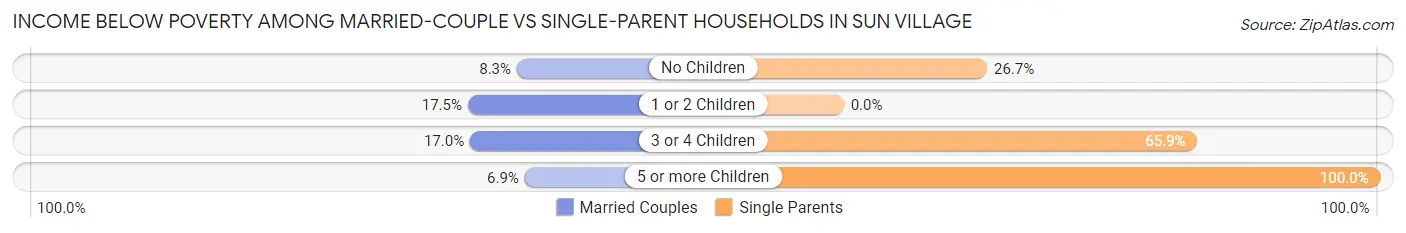
| Children | Married-Couple Families | Single-Parent Households |
| No Children | 79 (8.3%) | 74 (26.7%) |
| 1 or 2 Children | 137 (17.4%) | 0 (0.0%) |
| 3 or 4 Children | 38 (17.0%) | 85 (65.9%) |
| 5 or more Children | 5 (6.9%) | 29 (100.0%) |
| Total | 259 (12.8%) | 188 (36.4%) |
Race in Sun Village
The most populous races in Sun Village are Hispanic or Latino (8,678 | 75.6%), White / Caucasian (5,058 | 44.1%), and Some other Race (3,828 | 33.4%).
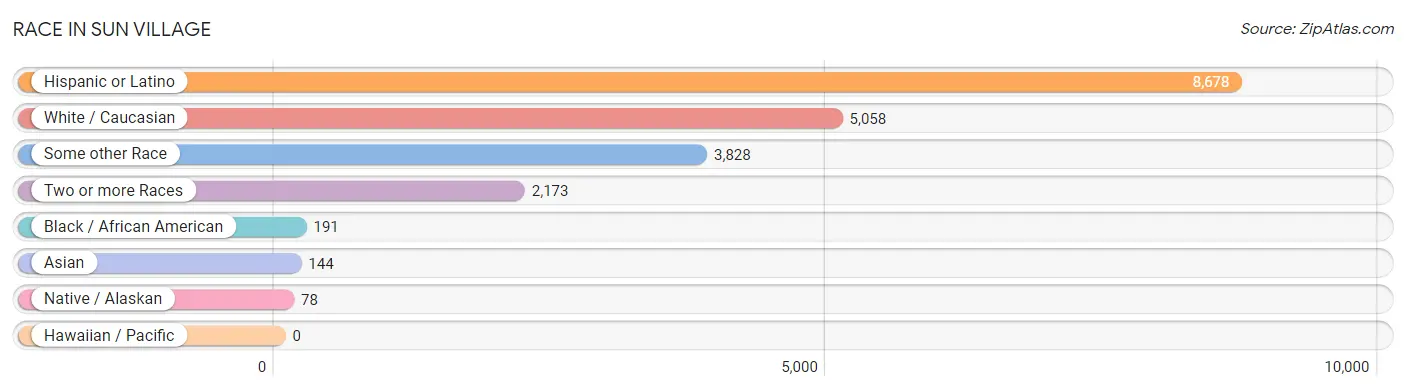
| Race | # Population | % Population |
| Asian | 144 | 1.3% |
| Black / African American | 191 | 1.7% |
| Hawaiian / Pacific | 0 | 0.0% |
| Hispanic or Latino | 8,678 | 75.6% |
| Native / Alaskan | 78 | 0.7% |
| White / Caucasian | 5,058 | 44.1% |
| Two or more Races | 2,173 | 18.9% |
| Some other Race | 3,828 | 33.4% |
| Total | 11,472 | 100.0% |
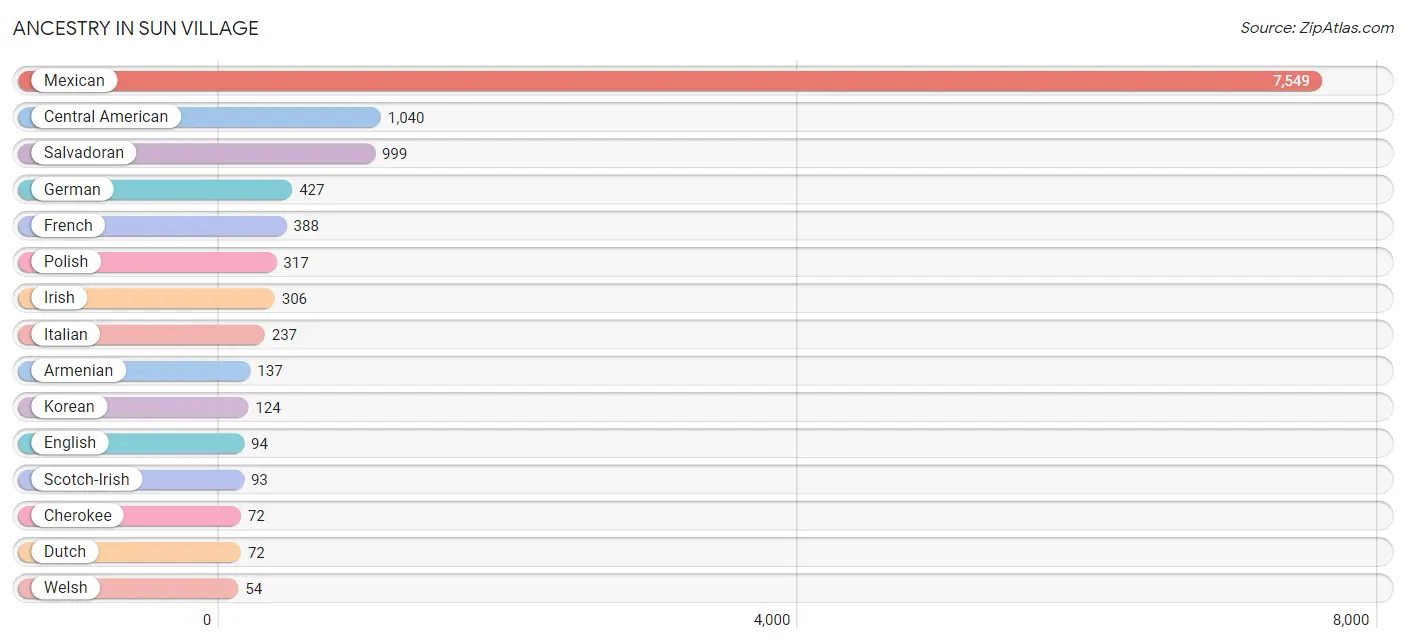
Ancestry in Sun Village
The most populous ancestries reported in Sun Village are Mexican (7,549 | 65.8%), Central American (1,040 | 9.1%), Salvadoran (999 | 8.7%), German (427 | 3.7%), and French (388 | 3.4%), together accounting for 90.7% of all Sun Village residents.
| Ancestry | # Population | % Population |
| Apache | 12 | 0.1% |
| Argentinean | 20 | 0.2% |
| Armenian | 137 | 1.2% |
| Belgian | 20 | 0.2% |
| British | 28 | 0.2% |
| Cajun | 7 | 0.1% |
| Central American | 1,040 | 9.1% |
| Cherokee | 72 | 0.6% |
| Creek | 34 | 0.3% |
| Dutch | 72 | 0.6% |
| English | 94 | 0.8% |
| European | 46 | 0.4% |
| Finnish | 16 | 0.1% |
| French | 388 | 3.4% |
| German | 427 | 3.7% |
| Guatemalan | 41 | 0.4% |
| Indian (Asian) | 33 | 0.3% |
| Iranian | 10 | 0.1% |
| Irish | 306 | 2.7% |
| Italian | 237 | 2.1% |
| Japanese | 27 | 0.2% |
| Korean | 124 | 1.1% |
| Mexican | 7,549 | 65.8% |
| Northern European | 17 | 0.2% |
| Norwegian | 39 | 0.3% |
| Polish | 317 | 2.8% |
| Puerto Rican | 9 | 0.1% |
| Russian | 18 | 0.2% |
| Salvadoran | 999 | 8.7% |
| Scotch-Irish | 93 | 0.8% |
| Scottish | 35 | 0.3% |
| South American | 20 | 0.2% |
| Spaniard | 16 | 0.1% |
| Spanish | 44 | 0.4% |
| Swedish | 51 | 0.4% |
| Welsh | 54 | 0.5% | View All 36 Rows |
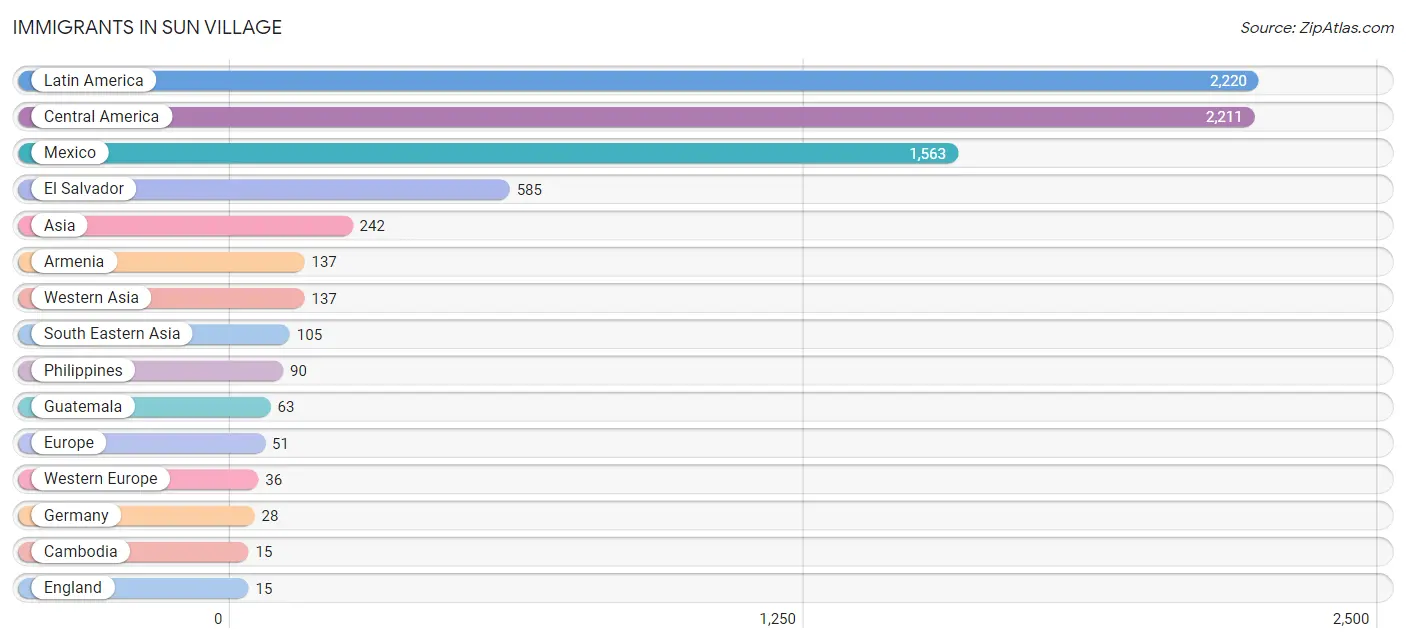
Immigrants in Sun Village
The most numerous immigrant groups reported in Sun Village came from Latin America (2,220 | 19.4%), Central America (2,211 | 19.3%), Mexico (1,563 | 13.6%), El Salvador (585 | 5.1%), and Asia (242 | 2.1%), together accounting for 59.5% of all Sun Village residents.
| Immigration Origin | # Population | % Population |
| Argentina | 9 | 0.1% |
| Armenia | 137 | 1.2% |
| Asia | 242 | 2.1% |
| Austria | 8 | 0.1% |
| Cambodia | 15 | 0.1% |
| Central America | 2,211 | 19.3% |
| El Salvador | 585 | 5.1% |
| England | 15 | 0.1% |
| Europe | 51 | 0.4% |
| Germany | 28 | 0.2% |
| Guatemala | 63 | 0.5% |
| Latin America | 2,220 | 19.4% |
| Mexico | 1,563 | 13.6% |
| Northern Europe | 15 | 0.1% |
| Philippines | 90 | 0.8% |
| South America | 9 | 0.1% |
| South Eastern Asia | 105 | 0.9% |
| Western Asia | 137 | 1.2% |
| Western Europe | 36 | 0.3% | View All 19 Rows |
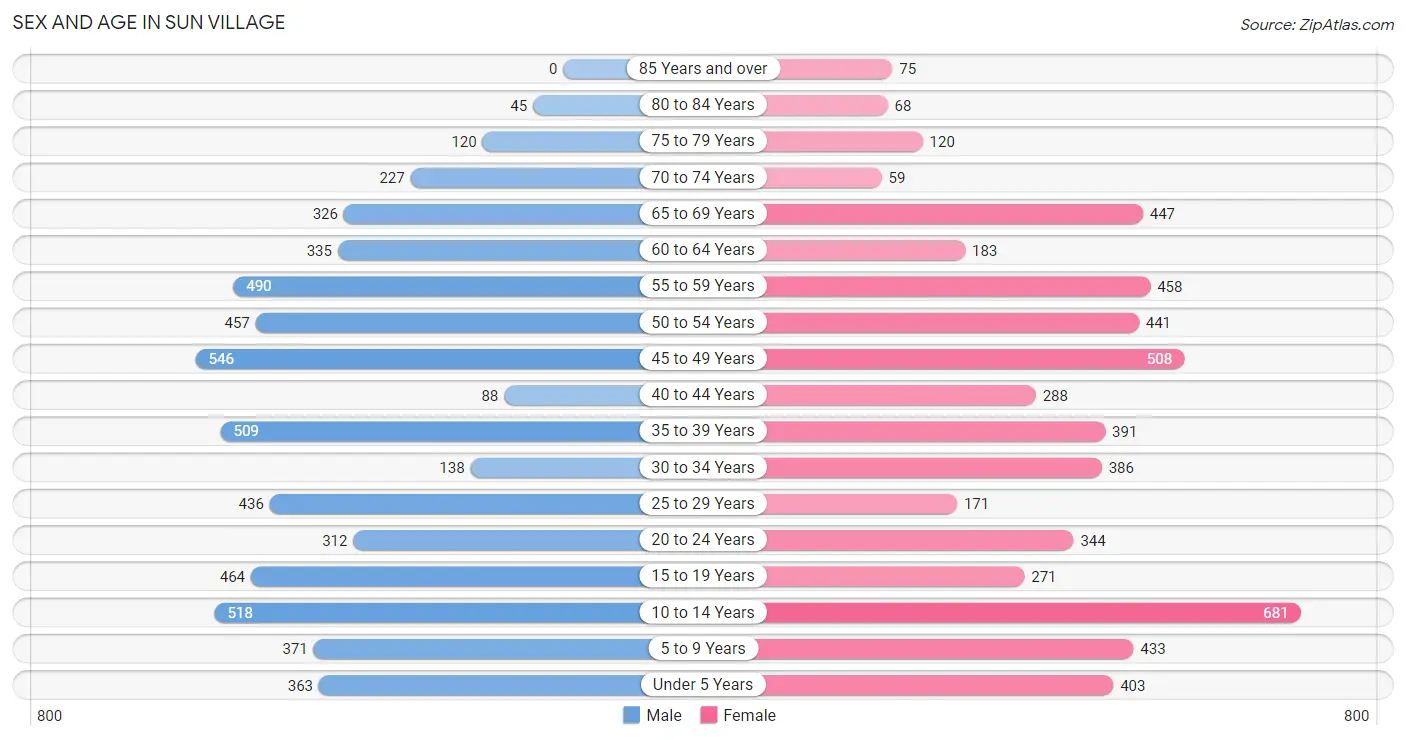
Sex and Age in Sun Village
Sex and Age in Sun Village
The most populous age groups in Sun Village are 45 to 49 Years (546 | 9.5%) for men and 10 to 14 Years (681 | 11.9%) for women.
| Age Bracket | Male | Female |
| Under 5 Years | 363 (6.3%) | 403 (7.0%) |
| 5 to 9 Years | 371 (6.5%) | 433 (7.6%) |
| 10 to 14 Years | 518 (9.0%) | 681 (11.9%) |
| 15 to 19 Years | 464 (8.1%) | 271 (4.7%) |
| 20 to 24 Years | 312 (5.4%) | 344 (6.0%) |
| 25 to 29 Years | 436 (7.6%) | 171 (3.0%) |
| 30 to 34 Years | 138 (2.4%) | 386 (6.7%) |
| 35 to 39 Years | 509 (8.9%) | 391 (6.8%) |
| 40 to 44 Years | 88 (1.5%) | 288 (5.0%) |
| 45 to 49 Years | 546 (9.5%) | 508 (8.9%) |
| 50 to 54 Years | 457 (8.0%) | 441 (7.7%) |
| 55 to 59 Years | 490 (8.5%) | 458 (8.0%) |
| 60 to 64 Years | 335 (5.8%) | 183 (3.2%) |
| 65 to 69 Years | 326 (5.7%) | 447 (7.8%) |
| 70 to 74 Years | 227 (4.0%) | 59 (1.0%) |
| 75 to 79 Years | 120 (2.1%) | 120 (2.1%) |
| 80 to 84 Years | 45 (0.8%) | 68 (1.2%) |
| 85 Years and over | 0 (0.0%) | 75 (1.3%) |
| Total | 5,745 (100.0%) | 5,727 (100.0%) |
Families and Households in Sun Village
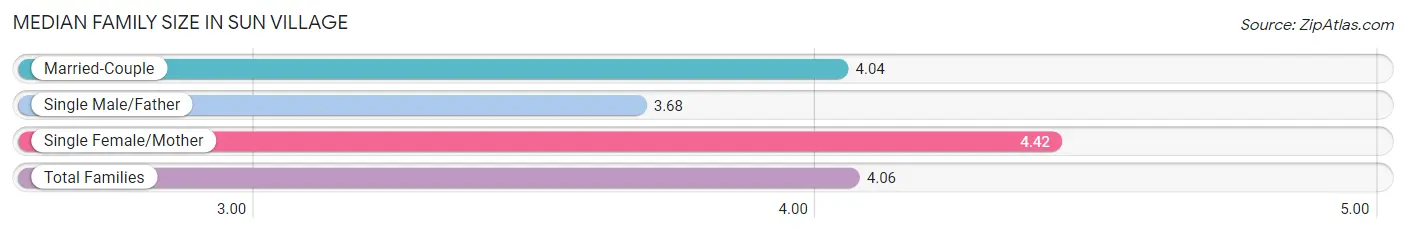
Median Family Size in Sun Village
The median family size in Sun Village is 4.06 persons per family, with single female/mother families (318 | 12.5%) accounting for the largest median family size of 4.42 persons per family. On the other hand, single male/father families (198 | 7.8%) represent the smallest median family size with 3.68 persons per family.
| Family Type | # Families | Family Size |
| Married-Couple | 2,032 (79.7%) | 4.04 |
| Single Male/Father | 198 (7.8%) | 3.68 |
| Single Female/Mother | 318 (12.5%) | 4.42 |
| Total Families | 2,548 (100.0%) | 4.06 |
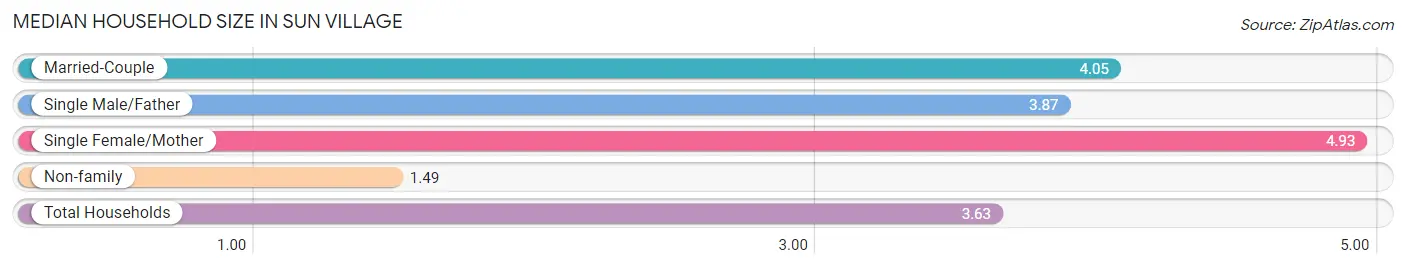
Median Household Size in Sun Village
The median household size in Sun Village is 3.63 persons per household, with single female/mother households (318 | 10.1%) accounting for the largest median household size of 4.93 persons per household. non-family households (610 | 19.3%) represent the smallest median household size with 1.49 persons per household.
| Household Type | # Households | Household Size |
| Married-Couple | 2,032 (64.3%) | 4.05 |
| Single Male/Father | 198 (6.3%) | 3.87 |
| Single Female/Mother | 318 (10.1%) | 4.93 |
| Non-family | 610 (19.3%) | 1.49 |
| Total Households | 3,158 (100.0%) | 3.63 |
Household Size by Marriage Status in Sun Village
Out of a total of 3,158 households in Sun Village, 2,548 (80.7%) are family households, while 610 (19.3%) are nonfamily households. The most numerous type of family households are 2-person households, comprising 851, and the most common type of nonfamily households are 1-person households, comprising 337.
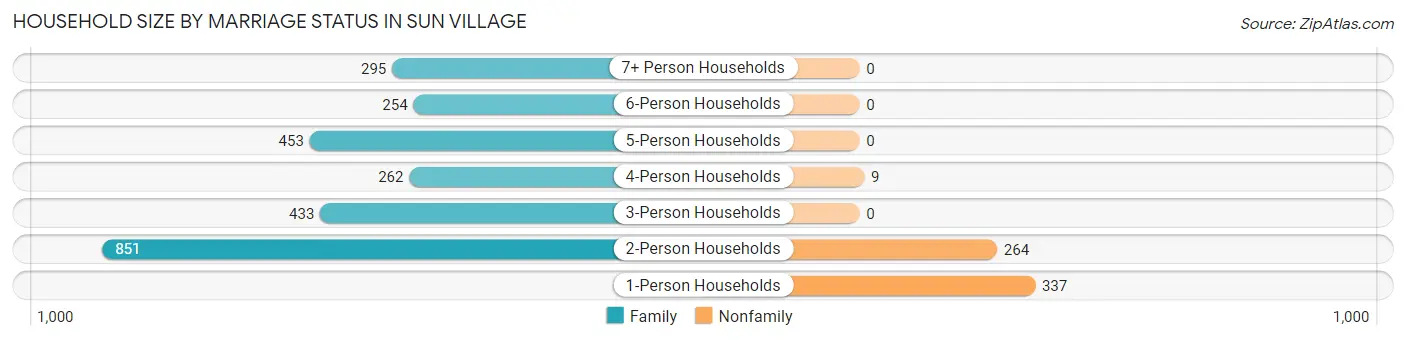
| Household Size | Family Households | Nonfamily Households |
| 1-Person Households | - | 337 (10.7%) |
| 2-Person Households | 851 (27.0%) | 264 (8.4%) |
| 3-Person Households | 433 (13.7%) | 0 (0.0%) |
| 4-Person Households | 262 (8.3%) | 9 (0.3%) |
| 5-Person Households | 453 (14.3%) | 0 (0.0%) |
| 6-Person Households | 254 (8.0%) | 0 (0.0%) |
| 7+ Person Households | 295 (9.3%) | 0 (0.0%) |
| Total | 2,548 (80.7%) | 610 (19.3%) |
Female Fertility in Sun Village
Fertility by Age in Sun Village
Average fertility rate in Sun Village is 10.0 births per 1,000 women. Women in the age bracket of 20 to 34 years have the highest fertility rate with 27.0 births per 1,000 women. Women in the age bracket of 20 to 34 years acount for 100.0% of all women with births.
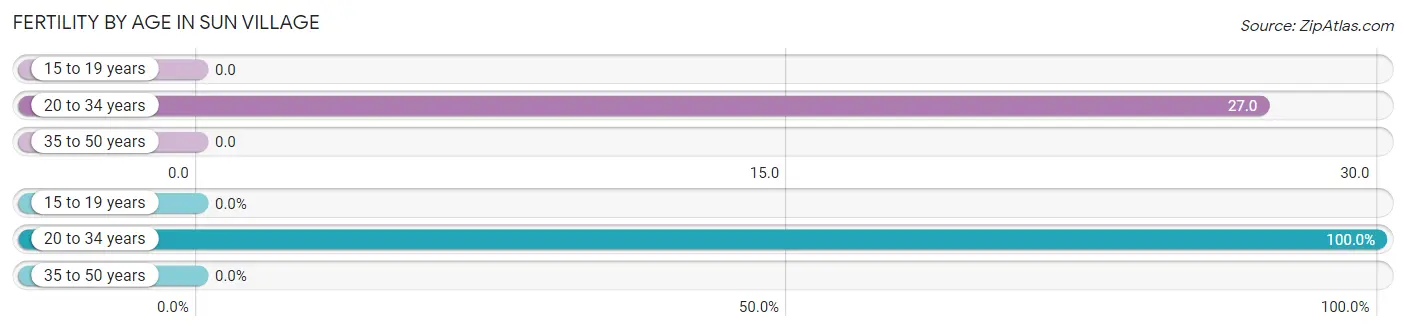
| Age Bracket | Women with Births | Births / 1,000 Women |
| 15 to 19 years | 0 (0.0%) | 0.0 |
| 20 to 34 years | 24 (100.0%) | 27.0 |
| 35 to 50 years | 0 (0.0%) | 0.0 |
| Total | 24 (100.0%) | 10.0 |
Fertility by Age by Marriage Status in Sun Village
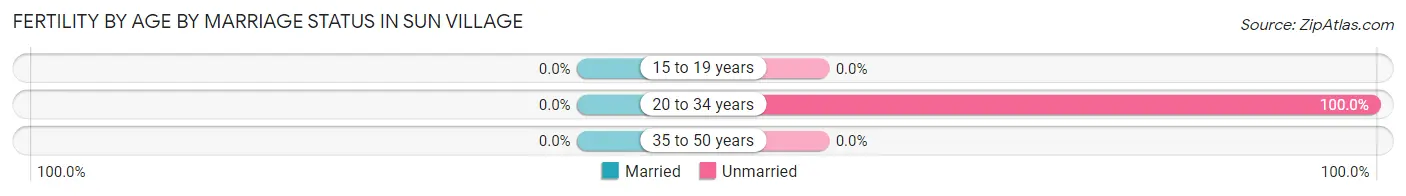
| Age Bracket | Married | Unmarried |
| 15 to 19 years | 0 (0.0%) | 0 (0.0%) |
| 20 to 34 years | 0 (0.0%) | 24 (100.0%) |
| 35 to 50 years | 0 (0.0%) | 0 (0.0%) |
| Total | 0 (0.0%) | 24 (100.0%) |
Fertility by Education in Sun Village
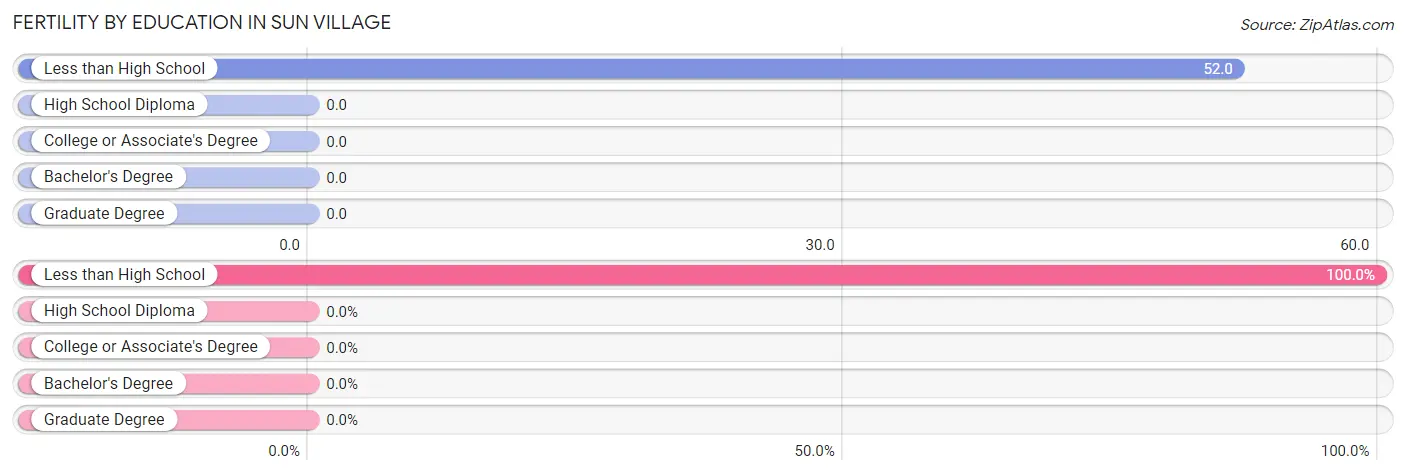
| Educational Attainment | Women with Births | Births / 1,000 Women |
| Less than High School | 24 (100.0%) | 52.0 |
| High School Diploma | 0 (0.0%) | 0.0 |
| College or Associate's Degree | 0 (0.0%) | 0.0 |
| Bachelor's Degree | 0 (0.0%) | 0.0 |
| Graduate Degree | 0 (0.0%) | 0.0 |
| Total | 24 (100.0%) | 10.0 |
Fertility by Education by Marriage Status in Sun Village
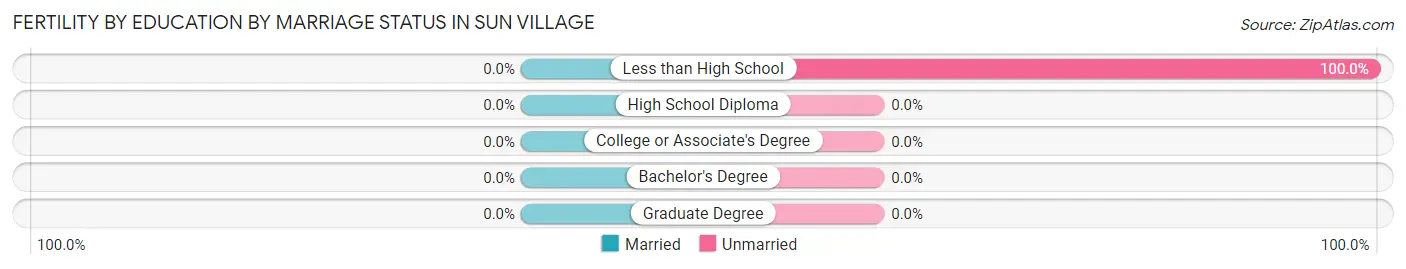
| Educational Attainment | Married | Unmarried |
| Less than High School | 0 (0.0%) | 24 (100.0%) |
| High School Diploma | 0 (0.0%) | 0 (0.0%) |
| College or Associate's Degree | 0 (0.0%) | 0 (0.0%) |
| Bachelor's Degree | 0 (0.0%) | 0 (0.0%) |
| Graduate Degree | 0 (0.0%) | 0 (0.0%) |
| Total | 0 (0.0%) | 24 (100.0%) |
Employment Characteristics in Sun Village
Employment by Class of Employer in Sun Village
Among the 4,108 employed individuals in Sun Village, private company employees (3,041 | 74.0%), self-employed (not incorporated) (452 | 11.0%), and local government employees (261 | 6.4%) make up the most common classes of employment.
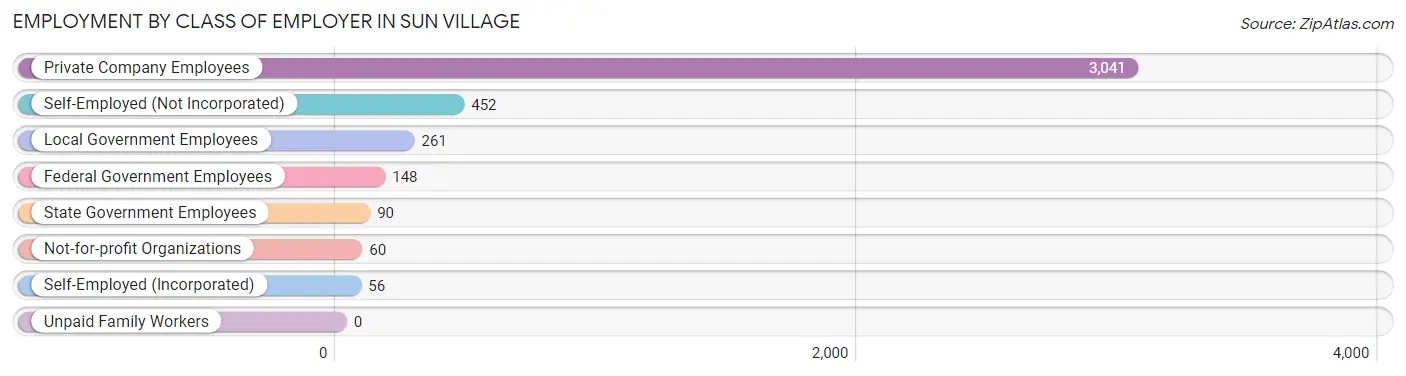
| Employer Class | # Employees | % Employees |
| Private Company Employees | 3,041 | 74.0% |
| Self-Employed (Incorporated) | 56 | 1.4% |
| Self-Employed (Not Incorporated) | 452 | 11.0% |
| Not-for-profit Organizations | 60 | 1.5% |
| Local Government Employees | 261 | 6.4% |
| State Government Employees | 90 | 2.2% |
| Federal Government Employees | 148 | 3.6% |
| Unpaid Family Workers | 0 | 0.0% |
| Total | 4,108 | 100.0% |
Employment Status by Age in Sun Village
According to the labor force statistics for Sun Village, out of the total population over 16 years of age (8,579), 52.8% or 4,530 individuals are in the labor force, with 7.8% or 353 of them unemployed. The age group with the highest labor force participation rate is 25 to 29 years, with 92.8% or 563 individuals in the labor force. Within the labor force, the 30 to 34 years age range has the highest percentage of unemployed individuals, with 20.2% or 63 of them being unemployed.
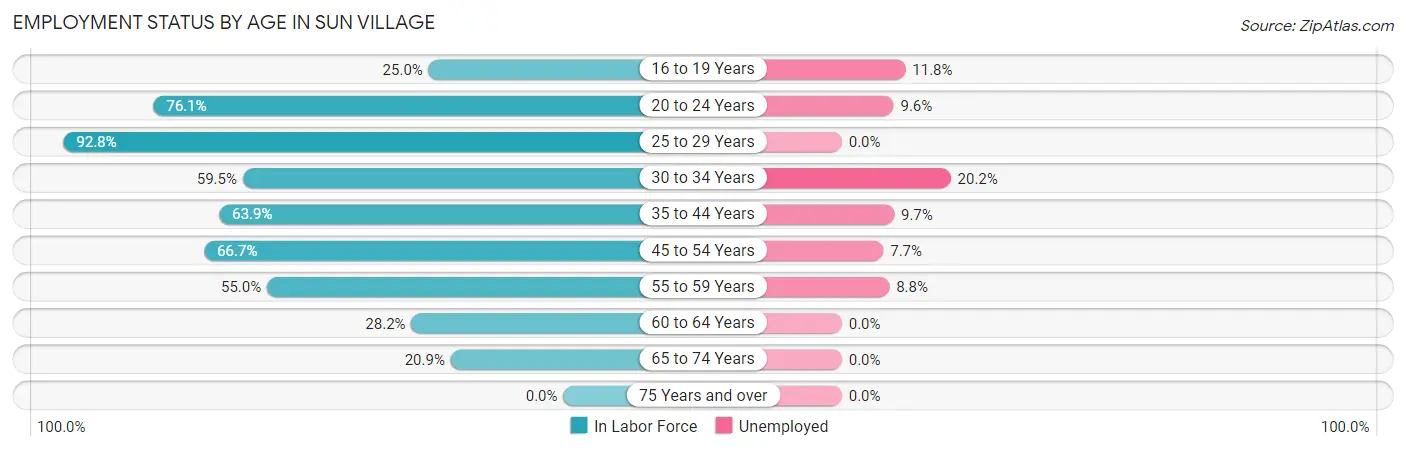
| Age Bracket | In Labor Force | Unemployed |
| 16 to 19 Years | 153 (25.0%) | 18 (11.8%) |
| 20 to 24 Years | 499 (76.1%) | 48 (9.6%) |
| 25 to 29 Years | 563 (92.8%) | 0 (0.0%) |
| 30 to 34 Years | 312 (59.5%) | 63 (20.2%) |
| 35 to 44 Years | 815 (63.9%) | 79 (9.7%) |
| 45 to 54 Years | 1,302 (66.7%) | 100 (7.7%) |
| 55 to 59 Years | 521 (55.0%) | 46 (8.8%) |
| 60 to 64 Years | 146 (28.2%) | 0 (0.0%) |
| 65 to 74 Years | 221 (20.9%) | 0 (0.0%) |
| 75 Years and over | 0 (0.0%) | 0 (0.0%) |
| Total | 4,530 (52.8%) | 353 (7.8%) |
Employment Status by Educational Attainment in Sun Village
According to labor force statistics for Sun Village, 62.8% of individuals (3,658) out of the total population between 25 and 64 years of age (5,825) are in the labor force, with 7.9% or 289 of them being unemployed. The group with the highest labor force participation rate are those with the educational attainment of bachelor's degree or higher, with 83.9% or 177 individuals in the labor force. Within the labor force, individuals with college / associate degree education have the highest percentage of unemployment, with 15.5% or 199 of them being unemployed.
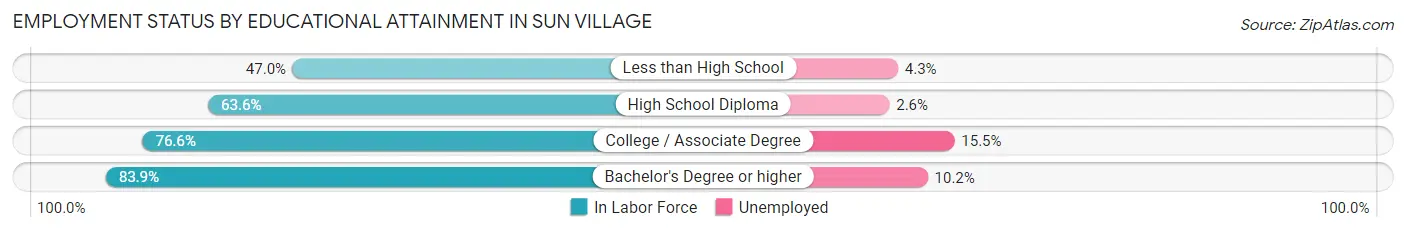
| Educational Attainment | In Labor Force | Unemployed |
| Less than High School | 866 (47.0%) | 79 (4.3%) |
| High School Diploma | 1,332 (63.6%) | 54 (2.6%) |
| College / Associate Degree | 1,284 (76.6%) | 260 (15.5%) |
| Bachelor's Degree or higher | 177 (83.9%) | 22 (10.2%) |
| Total | 3,658 (62.8%) | 460 (7.9%) |
Employment Occupations by Sex in Sun Village
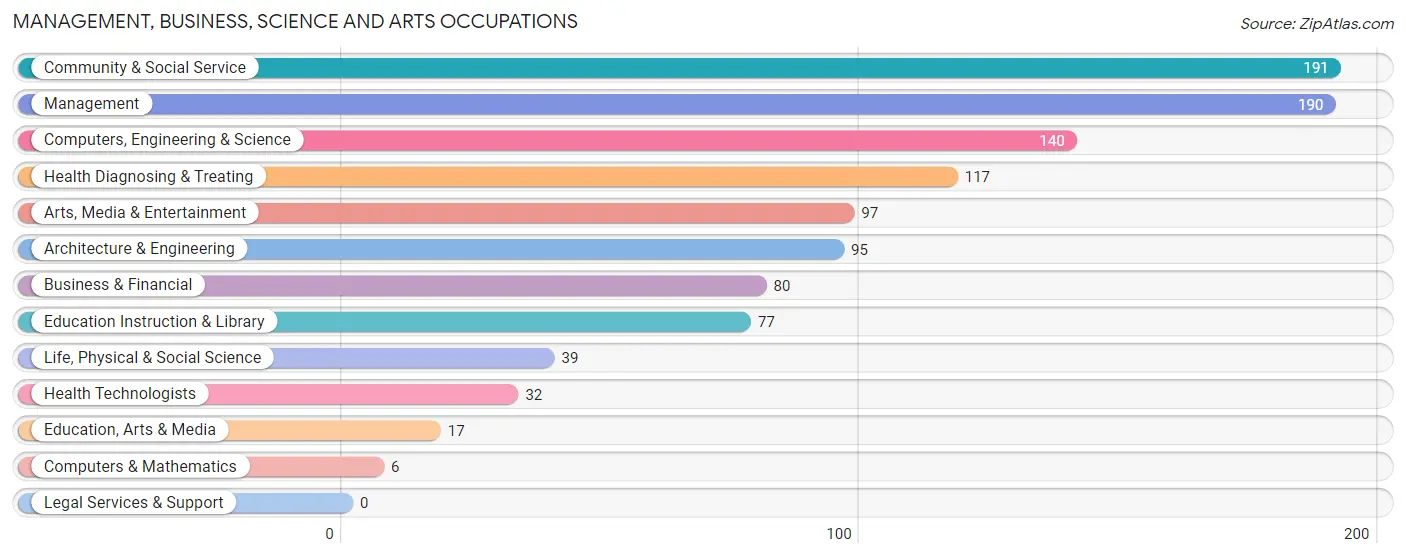
Management, Business, Science and Arts Occupations
The most common Management, Business, Science and Arts occupations in Sun Village are Community & Social Service (191 | 4.6%), Management (190 | 4.5%), Computers, Engineering & Science (140 | 3.4%), Health Diagnosing & Treating (117 | 2.8%), and Arts, Media & Entertainment (97 | 2.3%).
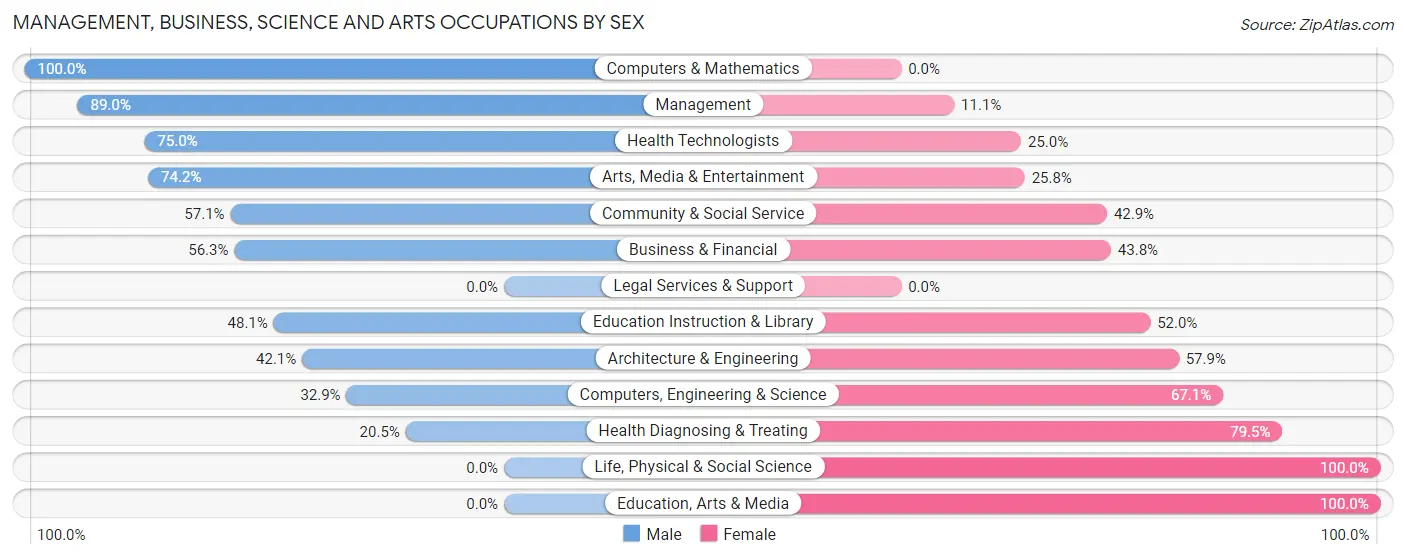
Management, Business, Science and Arts Occupations by Sex
Within the Management, Business, Science and Arts occupations in Sun Village, the most male-oriented occupations are Computers & Mathematics (100.0%), Management (88.9%), and Health Technologists (75.0%), while the most female-oriented occupations are Life, Physical & Social Science (100.0%), Education, Arts & Media (100.0%), and Health Diagnosing & Treating (79.5%).
| Occupation | Male | Female |
| Management | 169 (88.9%) | 21 (11.1%) |
| Business & Financial | 45 (56.2%) | 35 (43.8%) |
| Computers, Engineering & Science | 46 (32.9%) | 94 (67.1%) |
| Computers & Mathematics | 6 (100.0%) | 0 (0.0%) |
| Architecture & Engineering | 40 (42.1%) | 55 (57.9%) |
| Life, Physical & Social Science | 0 (0.0%) | 39 (100.0%) |
| Community & Social Service | 109 (57.1%) | 82 (42.9%) |
| Education, Arts & Media | 0 (0.0%) | 17 (100.0%) |
| Legal Services & Support | 0 (0.0%) | 0 (0.0%) |
| Education Instruction & Library | 37 (48.0%) | 40 (51.9%) |
| Arts, Media & Entertainment | 72 (74.2%) | 25 (25.8%) |
| Health Diagnosing & Treating | 24 (20.5%) | 93 (79.5%) |
| Health Technologists | 24 (75.0%) | 8 (25.0%) |
| Total (Category) | 393 (54.7%) | 325 (45.3%) |
| Total (Overall) | 2,776 (66.4%) | 1,402 (33.6%) |
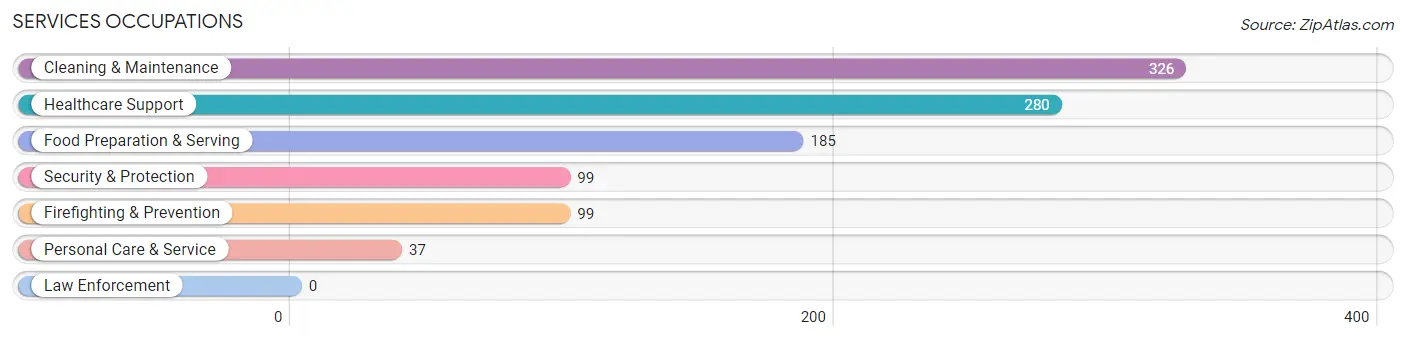
Services Occupations
The most common Services occupations in Sun Village are Cleaning & Maintenance (326 | 7.8%), Healthcare Support (280 | 6.7%), Food Preparation & Serving (185 | 4.4%), Security & Protection (99 | 2.4%), and Firefighting & Prevention (99 | 2.4%).
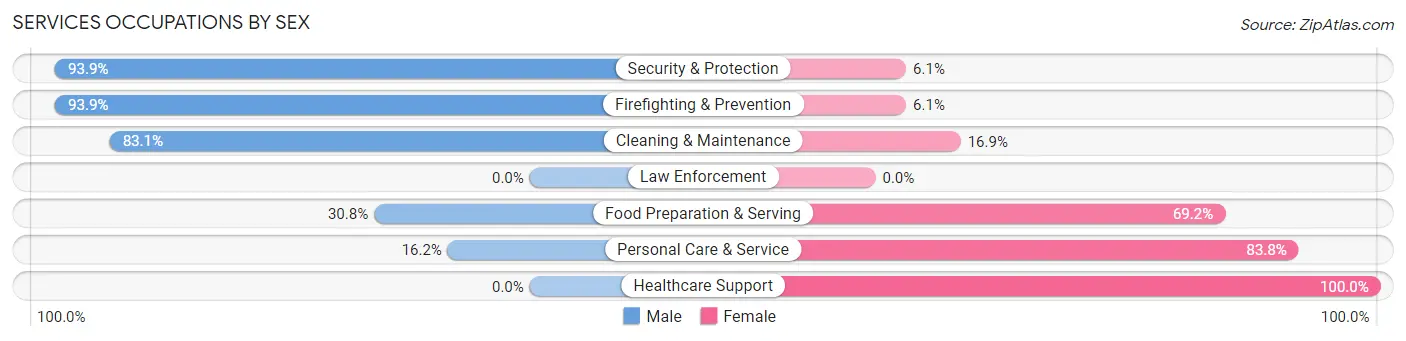
Services Occupations by Sex
Within the Services occupations in Sun Village, the most male-oriented occupations are Security & Protection (93.9%), Firefighting & Prevention (93.9%), and Cleaning & Maintenance (83.1%), while the most female-oriented occupations are Healthcare Support (100.0%), Personal Care & Service (83.8%), and Food Preparation & Serving (69.2%).
| Occupation | Male | Female |
| Healthcare Support | 0 (0.0%) | 280 (100.0%) |
| Security & Protection | 93 (93.9%) | 6 (6.1%) |
| Firefighting & Prevention | 93 (93.9%) | 6 (6.1%) |
| Law Enforcement | 0 (0.0%) | 0 (0.0%) |
| Food Preparation & Serving | 57 (30.8%) | 128 (69.2%) |
| Cleaning & Maintenance | 271 (83.1%) | 55 (16.9%) |
| Personal Care & Service | 6 (16.2%) | 31 (83.8%) |
| Total (Category) | 427 (46.1%) | 500 (53.9%) |
| Total (Overall) | 2,776 (66.4%) | 1,402 (33.6%) |
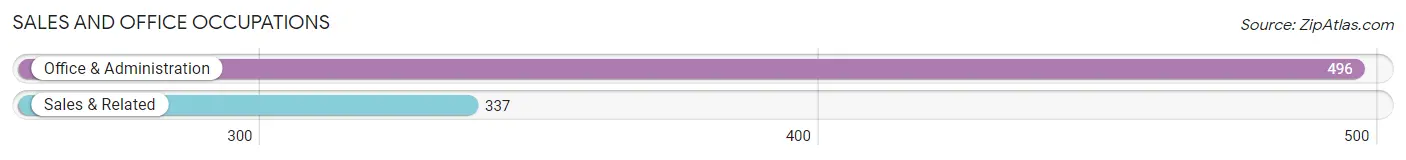
Sales and Office Occupations
The most common Sales and Office occupations in Sun Village are Office & Administration (496 | 11.9%), and Sales & Related (337 | 8.1%).
Sales and Office Occupations by Sex
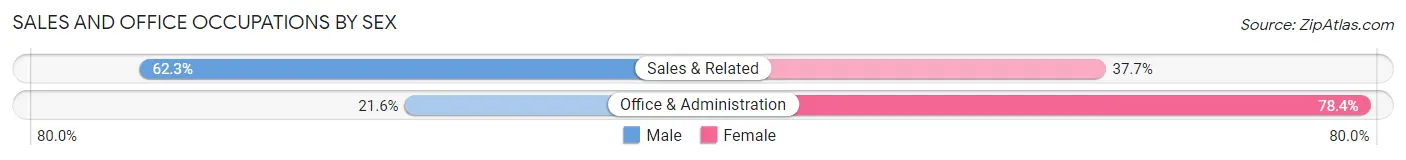
| Occupation | Male | Female |
| Sales & Related | 210 (62.3%) | 127 (37.7%) |
| Office & Administration | 107 (21.6%) | 389 (78.4%) |
| Total (Category) | 317 (38.1%) | 516 (61.9%) |
| Total (Overall) | 2,776 (66.4%) | 1,402 (33.6%) |
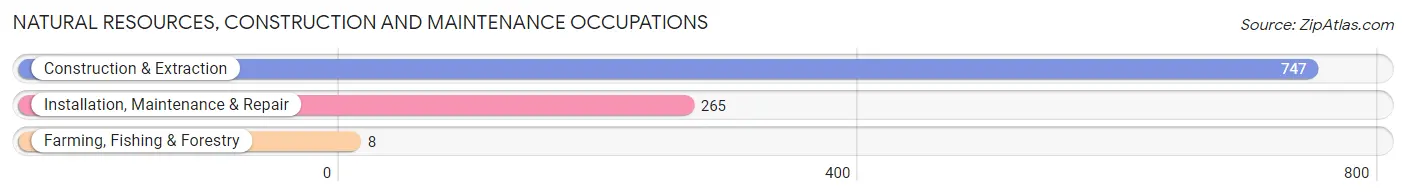
Natural Resources, Construction and Maintenance Occupations
The most common Natural Resources, Construction and Maintenance occupations in Sun Village are Construction & Extraction (747 | 17.9%), Installation, Maintenance & Repair (265 | 6.3%), and Farming, Fishing & Forestry (8 | 0.2%).
Natural Resources, Construction and Maintenance Occupations by Sex
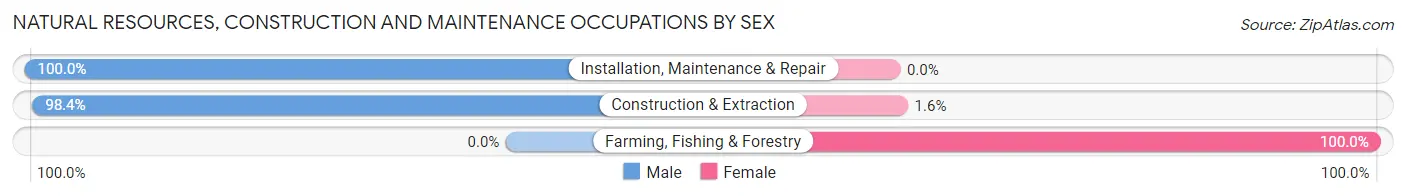
| Occupation | Male | Female |
| Farming, Fishing & Forestry | 0 (0.0%) | 8 (100.0%) |
| Construction & Extraction | 735 (98.4%) | 12 (1.6%) |
| Installation, Maintenance & Repair | 265 (100.0%) | 0 (0.0%) |
| Total (Category) | 1,000 (98.0%) | 20 (2.0%) |
| Total (Overall) | 2,776 (66.4%) | 1,402 (33.6%) |
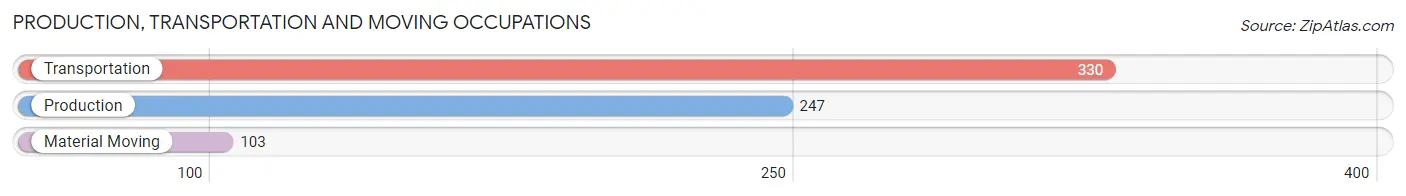
Production, Transportation and Moving Occupations
The most common Production, Transportation and Moving occupations in Sun Village are Transportation (330 | 7.9%), Production (247 | 5.9%), and Material Moving (103 | 2.5%).
Production, Transportation and Moving Occupations by Sex
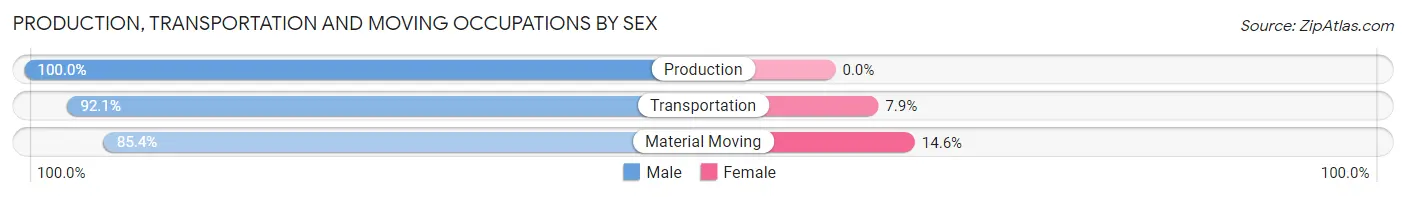
| Occupation | Male | Female |
| Production | 247 (100.0%) | 0 (0.0%) |
| Transportation | 304 (92.1%) | 26 (7.9%) |
| Material Moving | 88 (85.4%) | 15 (14.6%) |
| Total (Category) | 639 (94.0%) | 41 (6.0%) |
| Total (Overall) | 2,776 (66.4%) | 1,402 (33.6%) |
Employment Industries by Sex in Sun Village
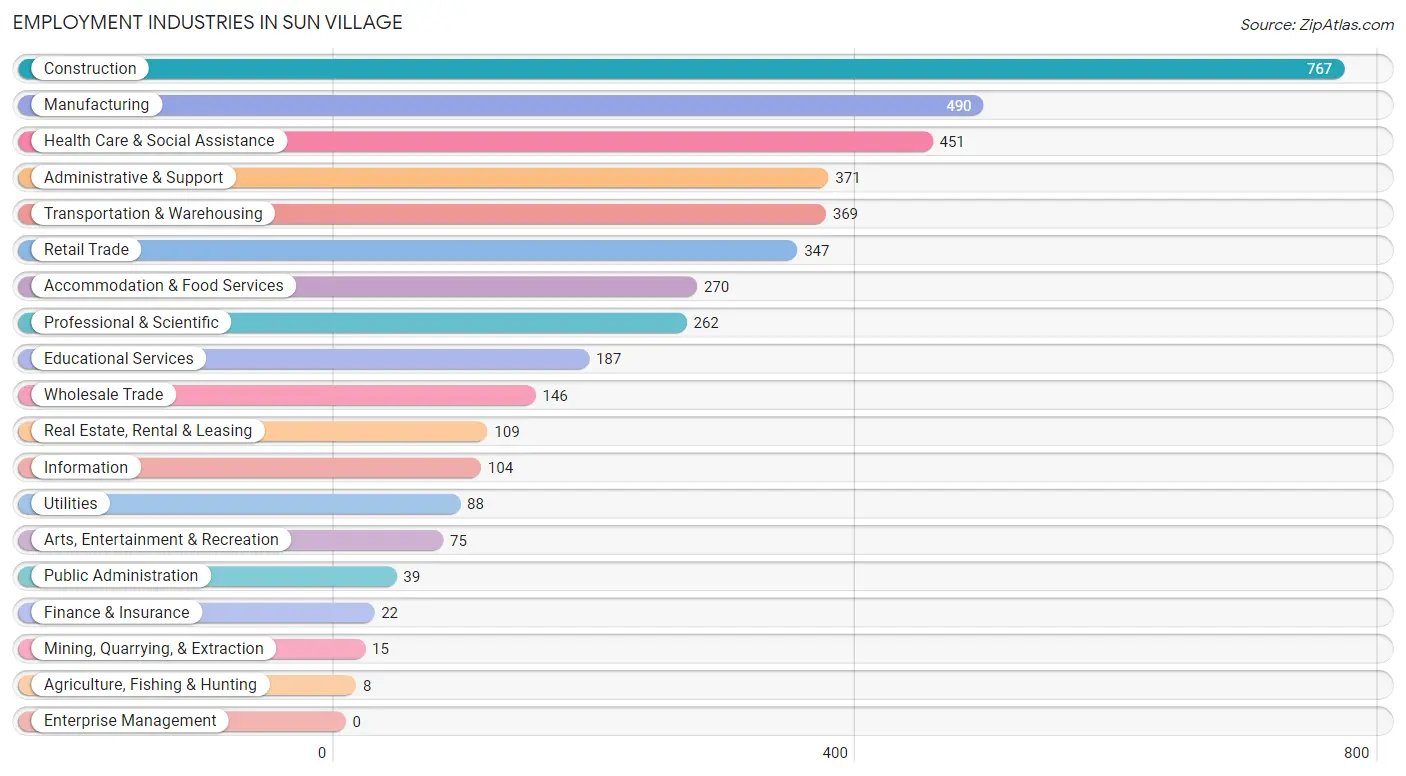
Employment Industries in Sun Village
The major employment industries in Sun Village include Construction (767 | 18.4%), Manufacturing (490 | 11.7%), Health Care & Social Assistance (451 | 10.8%), Administrative & Support (371 | 8.9%), and Transportation & Warehousing (369 | 8.8%).
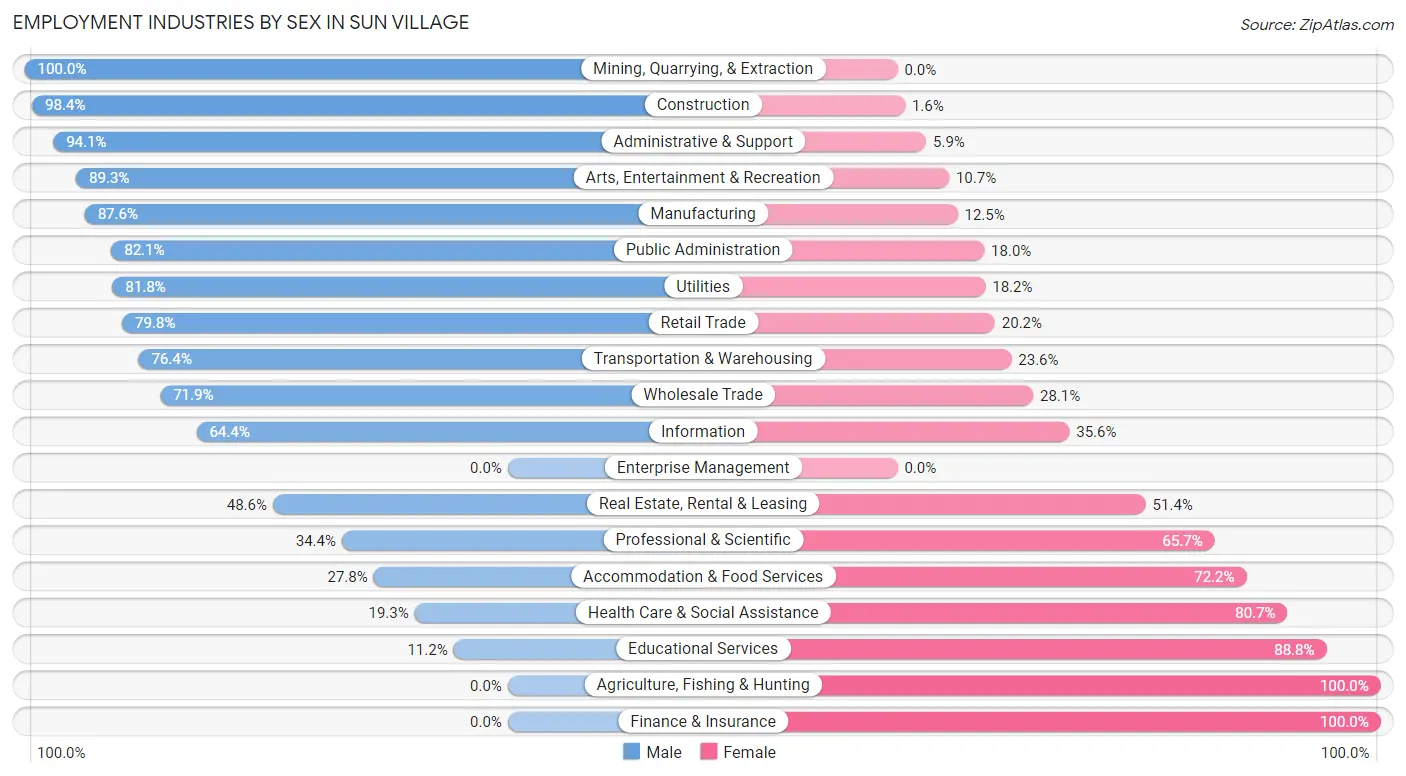
Employment Industries by Sex in Sun Village
The Sun Village industries that see more men than women are Mining, Quarrying, & Extraction (100.0%), Construction (98.4%), and Administrative & Support (94.1%), whereas the industries that tend to have a higher number of women are Agriculture, Fishing & Hunting (100.0%), Finance & Insurance (100.0%), and Educational Services (88.8%).
| Industry | Male | Female |
| Agriculture, Fishing & Hunting | 0 (0.0%) | 8 (100.0%) |
| Mining, Quarrying, & Extraction | 15 (100.0%) | 0 (0.0%) |
| Construction | 755 (98.4%) | 12 (1.6%) |
| Manufacturing | 429 (87.5%) | 61 (12.4%) |
| Wholesale Trade | 105 (71.9%) | 41 (28.1%) |
| Retail Trade | 277 (79.8%) | 70 (20.2%) |
| Transportation & Warehousing | 282 (76.4%) | 87 (23.6%) |
| Utilities | 72 (81.8%) | 16 (18.2%) |
| Information | 67 (64.4%) | 37 (35.6%) |
| Finance & Insurance | 0 (0.0%) | 22 (100.0%) |
| Real Estate, Rental & Leasing | 53 (48.6%) | 56 (51.4%) |
| Professional & Scientific | 90 (34.4%) | 172 (65.6%) |
| Enterprise Management | 0 (0.0%) | 0 (0.0%) |
| Administrative & Support | 349 (94.1%) | 22 (5.9%) |
| Educational Services | 21 (11.2%) | 166 (88.8%) |
| Health Care & Social Assistance | 87 (19.3%) | 364 (80.7%) |
| Arts, Entertainment & Recreation | 67 (89.3%) | 8 (10.7%) |
| Accommodation & Food Services | 75 (27.8%) | 195 (72.2%) |
| Public Administration | 32 (82.1%) | 7 (17.9%) |
| Total | 2,776 (66.4%) | 1,402 (33.6%) |
Education in Sun Village
School Enrollment in Sun Village
The most common levels of schooling among the 2,898 students in Sun Village are middle school (801 | 27.6%), high school (764 | 26.4%), and elementary school (532 | 18.4%).
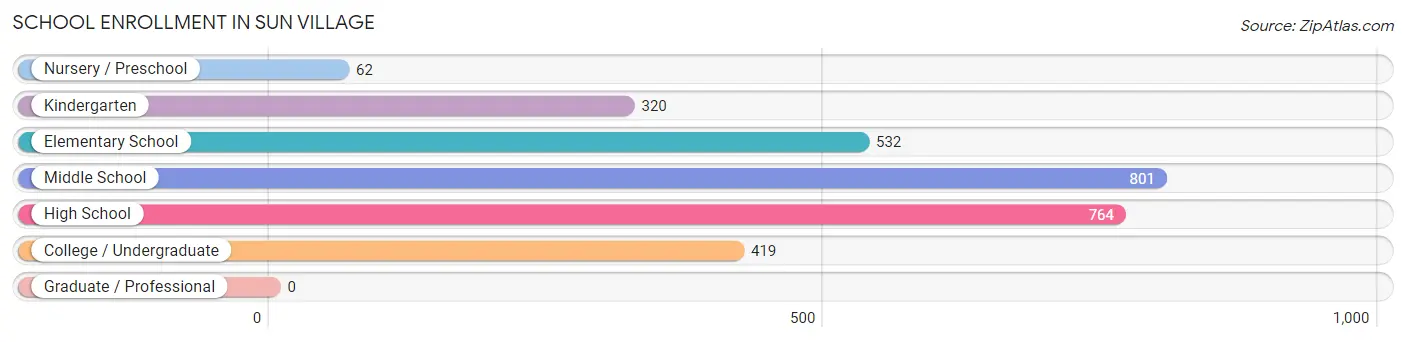
| School Level | # Students | % Students |
| Nursery / Preschool | 62 | 2.1% |
| Kindergarten | 320 | 11.0% |
| Elementary School | 532 | 18.4% |
| Middle School | 801 | 27.6% |
| High School | 764 | 26.4% |
| College / Undergraduate | 419 | 14.5% |
| Graduate / Professional | 0 | 0.0% |
| Total | 2,898 | 100.0% |
School Enrollment by Age by Funding Source in Sun Village
Out of a total of 2,898 students who are enrolled in schools in Sun Village, 180 (6.2%) attend a private institution, while the remaining 2,718 (93.8%) are enrolled in public schools. The age group of 25 to 34 year olds has the highest likelihood of being enrolled in private schools, with 67 (70.5% in the age bracket) enrolled. Conversely, the age group of 3 to 4 year olds has the lowest likelihood of being enrolled in a private school, with 66 (100.0% in the age bracket) attending a public institution.
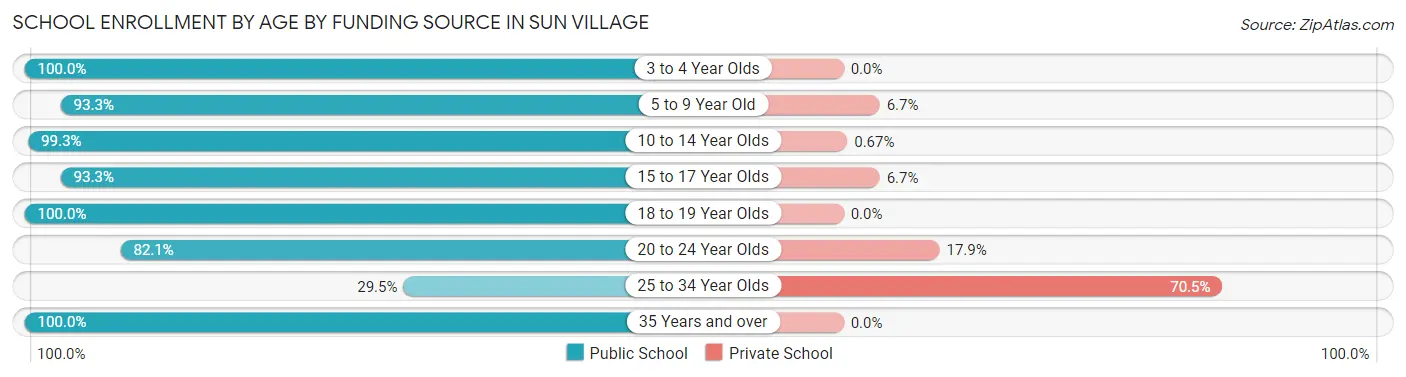
| Age Bracket | Public School | Private School |
| 3 to 4 Year Olds | 66 (100.0%) | 0 (0.0%) |
| 5 to 9 Year Old | 722 (93.3%) | 52 (6.7%) |
| 10 to 14 Year Olds | 1,191 (99.3%) | 8 (0.7%) |
| 15 to 17 Year Olds | 389 (93.3%) | 28 (6.7%) |
| 18 to 19 Year Olds | 169 (100.0%) | 0 (0.0%) |
| 20 to 24 Year Olds | 115 (82.1%) | 25 (17.9%) |
| 25 to 34 Year Olds | 28 (29.5%) | 67 (70.5%) |
| 35 Years and over | 38 (100.0%) | 0 (0.0%) |
| Total | 2,718 (93.8%) | 180 (6.2%) |
Educational Attainment by Field of Study in Sun Village
Engineering (117 | 30.9%), business (91 | 24.1%), liberal arts & history (59 | 15.6%), arts & humanities (32 | 8.5%), and science & technology (18 | 4.8%) are the most common fields of study among 378 individuals in Sun Village who have obtained a bachelor's degree or higher.
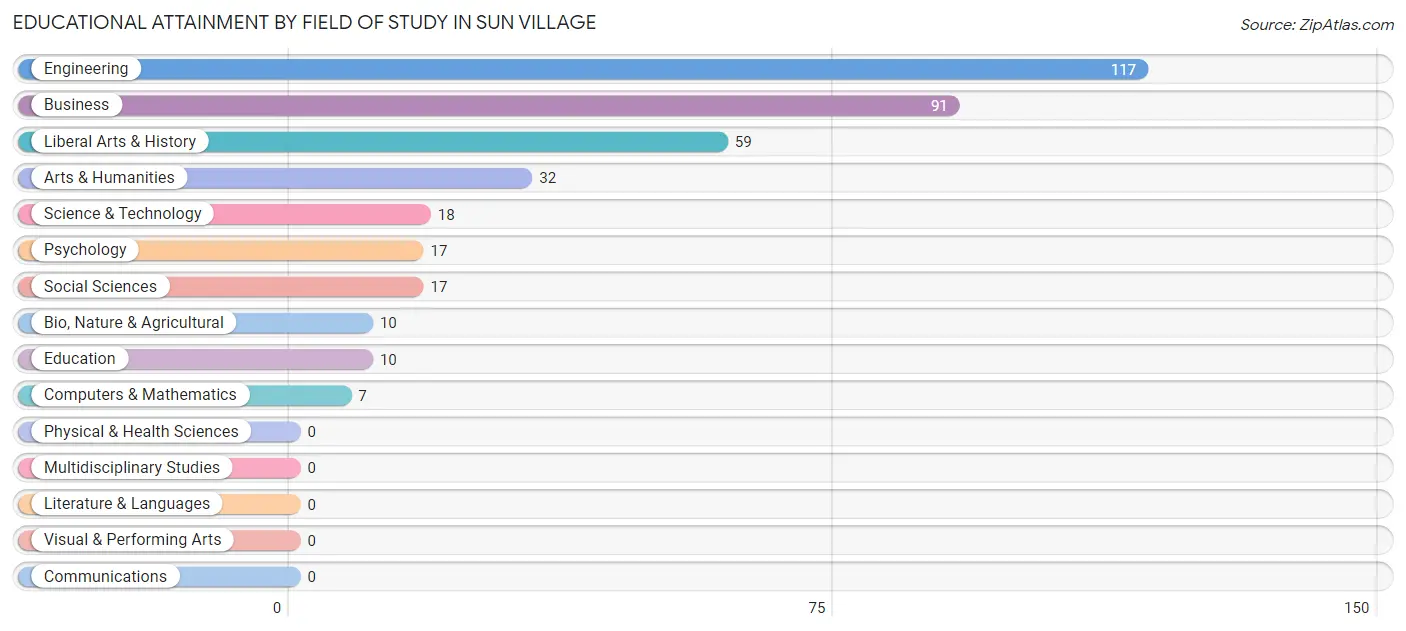
| Field of Study | # Graduates | % Graduates |
| Computers & Mathematics | 7 | 1.8% |
| Bio, Nature & Agricultural | 10 | 2.6% |
| Physical & Health Sciences | 0 | 0.0% |
| Psychology | 17 | 4.5% |
| Social Sciences | 17 | 4.5% |
| Engineering | 117 | 30.9% |
| Multidisciplinary Studies | 0 | 0.0% |
| Science & Technology | 18 | 4.8% |
| Business | 91 | 24.1% |
| Education | 10 | 2.6% |
| Literature & Languages | 0 | 0.0% |
| Liberal Arts & History | 59 | 15.6% |
| Visual & Performing Arts | 0 | 0.0% |
| Communications | 0 | 0.0% |
| Arts & Humanities | 32 | 8.5% |
| Total | 378 | 100.0% |
Transportation & Commute in Sun Village
Vehicle Availability by Sex in Sun Village
The most prevalent vehicle ownership categories in Sun Village are males with 3 vehicles (871, accounting for 32.2%) and females with 3 vehicles (414, making up 62.1%).
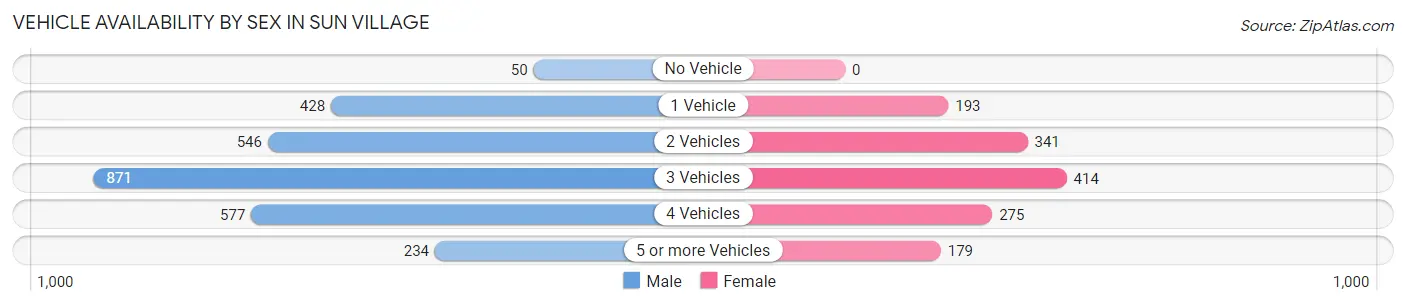
| Vehicles Available | Male | Female |
| No Vehicle | 50 (1.8%) | 0 (0.0%) |
| 1 Vehicle | 428 (15.8%) | 193 (13.8%) |
| 2 Vehicles | 546 (20.2%) | 341 (24.3%) |
| 3 Vehicles | 871 (32.2%) | 414 (29.5%) |
| 4 Vehicles | 577 (21.3%) | 275 (19.6%) |
| 5 or more Vehicles | 234 (8.6%) | 179 (12.8%) |
| Total | 2,706 (100.0%) | 1,402 (100.0%) |
Commute Time in Sun Village
The most frequently occuring commute durations in Sun Village are 20 to 24 minutes (940 commuters, 23.7%), 60 to 89 minutes (734 commuters, 18.5%), and 30 to 34 minutes (525 commuters, 13.3%).
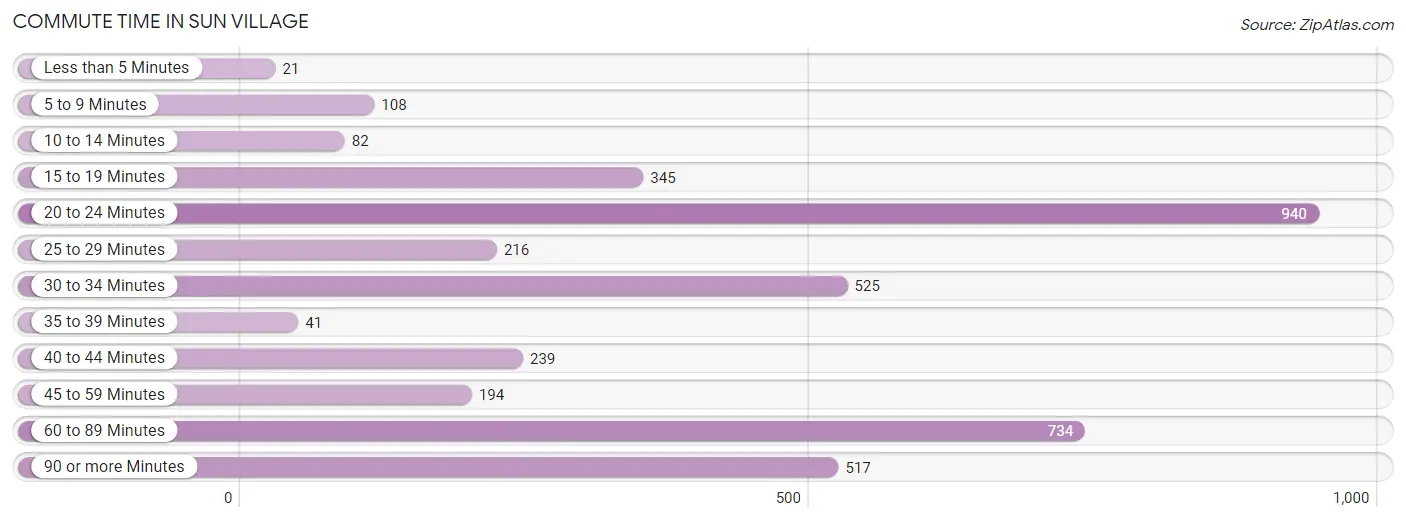
| Commute Time | # Commuters | % Commuters |
| Less than 5 Minutes | 21 | 0.5% |
| 5 to 9 Minutes | 108 | 2.7% |
| 10 to 14 Minutes | 82 | 2.1% |
| 15 to 19 Minutes | 345 | 8.7% |
| 20 to 24 Minutes | 940 | 23.7% |
| 25 to 29 Minutes | 216 | 5.4% |
| 30 to 34 Minutes | 525 | 13.3% |
| 35 to 39 Minutes | 41 | 1.0% |
| 40 to 44 Minutes | 239 | 6.0% |
| 45 to 59 Minutes | 194 | 4.9% |
| 60 to 89 Minutes | 734 | 18.5% |
| 90 or more Minutes | 517 | 13.1% |
Commute Time by Sex in Sun Village
The most common commute times in Sun Village are 60 to 89 minutes (574 commuters, 22.2%) for males and 20 to 24 minutes (396 commuters, 28.8%) for females.
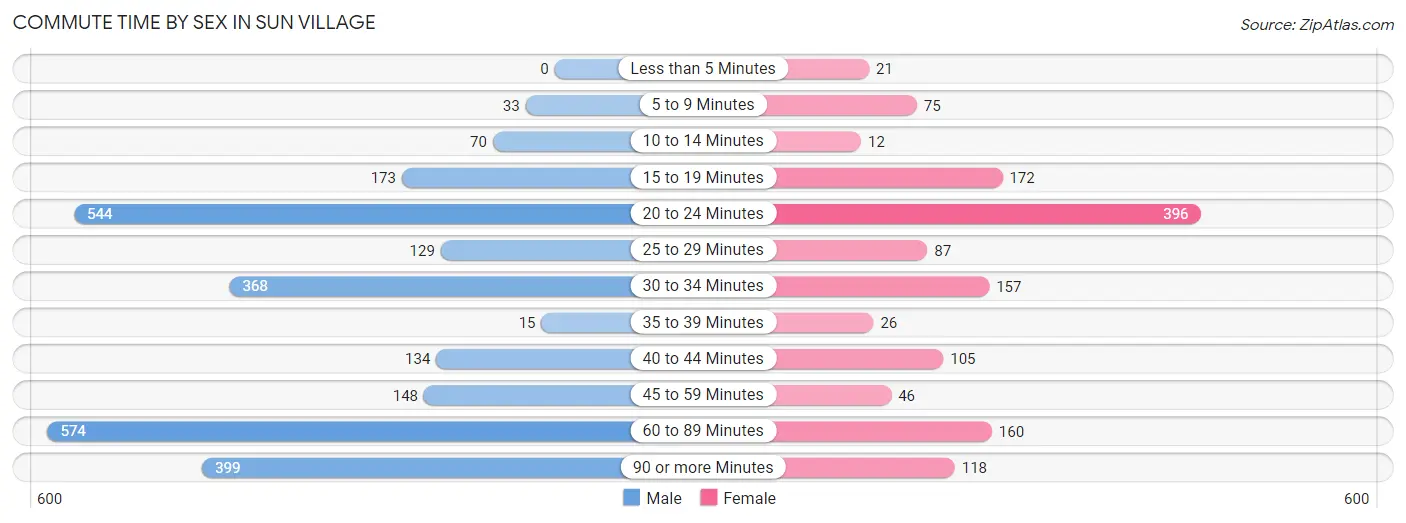
| Commute Time | Male | Female |
| Less than 5 Minutes | 0 (0.0%) | 21 (1.5%) |
| 5 to 9 Minutes | 33 (1.3%) | 75 (5.4%) |
| 10 to 14 Minutes | 70 (2.7%) | 12 (0.9%) |
| 15 to 19 Minutes | 173 (6.7%) | 172 (12.5%) |
| 20 to 24 Minutes | 544 (21.0%) | 396 (28.8%) |
| 25 to 29 Minutes | 129 (5.0%) | 87 (6.3%) |
| 30 to 34 Minutes | 368 (14.2%) | 157 (11.4%) |
| 35 to 39 Minutes | 15 (0.6%) | 26 (1.9%) |
| 40 to 44 Minutes | 134 (5.2%) | 105 (7.6%) |
| 45 to 59 Minutes | 148 (5.7%) | 46 (3.4%) |
| 60 to 89 Minutes | 574 (22.2%) | 160 (11.6%) |
| 90 or more Minutes | 399 (15.4%) | 118 (8.6%) |
Time of Departure to Work by Sex in Sun Village
The most frequent times of departure to work in Sun Village are 6:00 AM to 6:29 AM (588, 22.7%) for males and 8:00 AM to 8:29 AM (362, 26.3%) for females.
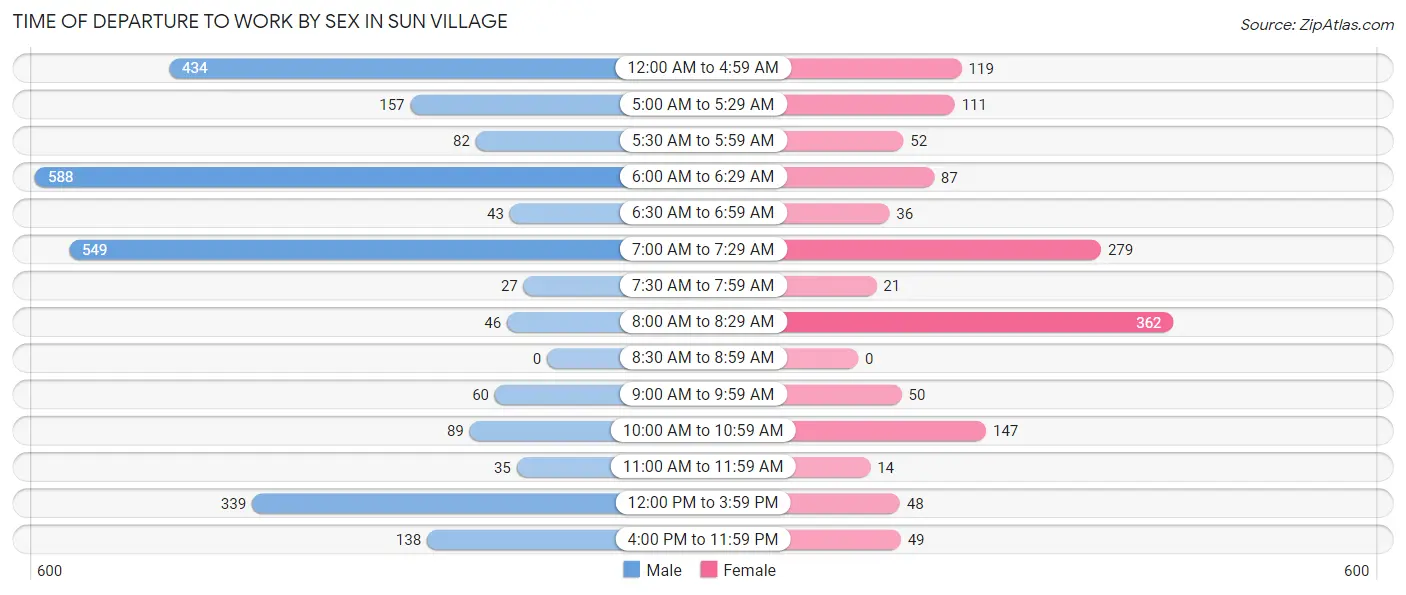
| Time of Departure | Male | Female |
| 12:00 AM to 4:59 AM | 434 (16.8%) | 119 (8.6%) |
| 5:00 AM to 5:29 AM | 157 (6.1%) | 111 (8.1%) |
| 5:30 AM to 5:59 AM | 82 (3.2%) | 52 (3.8%) |
| 6:00 AM to 6:29 AM | 588 (22.7%) | 87 (6.3%) |
| 6:30 AM to 6:59 AM | 43 (1.7%) | 36 (2.6%) |
| 7:00 AM to 7:29 AM | 549 (21.2%) | 279 (20.3%) |
| 7:30 AM to 7:59 AM | 27 (1.0%) | 21 (1.5%) |
| 8:00 AM to 8:29 AM | 46 (1.8%) | 362 (26.3%) |
| 8:30 AM to 8:59 AM | 0 (0.0%) | 0 (0.0%) |
| 9:00 AM to 9:59 AM | 60 (2.3%) | 50 (3.6%) |
| 10:00 AM to 10:59 AM | 89 (3.4%) | 147 (10.7%) |
| 11:00 AM to 11:59 AM | 35 (1.3%) | 14 (1.0%) |
| 12:00 PM to 3:59 PM | 339 (13.1%) | 48 (3.5%) |
| 4:00 PM to 11:59 PM | 138 (5.3%) | 49 (3.6%) |
| Total | 2,587 (100.0%) | 1,375 (100.0%) |
Housing Occupancy in Sun Village
Occupancy by Ownership in Sun Village
Of the total 3,158 dwellings in Sun Village, owner-occupied units account for 2,172 (68.8%), while renter-occupied units make up 986 (31.2%).
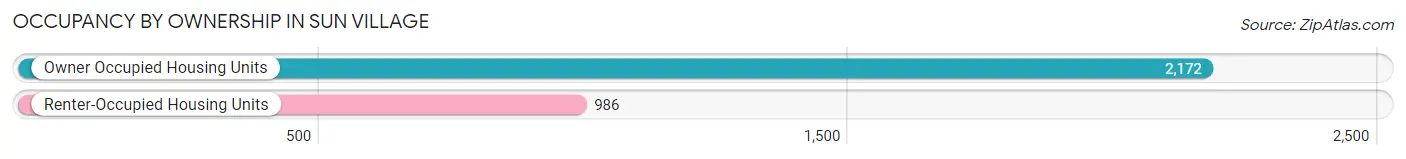
| Occupancy | # Housing Units | % Housing Units |
| Owner Occupied Housing Units | 2,172 | 68.8% |
| Renter-Occupied Housing Units | 986 | 31.2% |
| Total Occupied Housing Units | 3,158 | 100.0% |
Occupancy by Household Size in Sun Village
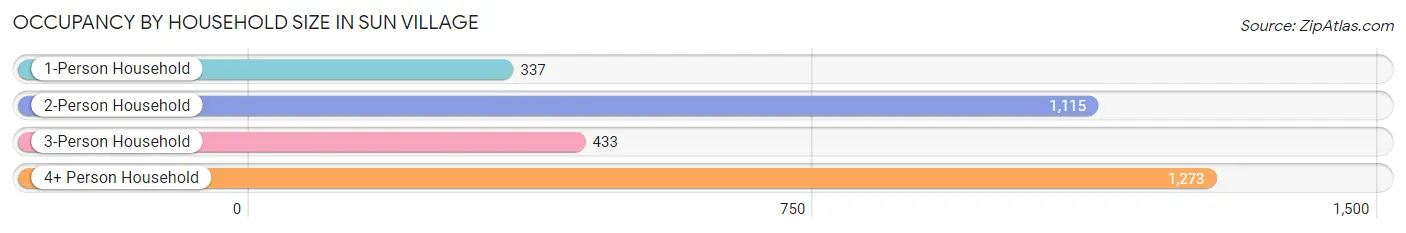
| Household Size | # Housing Units | % Housing Units |
| 1-Person Household | 337 | 10.7% |
| 2-Person Household | 1,115 | 35.3% |
| 3-Person Household | 433 | 13.7% |
| 4+ Person Household | 1,273 | 40.3% |
| Total Housing Units | 3,158 | 100.0% |
Occupancy by Ownership by Household Size in Sun Village
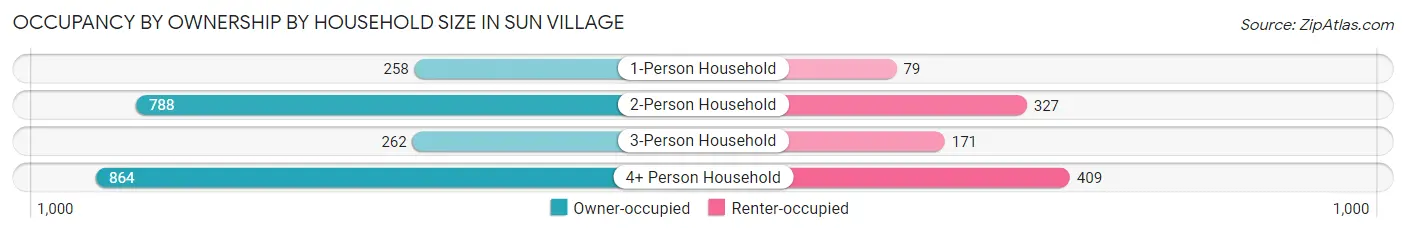
| Household Size | Owner-occupied | Renter-occupied |
| 1-Person Household | 258 (76.6%) | 79 (23.4%) |
| 2-Person Household | 788 (70.7%) | 327 (29.3%) |
| 3-Person Household | 262 (60.5%) | 171 (39.5%) |
| 4+ Person Household | 864 (67.9%) | 409 (32.1%) |
| Total Housing Units | 2,172 (68.8%) | 986 (31.2%) |
Occupancy by Educational Attainment in Sun Village
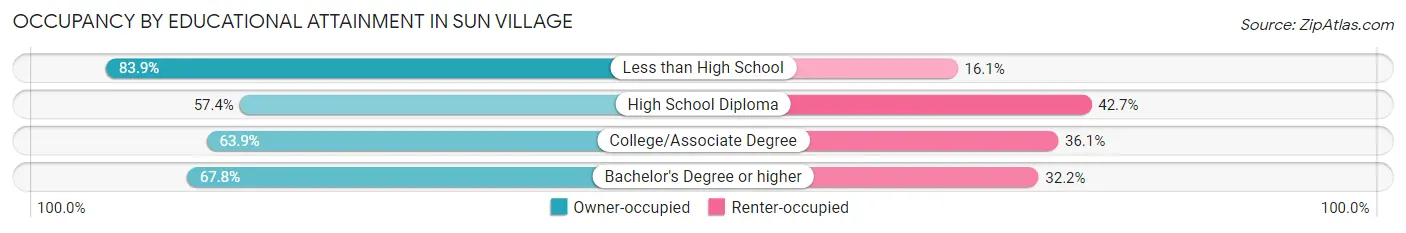
| Household Size | Owner-occupied | Renter-occupied |
| Less than High School | 905 (83.9%) | 174 (16.1%) |
| High School Diploma | 620 (57.4%) | 461 (42.6%) |
| College/Associate Degree | 493 (63.9%) | 278 (36.1%) |
| Bachelor's Degree or higher | 154 (67.8%) | 73 (32.2%) |
Occupancy by Age of Householder in Sun Village
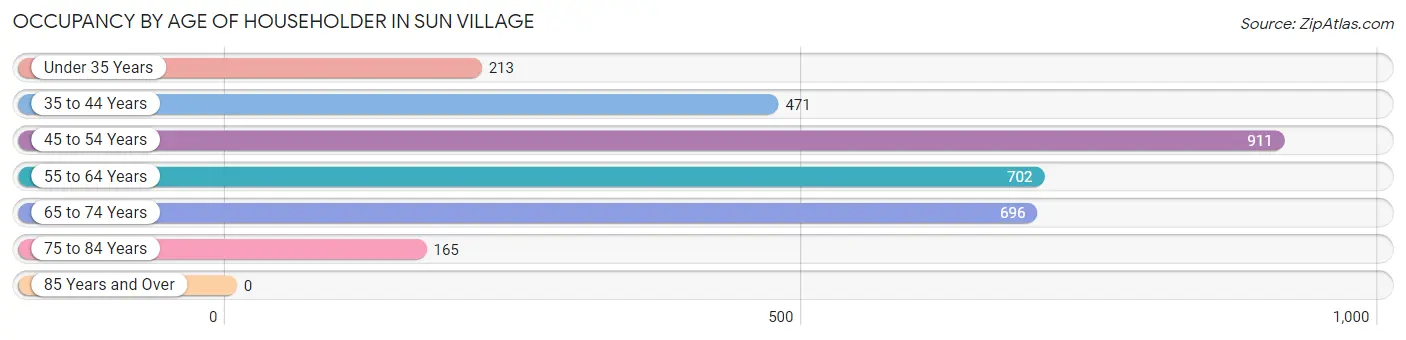
| Age Bracket | # Households | % Households |
| Under 35 Years | 213 | 6.7% |
| 35 to 44 Years | 471 | 14.9% |
| 45 to 54 Years | 911 | 28.8% |
| 55 to 64 Years | 702 | 22.2% |
| 65 to 74 Years | 696 | 22.0% |
| 75 to 84 Years | 165 | 5.2% |
| 85 Years and Over | 0 | 0.0% |
| Total | 3,158 | 100.0% |
Housing Finances in Sun Village
Median Income by Occupancy in Sun Village
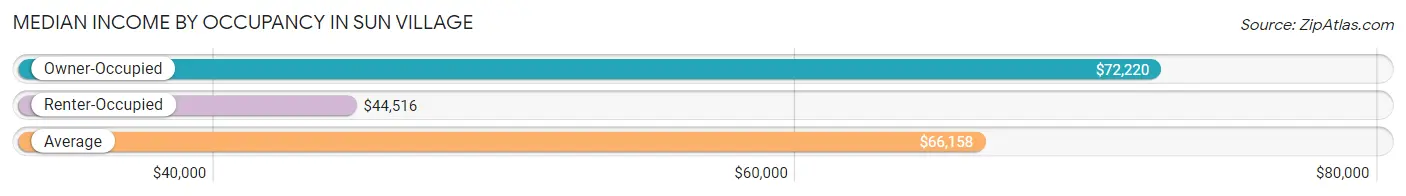
| Occupancy Type | # Households | Median Income |
| Owner-Occupied | 2,172 (68.8%) | $72,220 |
| Renter-Occupied | 986 (31.2%) | $44,516 |
| Average | 3,158 (100.0%) | $66,158 |
Occupancy by Householder Income Bracket in Sun Village
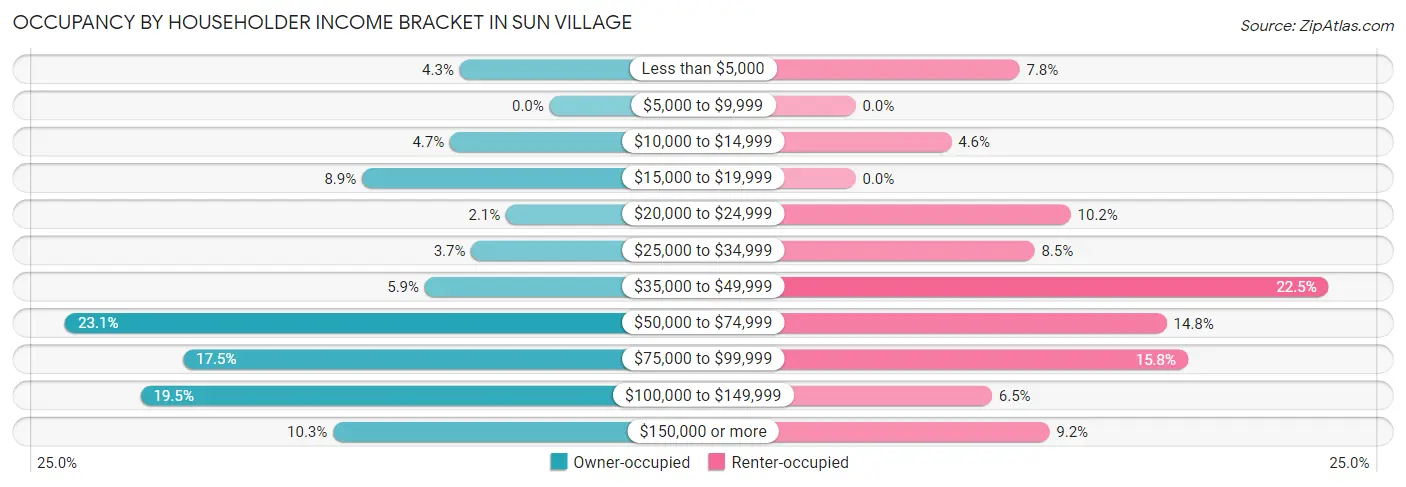
| Income Bracket | Owner-occupied | Renter-occupied |
| Less than $5,000 | 93 (4.3%) | 77 (7.8%) |
| $5,000 to $9,999 | 0 (0.0%) | 0 (0.0%) |
| $10,000 to $14,999 | 103 (4.7%) | 45 (4.6%) |
| $15,000 to $19,999 | 194 (8.9%) | 0 (0.0%) |
| $20,000 to $24,999 | 45 (2.1%) | 101 (10.2%) |
| $25,000 to $34,999 | 81 (3.7%) | 84 (8.5%) |
| $35,000 to $49,999 | 129 (5.9%) | 222 (22.5%) |
| $50,000 to $74,999 | 501 (23.1%) | 146 (14.8%) |
| $75,000 to $99,999 | 379 (17.4%) | 156 (15.8%) |
| $100,000 to $149,999 | 423 (19.5%) | 64 (6.5%) |
| $150,000 or more | 224 (10.3%) | 91 (9.2%) |
| Total | 2,172 (100.0%) | 986 (100.0%) |
Monthly Housing Cost Tiers in Sun Village
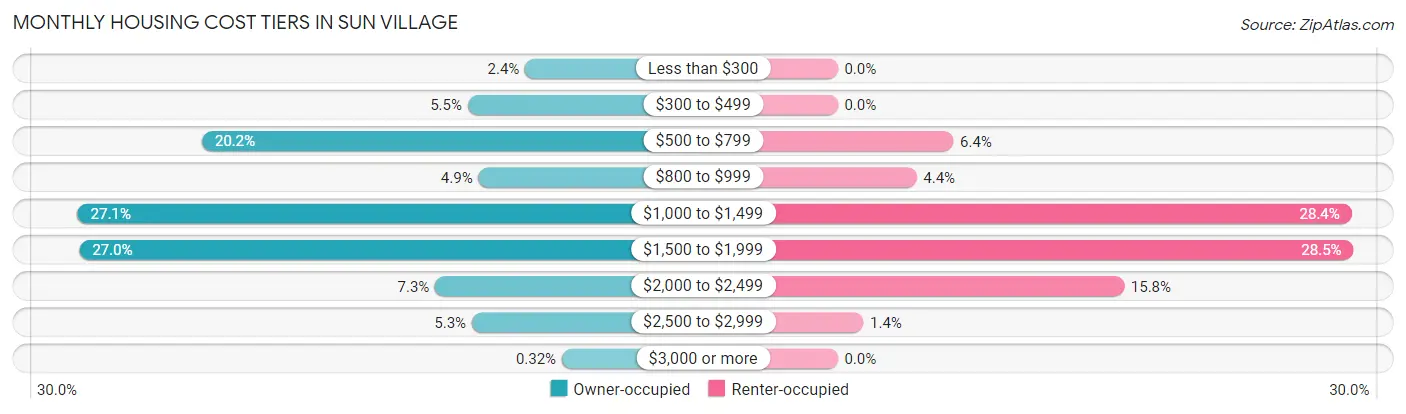
| Monthly Cost | Owner-occupied | Renter-occupied |
| Less than $300 | 51 (2.4%) | 0 (0.0%) |
| $300 to $499 | 120 (5.5%) | 0 (0.0%) |
| $500 to $799 | 439 (20.2%) | 63 (6.4%) |
| $800 to $999 | 107 (4.9%) | 43 (4.4%) |
| $1,000 to $1,499 | 588 (27.1%) | 280 (28.4%) |
| $1,500 to $1,999 | 586 (27.0%) | 281 (28.5%) |
| $2,000 to $2,499 | 159 (7.3%) | 156 (15.8%) |
| $2,500 to $2,999 | 115 (5.3%) | 14 (1.4%) |
| $3,000 or more | 7 (0.3%) | 0 (0.0%) |
| Total | 2,172 (100.0%) | 986 (100.0%) |
Physical Housing Characteristics in Sun Village
Housing Structures in Sun Village
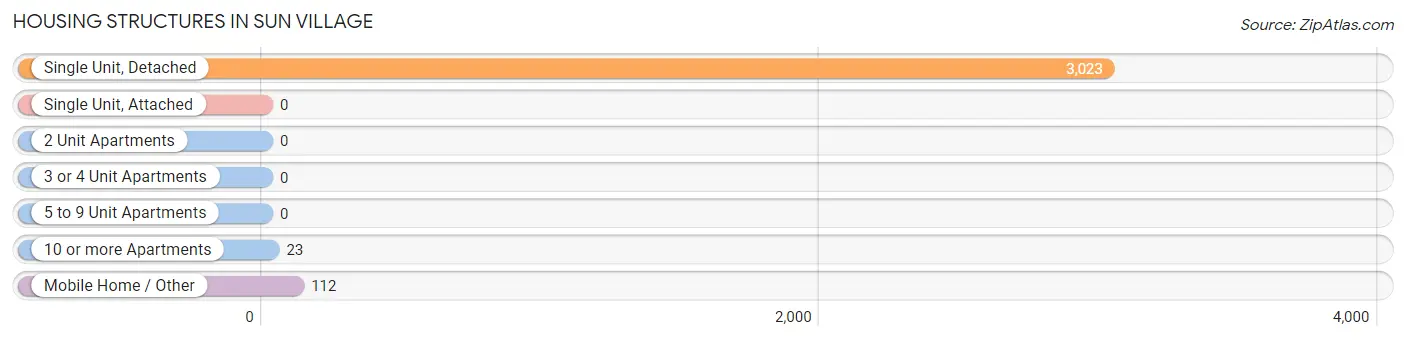
| Structure Type | # Housing Units | % Housing Units |
| Single Unit, Detached | 3,023 | 95.7% |
| Single Unit, Attached | 0 | 0.0% |
| 2 Unit Apartments | 0 | 0.0% |
| 3 or 4 Unit Apartments | 0 | 0.0% |
| 5 to 9 Unit Apartments | 0 | 0.0% |
| 10 or more Apartments | 23 | 0.7% |
| Mobile Home / Other | 112 | 3.5% |
| Total | 3,158 | 100.0% |
Housing Structures by Occupancy in Sun Village
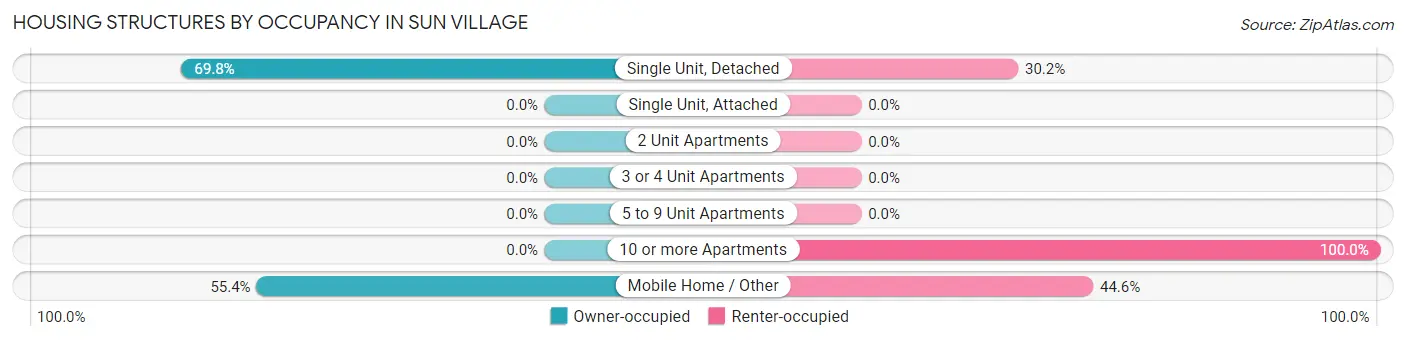
| Structure Type | Owner-occupied | Renter-occupied |
| Single Unit, Detached | 2,110 (69.8%) | 913 (30.2%) |
| Single Unit, Attached | 0 (0.0%) | 0 (0.0%) |
| 2 Unit Apartments | 0 (0.0%) | 0 (0.0%) |
| 3 or 4 Unit Apartments | 0 (0.0%) | 0 (0.0%) |
| 5 to 9 Unit Apartments | 0 (0.0%) | 0 (0.0%) |
| 10 or more Apartments | 0 (0.0%) | 23 (100.0%) |
| Mobile Home / Other | 62 (55.4%) | 50 (44.6%) |
| Total | 2,172 (68.8%) | 986 (31.2%) |
Housing Structures by Number of Rooms in Sun Village
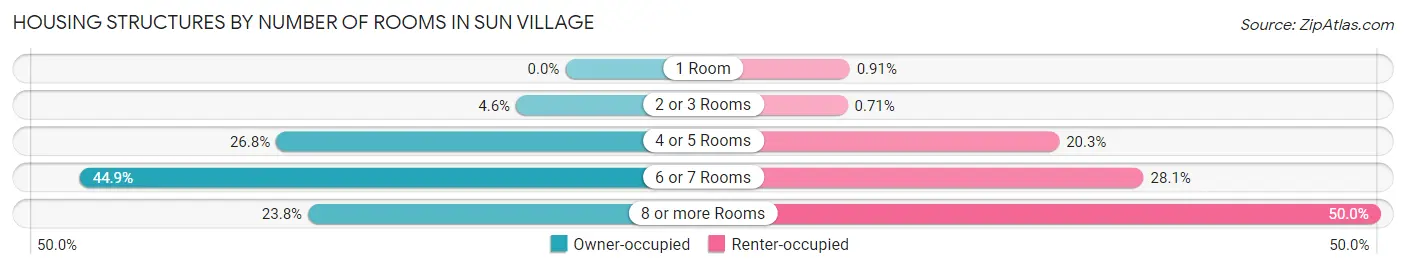
| Number of Rooms | Owner-occupied | Renter-occupied |
| 1 Room | 0 (0.0%) | 9 (0.9%) |
| 2 or 3 Rooms | 99 (4.6%) | 7 (0.7%) |
| 4 or 5 Rooms | 581 (26.8%) | 200 (20.3%) |
| 6 or 7 Rooms | 975 (44.9%) | 277 (28.1%) |
| 8 or more Rooms | 517 (23.8%) | 493 (50.0%) |
| Total | 2,172 (100.0%) | 986 (100.0%) |
Housing Structure by Heating Type in Sun Village
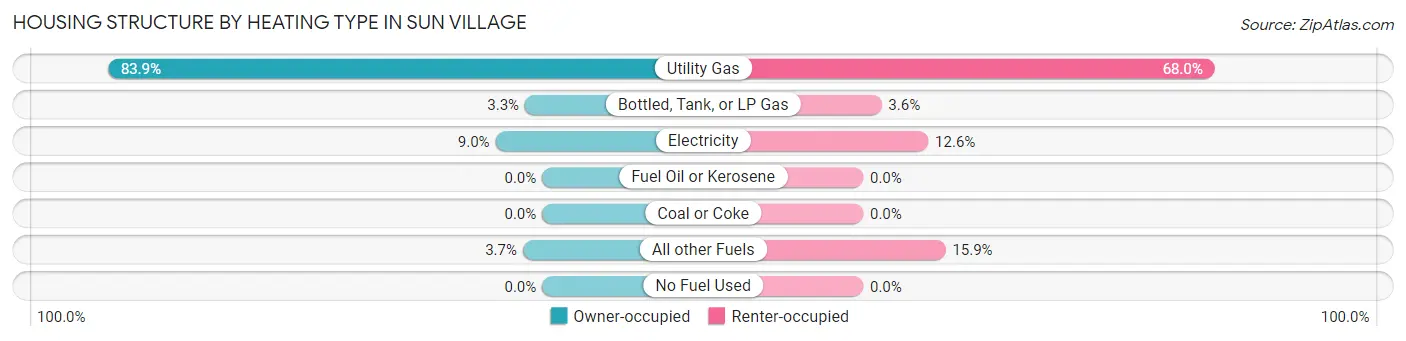
| Heating Type | Owner-occupied | Renter-occupied |
| Utility Gas | 1,823 (83.9%) | 670 (67.9%) |
| Bottled, Tank, or LP Gas | 72 (3.3%) | 35 (3.5%) |
| Electricity | 196 (9.0%) | 124 (12.6%) |
| Fuel Oil or Kerosene | 0 (0.0%) | 0 (0.0%) |
| Coal or Coke | 0 (0.0%) | 0 (0.0%) |
| All other Fuels | 81 (3.7%) | 157 (15.9%) |
| No Fuel Used | 0 (0.0%) | 0 (0.0%) |
| Total | 2,172 (100.0%) | 986 (100.0%) |
Household Vehicle Usage in Sun Village
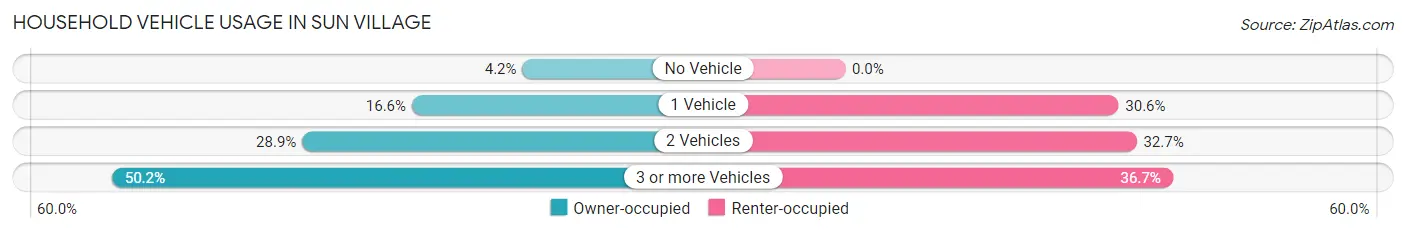
| Vehicles per Household | Owner-occupied | Renter-occupied |
| No Vehicle | 92 (4.2%) | 0 (0.0%) |
| 1 Vehicle | 361 (16.6%) | 302 (30.6%) |
| 2 Vehicles | 628 (28.9%) | 322 (32.7%) |
| 3 or more Vehicles | 1,091 (50.2%) | 362 (36.7%) |
| Total | 2,172 (100.0%) | 986 (100.0%) |
Real Estate & Mortgages in Sun Village
Real Estate and Mortgage Overview in Sun Village
| Characteristic | Without Mortgage | With Mortgage |
| Housing Units | 629 | 1,543 |
| Median Property Value | $313,000 | $334,700 |
| Median Household Income | $70,343 | $166 |
| Monthly Housing Costs | $586 | $7 |
| Real Estate Taxes | $2,432 | $46 |
Property Value by Mortgage Status in Sun Village
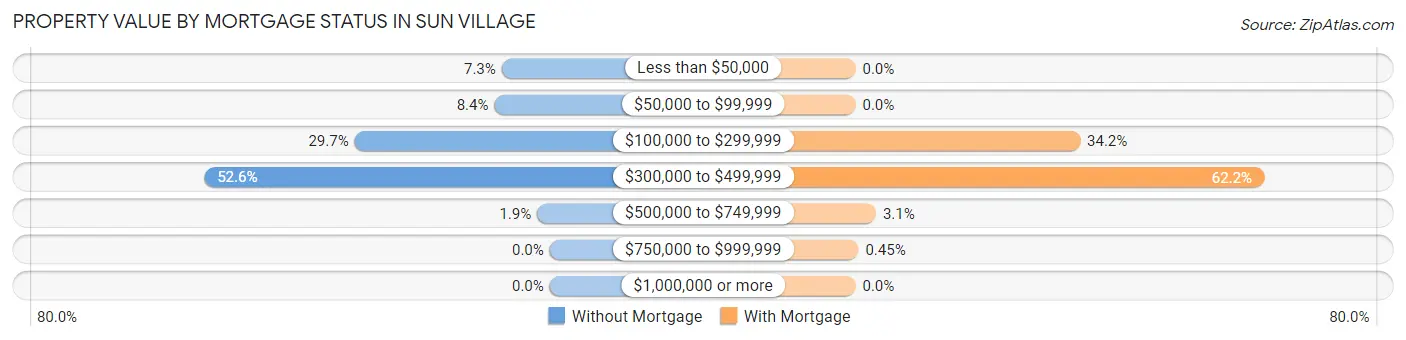
| Property Value | Without Mortgage | With Mortgage |
| Less than $50,000 | 46 (7.3%) | 0 (0.0%) |
| $50,000 to $99,999 | 53 (8.4%) | 0 (0.0%) |
| $100,000 to $299,999 | 187 (29.7%) | 528 (34.2%) |
| $300,000 to $499,999 | 331 (52.6%) | 960 (62.2%) |
| $500,000 to $749,999 | 12 (1.9%) | 48 (3.1%) |
| $750,000 to $999,999 | 0 (0.0%) | 7 (0.4%) |
| $1,000,000 or more | 0 (0.0%) | 0 (0.0%) |
| Total | 629 (100.0%) | 1,543 (100.0%) |
Household Income by Mortgage Status in Sun Village
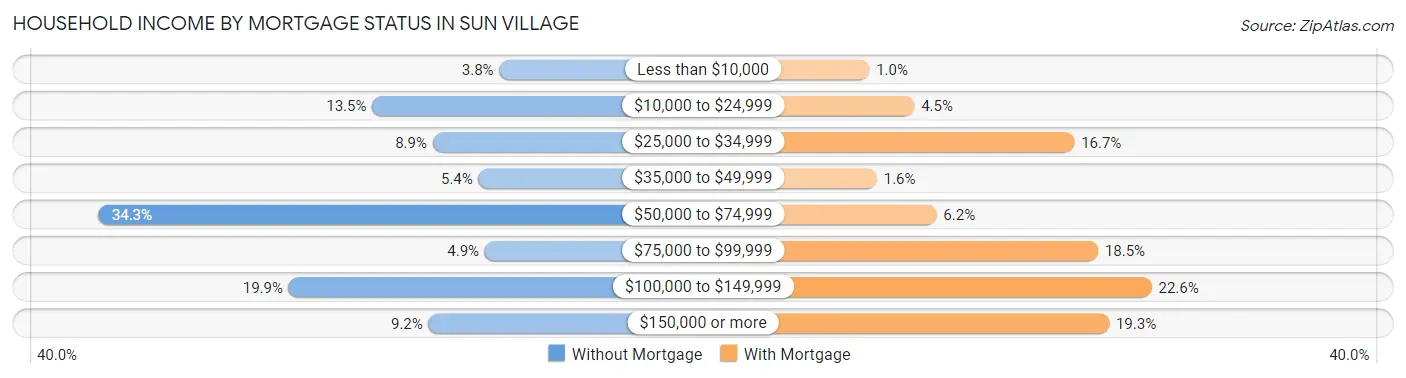
| Household Income | Without Mortgage | With Mortgage |
| Less than $10,000 | 24 (3.8%) | 16 (1.0%) |
| $10,000 to $24,999 | 85 (13.5%) | 69 (4.5%) |
| $25,000 to $34,999 | 56 (8.9%) | 257 (16.7%) |
| $35,000 to $49,999 | 34 (5.4%) | 25 (1.6%) |
| $50,000 to $74,999 | 216 (34.3%) | 95 (6.2%) |
| $75,000 to $99,999 | 31 (4.9%) | 285 (18.5%) |
| $100,000 to $149,999 | 125 (19.9%) | 348 (22.6%) |
| $150,000 or more | 58 (9.2%) | 298 (19.3%) |
| Total | 629 (100.0%) | 1,543 (100.0%) |
Property Value to Household Income Ratio in Sun Village
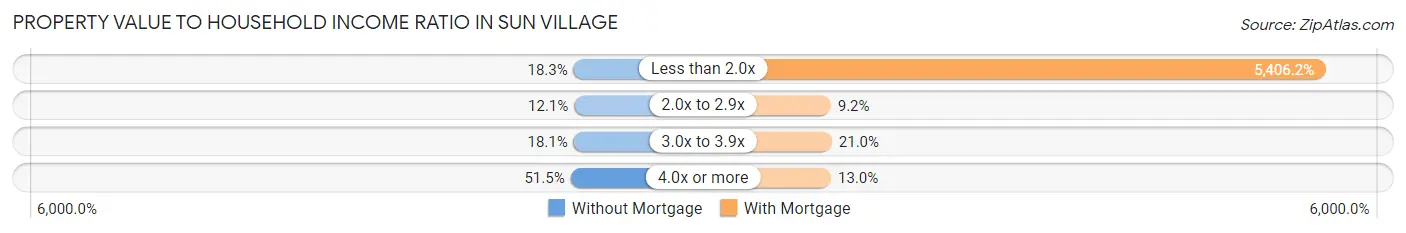
| Value-to-Income Ratio | Without Mortgage | With Mortgage |
| Less than 2.0x | 115 (18.3%) | 83,417 (5,406.2%) |
| 2.0x to 2.9x | 76 (12.1%) | 142 (9.2%) |
| 3.0x to 3.9x | 114 (18.1%) | 324 (21.0%) |
| 4.0x or more | 324 (51.5%) | 201 (13.0%) |
| Total | 629 (100.0%) | 1,543 (100.0%) |
Real Estate Taxes by Mortgage Status in Sun Village
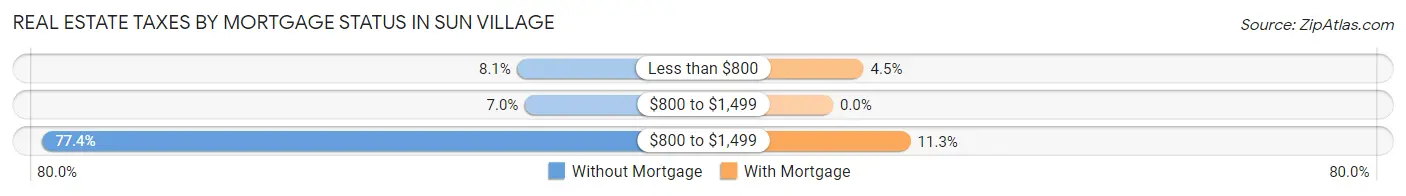
| Property Taxes | Without Mortgage | With Mortgage |
| Less than $800 | 51 (8.1%) | 69 (4.5%) |
| $800 to $1,499 | 44 (7.0%) | 0 (0.0%) |
| $800 to $1,499 | 487 (77.4%) | 175 (11.3%) |
| Total | 629 (100.0%) | 1,543 (100.0%) |
Health & Disability in Sun Village
Health Insurance Coverage by Age in Sun Village
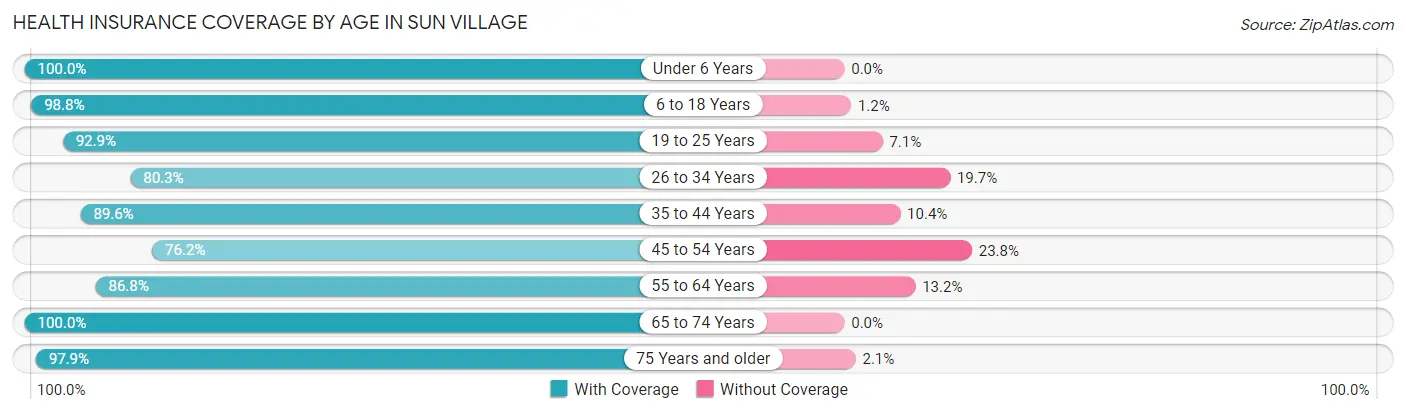
| Age Bracket | With Coverage | Without Coverage |
| Under 6 Years | 1,067 (100.0%) | 0 (0.0%) |
| 6 to 18 Years | 2,230 (98.8%) | 28 (1.2%) |
| 19 to 25 Years | 874 (92.9%) | 67 (7.1%) |
| 26 to 34 Years | 823 (80.3%) | 202 (19.7%) |
| 35 to 44 Years | 1,143 (89.6%) | 133 (10.4%) |
| 45 to 54 Years | 1,488 (76.2%) | 464 (23.8%) |
| 55 to 64 Years | 1,272 (86.8%) | 194 (13.2%) |
| 65 to 74 Years | 1,059 (100.0%) | 0 (0.0%) |
| 75 Years and older | 419 (97.9%) | 9 (2.1%) |
| Total | 10,375 (90.4%) | 1,097 (9.6%) |
Health Insurance Coverage by Citizenship Status in Sun Village
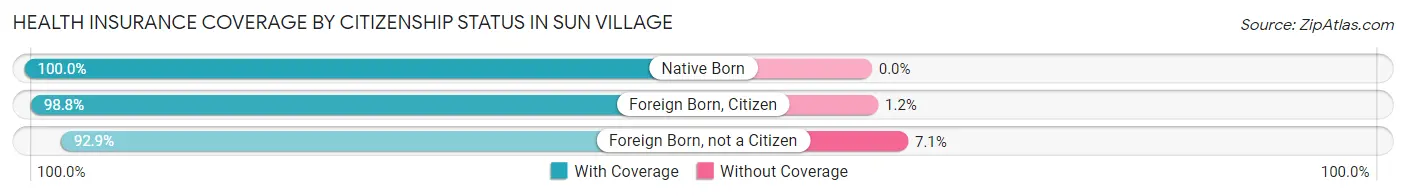
| Citizenship Status | With Coverage | Without Coverage |
| Native Born | 1,067 (100.0%) | 0 (0.0%) |
| Foreign Born, Citizen | 2,230 (98.8%) | 28 (1.2%) |
| Foreign Born, not a Citizen | 874 (92.9%) | 67 (7.1%) |
Health Insurance Coverage by Household Income in Sun Village
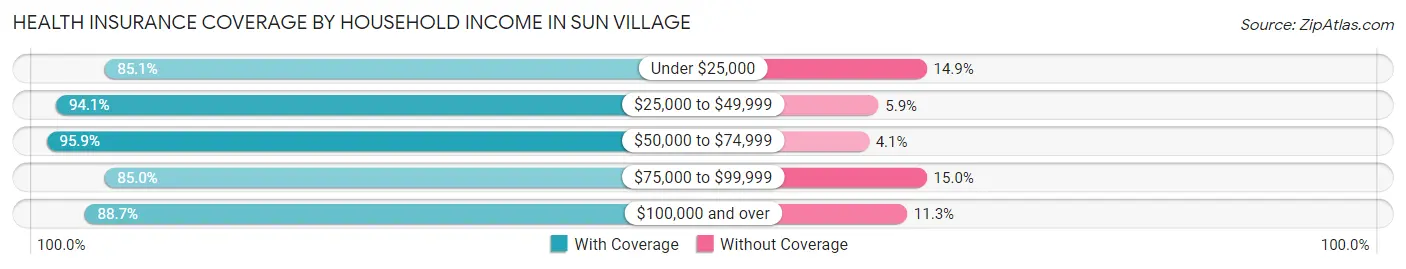
| Household Income | With Coverage | Without Coverage |
| Under $25,000 | 1,418 (85.1%) | 249 (14.9%) |
| $25,000 to $49,999 | 1,912 (94.1%) | 120 (5.9%) |
| $50,000 to $74,999 | 2,731 (95.9%) | 117 (4.1%) |
| $75,000 to $99,999 | 1,296 (85.0%) | 228 (15.0%) |
| $100,000 and over | 3,018 (88.7%) | 383 (11.3%) |
Public vs Private Health Insurance Coverage by Age in Sun Village
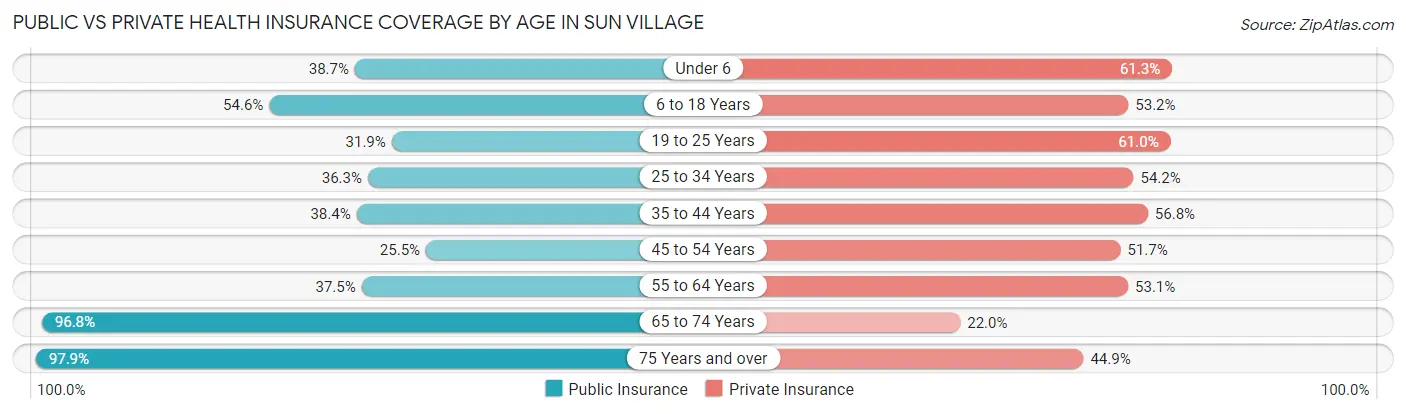
| Age Bracket | Public Insurance | Private Insurance |
| Under 6 | 413 (38.7%) | 654 (61.3%) |
| 6 to 18 Years | 1,233 (54.6%) | 1,201 (53.2%) |
| 19 to 25 Years | 300 (31.9%) | 574 (61.0%) |
| 25 to 34 Years | 372 (36.3%) | 555 (54.1%) |
| 35 to 44 Years | 490 (38.4%) | 725 (56.8%) |
| 45 to 54 Years | 498 (25.5%) | 1,010 (51.7%) |
| 55 to 64 Years | 549 (37.4%) | 779 (53.1%) |
| 65 to 74 Years | 1,025 (96.8%) | 233 (22.0%) |
| 75 Years and over | 419 (97.9%) | 192 (44.9%) |
| Total | 5,299 (46.2%) | 5,923 (51.6%) |
Disability Status by Sex by Age in Sun Village
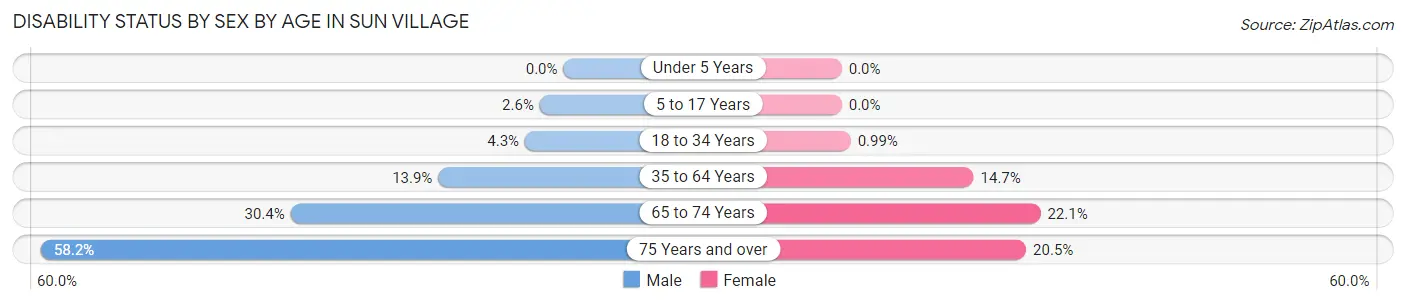
| Age Bracket | Male | Female |
| Under 5 Years | 0 (0.0%) | 0 (0.0%) |
| 5 to 17 Years | 30 (2.6%) | 0 (0.0%) |
| 18 to 34 Years | 47 (4.3%) | 10 (1.0%) |
| 35 to 64 Years | 338 (13.9%) | 333 (14.7%) |
| 65 to 74 Years | 168 (30.4%) | 112 (22.1%) |
| 75 Years and over | 96 (58.2%) | 54 (20.5%) |
Disability Class by Sex by Age in Sun Village
Disability Class: Hearing Difficulty
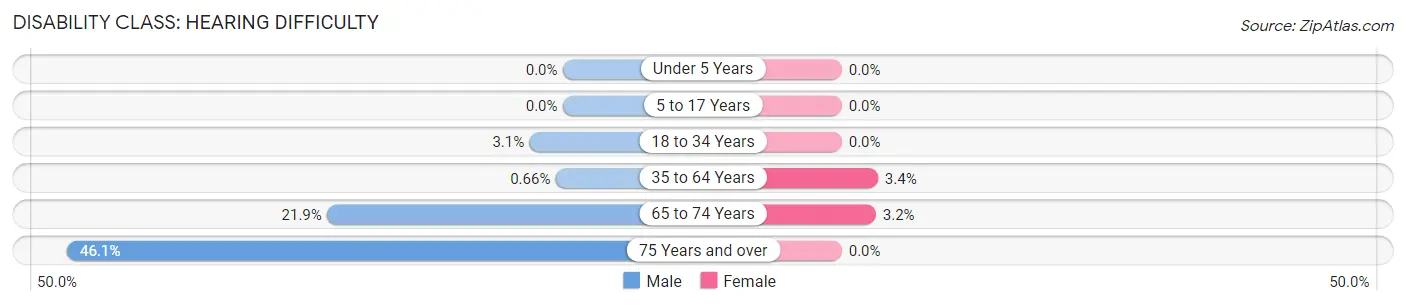
| Age Bracket | Male | Female |
| Under 5 Years | 0 (0.0%) | 0 (0.0%) |
| 5 to 17 Years | 0 (0.0%) | 0 (0.0%) |
| 18 to 34 Years | 34 (3.1%) | 0 (0.0%) |
| 35 to 64 Years | 16 (0.7%) | 76 (3.4%) |
| 65 to 74 Years | 121 (21.9%) | 16 (3.2%) |
| 75 Years and over | 76 (46.1%) | 0 (0.0%) |
Disability Class: Vision Difficulty
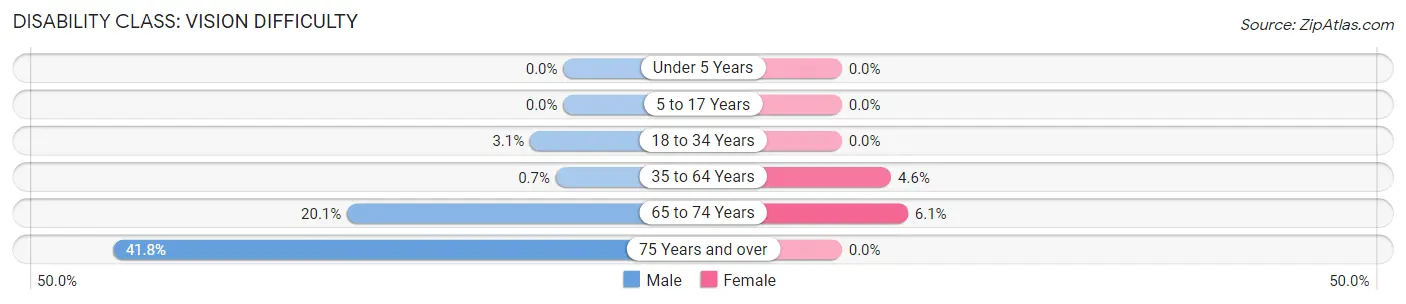
| Age Bracket | Male | Female |
| Under 5 Years | 0 (0.0%) | 0 (0.0%) |
| 5 to 17 Years | 0 (0.0%) | 0 (0.0%) |
| 18 to 34 Years | 34 (3.1%) | 0 (0.0%) |
| 35 to 64 Years | 17 (0.7%) | 104 (4.6%) |
| 65 to 74 Years | 111 (20.1%) | 31 (6.1%) |
| 75 Years and over | 69 (41.8%) | 0 (0.0%) |
Disability Class: Cognitive Difficulty
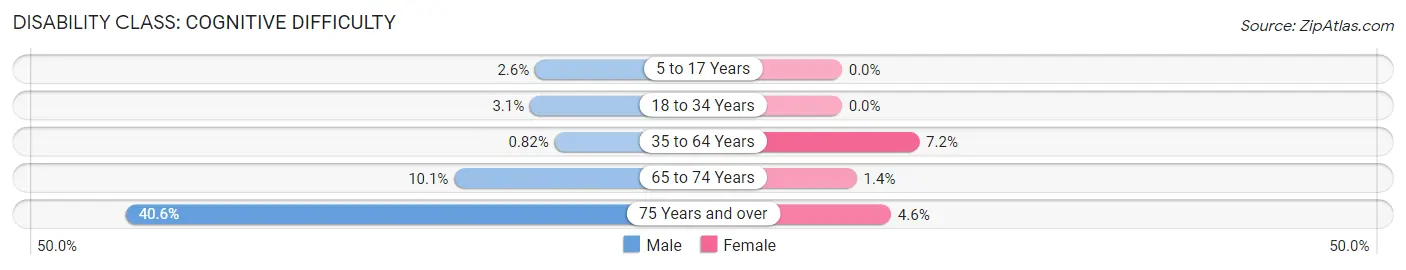
| Age Bracket | Male | Female |
| 5 to 17 Years | 30 (2.6%) | 0 (0.0%) |
| 18 to 34 Years | 34 (3.1%) | 0 (0.0%) |
| 35 to 64 Years | 20 (0.8%) | 163 (7.2%) |
| 65 to 74 Years | 56 (10.1%) | 7 (1.4%) |
| 75 Years and over | 67 (40.6%) | 12 (4.6%) |
Disability Class: Ambulatory Difficulty
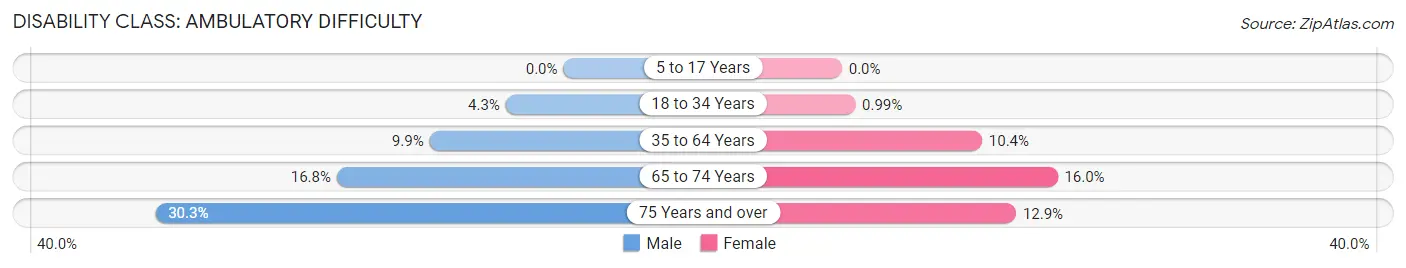
| Age Bracket | Male | Female |
| 5 to 17 Years | 0 (0.0%) | 0 (0.0%) |
| 18 to 34 Years | 47 (4.3%) | 10 (1.0%) |
| 35 to 64 Years | 241 (9.9%) | 236 (10.4%) |
| 65 to 74 Years | 93 (16.8%) | 81 (16.0%) |
| 75 Years and over | 50 (30.3%) | 34 (12.9%) |
Disability Class: Self-Care Difficulty
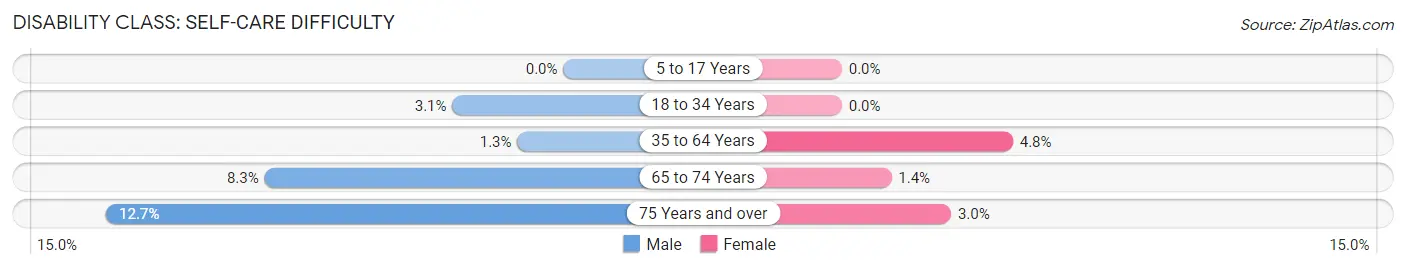
| Age Bracket | Male | Female |
| 5 to 17 Years | 0 (0.0%) | 0 (0.0%) |
| 18 to 34 Years | 34 (3.1%) | 0 (0.0%) |
| 35 to 64 Years | 31 (1.3%) | 108 (4.8%) |
| 65 to 74 Years | 46 (8.3%) | 7 (1.4%) |
| 75 Years and over | 21 (12.7%) | 8 (3.0%) |
Technology Access in Sun Village
Computing Device Access in Sun Village
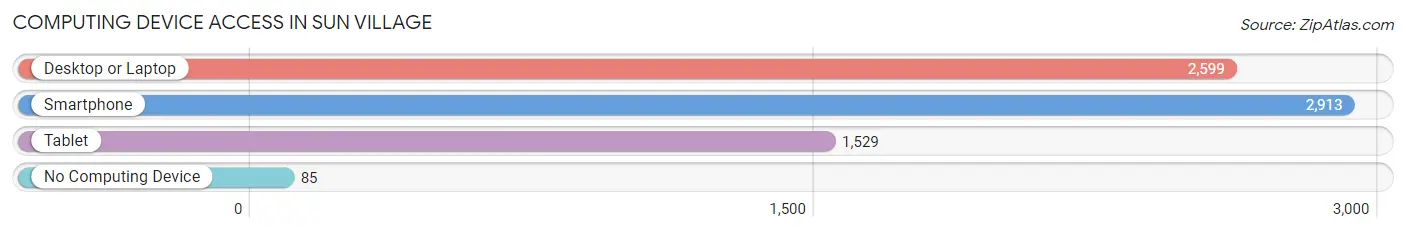
| Device Type | # Households | % Households |
| Desktop or Laptop | 2,599 | 82.3% |
| Smartphone | 2,913 | 92.2% |
| Tablet | 1,529 | 48.4% |
| No Computing Device | 85 | 2.7% |
| Total | 3,158 | 100.0% |
Internet Access in Sun Village
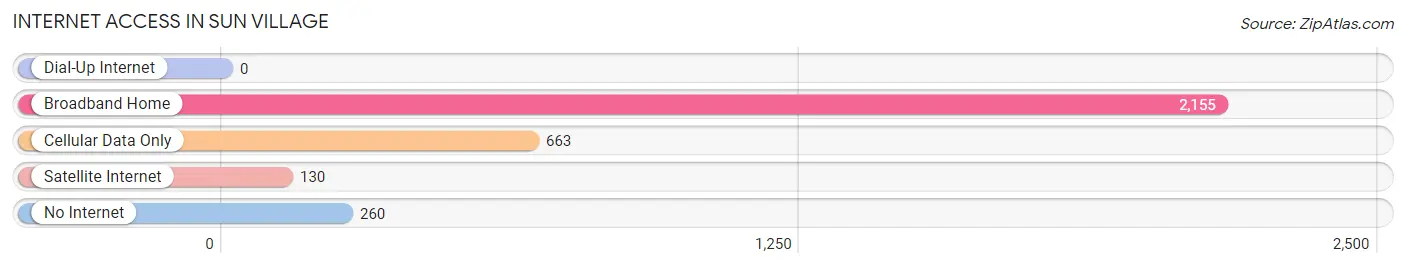
| Internet Type | # Households | % Households |
| Dial-Up Internet | 0 | 0.0% |
| Broadband Home | 2,155 | 68.2% |
| Cellular Data Only | 663 | 21.0% |
| Satellite Internet | 130 | 4.1% |
| No Internet | 260 | 8.2% |
| Total | 3,158 | 100.0% |
Sun Village Summary
Village History
Sun Village is a small unincorporated community located in the San Gabriel Valley of Los Angeles County, California. The area was originally inhabited by the Tongva Native American tribe, who called the area “Ahapchingas”, meaning “place of the sun”. The first European settlers arrived in the area in the late 1800s, and the area was officially established as Sun Village in the early 1900s.
The area was originally a farming community, with many of the original settlers growing citrus fruits and other crops. The area was also home to a number of small businesses, including a general store, a blacksmith, and a post office. In the 1920s, the area began to experience a population boom as more people moved to the area to take advantage of the mild climate and the abundance of jobs in the nearby cities of Los Angeles and Pasadena.
In the 1950s, Sun Village began to experience a period of rapid growth and development. The area was annexed by the City of Los Angeles in 1957, and the population continued to grow as more people moved to the area. The area was also home to a number of new businesses, including a shopping center, a movie theater, and a bowling alley.
Geography
Sun Village is located in the San Gabriel Valley of Los Angeles County, California. The area is bordered by the cities of Los Angeles and Pasadena to the north and east, and the communities of El Monte and South El Monte to the south and west. The area is located at an elevation of approximately 500 feet above sea level, and is characterized by rolling hills and valleys.
The area is home to a number of parks and recreational areas, including the Sun Village Park, which features a playground, picnic areas, and a walking path. The area is also home to a number of schools, including Sun Village Elementary School, Sun Valley Middle School, and Sun Valley High School.
Economy
Sun Village is primarily a residential community, and the majority of the area’s residents are employed in the nearby cities of Los Angeles and Pasadena. The area is also home to a number of small businesses, including restaurants, retail stores, and auto repair shops.
The area is also home to a number of industrial and manufacturing businesses, including a number of aerospace and defense contractors. The area is also home to a number of medical facilities, including a hospital and a number of clinics.
Demographics
As of the 2010 census, the population of Sun Village was 8,945. The population is primarily Hispanic, with approximately 75% of the population identifying as Hispanic or Latino. The median household income in the area is $50,000, and the median home value is $400,000. The area is also home to a number of immigrants, with approximately 25% of the population being foreign-born.
Common Questions
What is Per Capita Income in Sun Village?
Per Capita income in Sun Village is $20,973.
What is the Median Family Income in Sun Village?
Median Family Income in Sun Village is $65,316.
What is the Median Household income in Sun Village?
Median Household Income in Sun Village is $66,158.
What is Income or Wage Gap in Sun Village?
Income or Wage Gap in Sun Village is 10.1%.
Women in Sun Village earn 89.9 cents for every dollar earned by a man.
What is Family Income Deficit in Sun Village?
Family Income Deficit in Sun Village is $16,118.
Families that are below poverty line in Sun Village earn $16,118 less on average than the poverty threshold level.
What is Inequality or Gini Index in Sun Village?
Inequality or Gini Index in Sun Village is 0.39.
What is the Total Population of Sun Village?
Total Population of Sun Village is 11,472.
What is the Total Male Population of Sun Village?
Total Male Population of Sun Village is 5,745.
What is the Total Female Population of Sun Village?
Total Female Population of Sun Village is 5,727.
What is the Ratio of Males per 100 Females in Sun Village?
There are 100.31 Males per 100 Females in Sun Village.
What is the Ratio of Females per 100 Males in Sun Village?
There are 99.69 Females per 100 Males in Sun Village.
What is the Median Population Age in Sun Village?
Median Population Age in Sun Village is 36.9 Years.
What is the Average Family Size in Sun Village
Average Family Size in Sun Village is 4.1 People.
What is the Average Household Size in Sun Village
Average Household Size in Sun Village is 3.6 People.
How Large is the Labor Force in Sun Village?
There are 4,530 People in the Labor Forcein in Sun Village.
What is the Percentage of People in the Labor Force in Sun Village?
52.8% of People are in the Labor Force in Sun Village.
What is the Unemployment Rate in Sun Village?
Unemployment Rate in Sun Village is 7.8%.