Grayson, CA Map & Demographics
Grayson Map
Grayson Overview
$22,729
PER CAPITA INCOME
$69,286
AVG FAMILY INCOME
44.8%
WAGE / INCOME GAP [ % ]
55.2¢/ $1
WAGE / INCOME GAP [ $ ]
0.34
INEQUALITY / GINI INDEX
1,593
TOTAL POPULATION
1,070
MALE POPULATION
523
FEMALE POPULATION
204.59
MALES / 100 FEMALES
48.88
FEMALES / 100 MALES
34.8
MEDIAN AGE
4.0
AVG FAMILY SIZE
3.9
AVG HOUSEHOLD SIZE
881
LABOR FORCE [ PEOPLE ]
66.9%
PERCENT IN LABOR FORCE
2.0%
UNEMPLOYMENT RATE
Income in Grayson
Income Overview in Grayson
| Characteristic | Number | Measure |
| Per Capita Income | 1,593 | $22,729 |
| Median Family Income | 378 | $69,286 |
| Mean Family Income | 378 | $80,129 |
| Median Household Income | 407 | $0 |
| Mean Household Income | 407 | $77,554 |
| Income Deficit | 378 | $0 |
| Wage / Income Gap (%) | 1,593 | 44.78% |
| Wage / Income Gap ($) | 1,593 | 55.22¢ per $1 |
| Gini / Inequality Index | 1,593 | 0.34 |
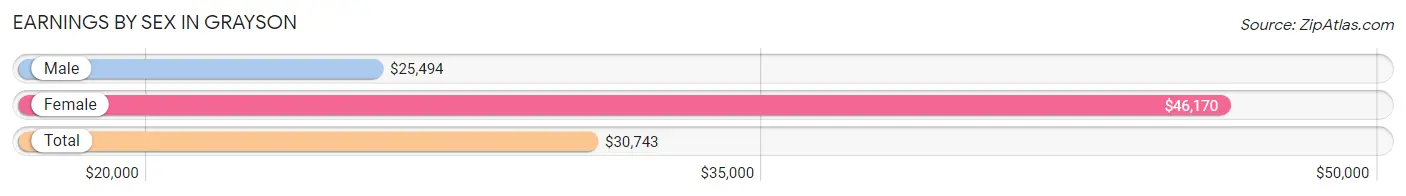
Earnings by Sex in Grayson
Average Earnings in Grayson are $30,743, $25,494 for men and $46,170 for women, a difference of 44.8%.
| Sex | Number | Average Earnings |
| Male | 738 (79.9%) | $25,494 |
| Female | 186 (20.1%) | $46,170 |
| Total | 924 (100.0%) | $30,743 |
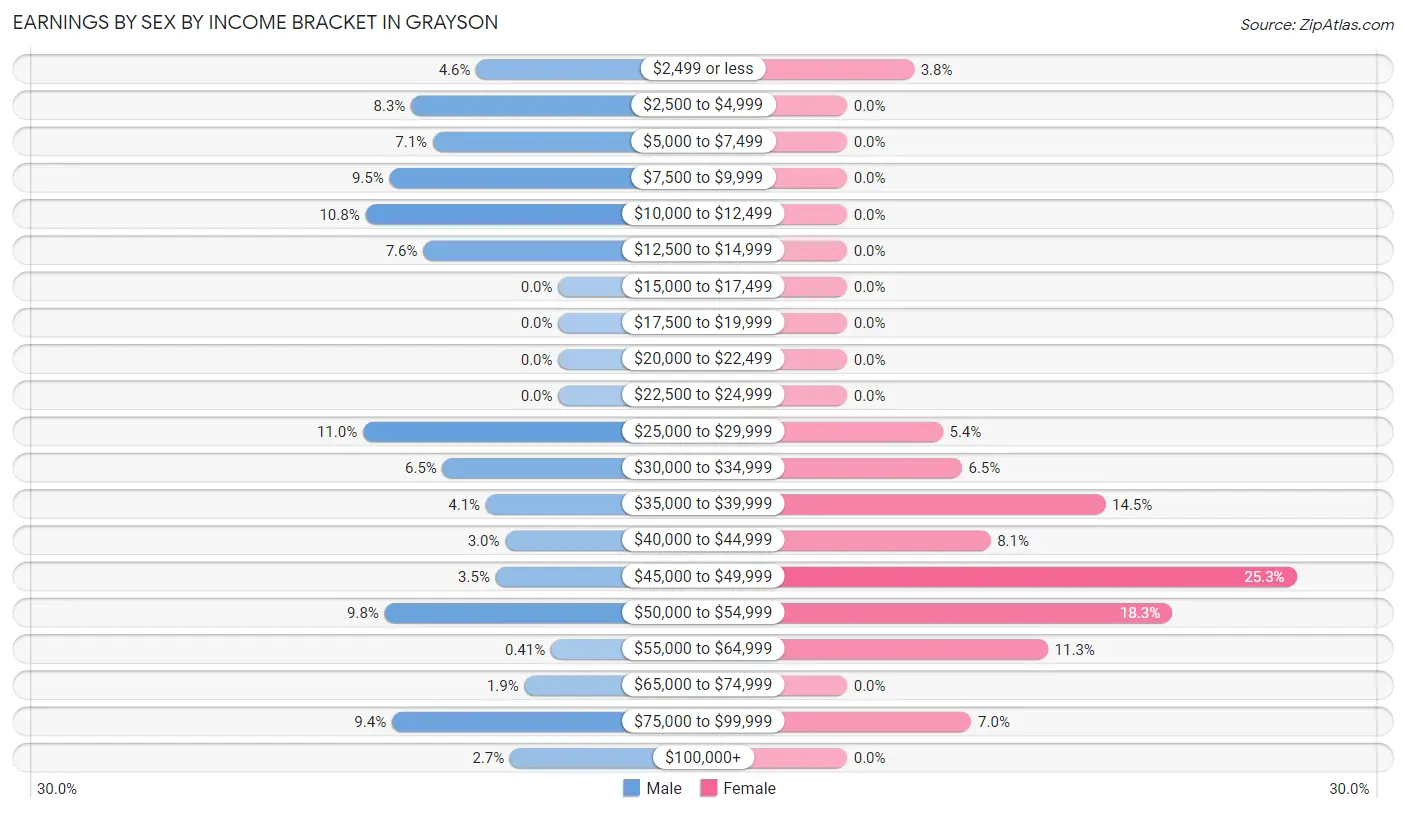
Earnings by Sex by Income Bracket in Grayson
The most common earnings brackets in Grayson are $25,000 to $29,999 for men (81 | 11.0%) and $45,000 to $49,999 for women (47 | 25.3%).
| Income | Male | Female |
| $2,499 or less | 34 (4.6%) | 7 (3.8%) |
| $2,500 to $4,999 | 61 (8.3%) | 0 (0.0%) |
| $5,000 to $7,499 | 52 (7.0%) | 0 (0.0%) |
| $7,500 to $9,999 | 70 (9.5%) | 0 (0.0%) |
| $10,000 to $12,499 | 80 (10.8%) | 0 (0.0%) |
| $12,500 to $14,999 | 56 (7.6%) | 0 (0.0%) |
| $15,000 to $17,499 | 0 (0.0%) | 0 (0.0%) |
| $17,500 to $19,999 | 0 (0.0%) | 0 (0.0%) |
| $20,000 to $22,499 | 0 (0.0%) | 0 (0.0%) |
| $22,500 to $24,999 | 0 (0.0%) | 0 (0.0%) |
| $25,000 to $29,999 | 81 (11.0%) | 10 (5.4%) |
| $30,000 to $34,999 | 48 (6.5%) | 12 (6.5%) |
| $35,000 to $39,999 | 30 (4.1%) | 27 (14.5%) |
| $40,000 to $44,999 | 22 (3.0%) | 15 (8.1%) |
| $45,000 to $49,999 | 26 (3.5%) | 47 (25.3%) |
| $50,000 to $54,999 | 72 (9.8%) | 34 (18.3%) |
| $55,000 to $64,999 | 3 (0.4%) | 21 (11.3%) |
| $65,000 to $74,999 | 14 (1.9%) | 0 (0.0%) |
| $75,000 to $99,999 | 69 (9.3%) | 13 (7.0%) |
| $100,000+ | 20 (2.7%) | 0 (0.0%) |
| Total | 738 (100.0%) | 186 (100.0%) |
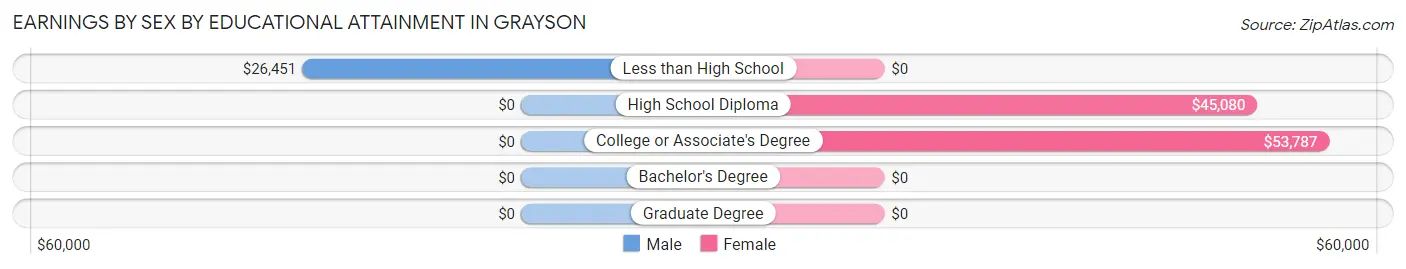
Earnings by Sex by Educational Attainment in Grayson
Average earnings in Grayson are $26,867 for men and $46,170 for women, a difference of 41.8%. Men with an educational attainment of less than high school enjoy the highest average annual earnings of $26,451, while those with less than high school education earn the least with $26,451. Women with an educational attainment of college or associate's degree earn the most with the average annual earnings of $53,787, while those with high school diploma education have the smallest earnings of $45,080.
| Educational Attainment | Male Income | Female Income |
| Less than High School | $26,451 | $0 |
| High School Diploma | - | - |
| College or Associate's Degree | - | - |
| Bachelor's Degree | - | - |
| Graduate Degree | - | - |
| Total | $26,867 | $46,170 |
Family Income in Grayson
Family Income Brackets in Grayson
According to the Grayson family income data, there are 159 families falling into the $35,000 to $49,999 income range, which is the most common income bracket and makes up 42.1% of all families.
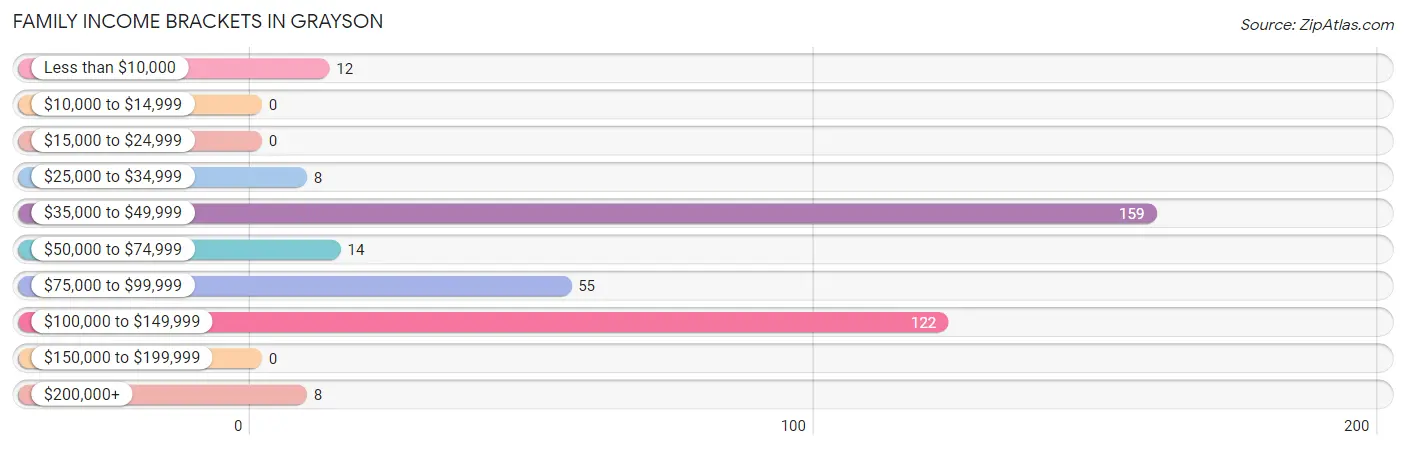
| Income Bracket | # Families | % Families |
| Less than $10,000 | 12 | 3.2% |
| $10,000 to $14,999 | 0 | 0.0% |
| $15,000 to $24,999 | 0 | 0.0% |
| $25,000 to $34,999 | 8 | 2.1% |
| $35,000 to $49,999 | 159 | 42.1% |
| $50,000 to $74,999 | 14 | 3.7% |
| $75,000 to $99,999 | 55 | 14.6% |
| $100,000 to $149,999 | 122 | 32.3% |
| $150,000 to $199,999 | 0 | 0.0% |
| $200,000+ | 8 | 2.1% |
Family Income by Famaliy Size in Grayson
3-person families (130 | 34.4%) account for the highest median family income in Grayson with $84,211 per family, while 2-person families (60 | 15.9%) have the highest median income of $34,286 per family member.
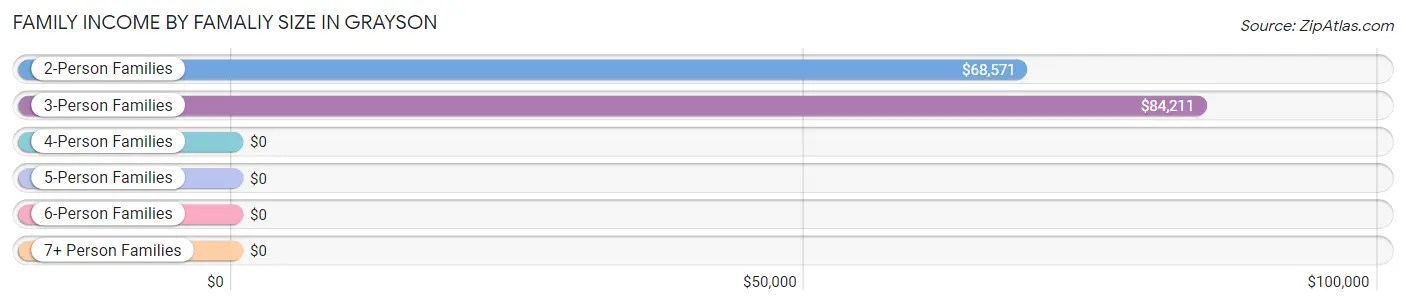
| Income Bracket | # Families | Median Income |
| 2-Person Families | 60 (15.9%) | $68,571 |
| 3-Person Families | 130 (34.4%) | $84,211 |
| 4-Person Families | 42 (11.1%) | $0 |
| 5-Person Families | 119 (31.5%) | $0 |
| 6-Person Families | 27 (7.1%) | $0 |
| 7+ Person Families | 0 (0.0%) | $0 |
| Total | 378 (100.0%) | $69,286 |
Family Income by Number of Earners in Grayson
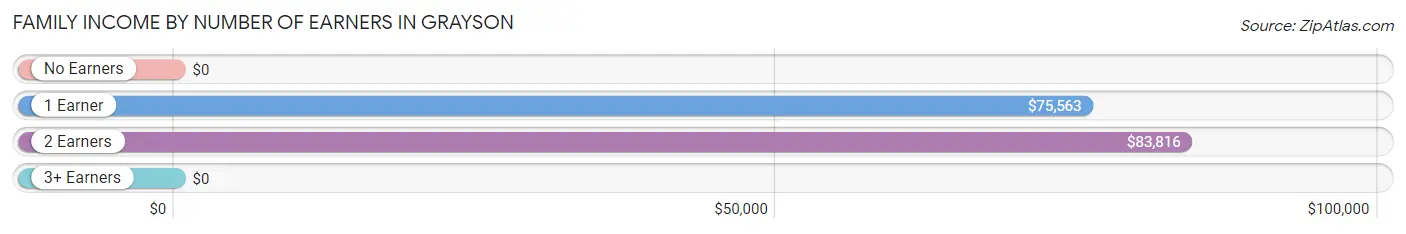
| Number of Earners | # Families | Median Income |
| No Earners | 36 (9.5%) | $0 |
| 1 Earner | 37 (9.8%) | $75,563 |
| 2 Earners | 174 (46.0%) | $83,816 |
| 3+ Earners | 131 (34.7%) | $0 |
| Total | 378 (100.0%) | $69,286 |
Household Income in Grayson
Household Income Brackets in Grayson
With 159 households falling in the category, the $35,000 to $49,999 income range is the most frequent in Grayson, accounting for 39.1% of all households.
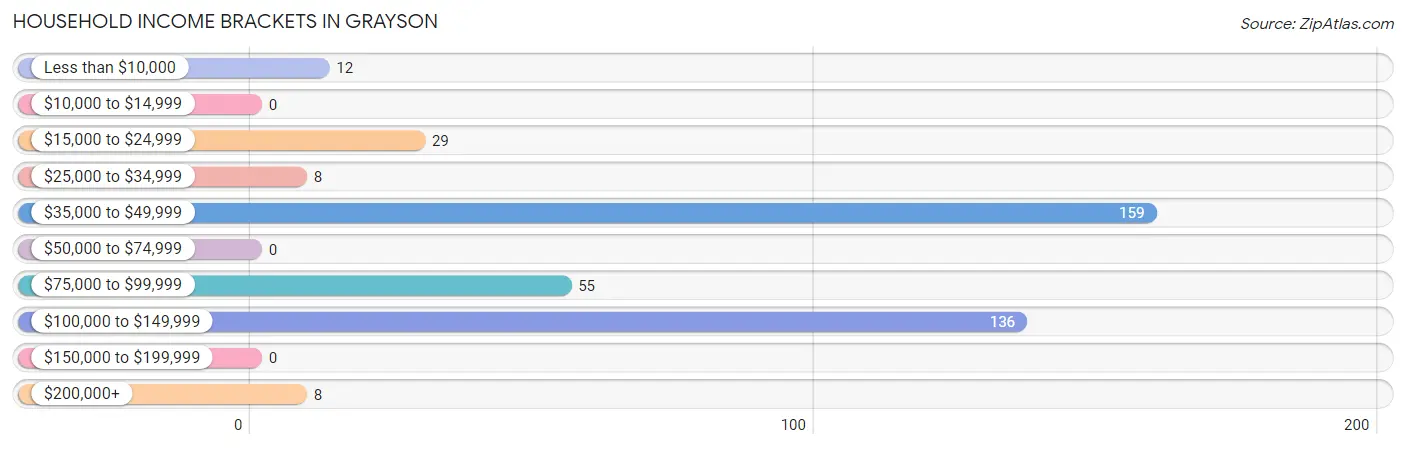
| Income Bracket | # Households | % Households |
| Less than $10,000 | 12 | 2.9% |
| $10,000 to $14,999 | 0 | 0.0% |
| $15,000 to $24,999 | 29 | 7.1% |
| $25,000 to $34,999 | 8 | 2.0% |
| $35,000 to $49,999 | 159 | 39.1% |
| $50,000 to $74,999 | 0 | 0.0% |
| $75,000 to $99,999 | 55 | 13.5% |
| $100,000 to $149,999 | 136 | 33.4% |
| $150,000 to $199,999 | 0 | 0.0% |
| $200,000+ | 8 | 2.0% |
Household Income by Householder Age in Grayson
The median household income in Grayson is $0, with the highest median household income of $83,816 found in the 45 to 64 years age bracket for the primary householder. A total of 236 households (58.0%) fall into this category.
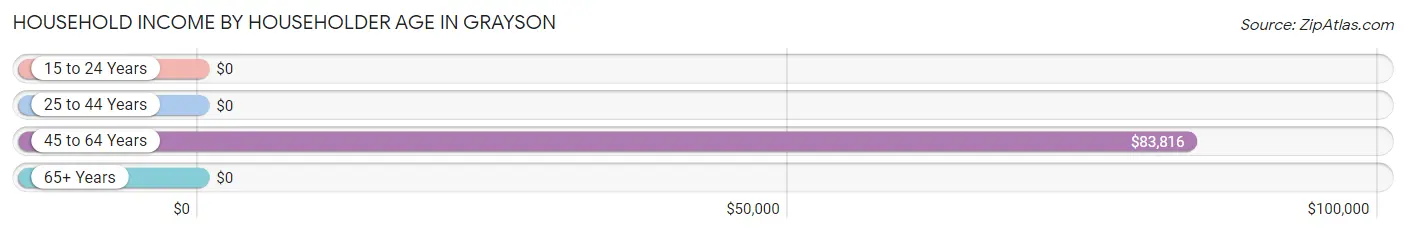
| Income Bracket | # Households | Median Income |
| 15 to 24 Years | 0 (0.0%) | $0 |
| 25 to 44 Years | 115 (28.3%) | $0 |
| 45 to 64 Years | 236 (58.0%) | $83,816 |
| 65+ Years | 56 (13.8%) | $0 |
| Total | 407 (100.0%) | $0 |
Poverty in Grayson
Income Below Poverty by Sex and Age in Grayson
With 7.4% poverty level for males and 2.3% for females among the residents of Grayson, 65 to 74 year old males and 55 to 64 year old females are the most vulnerable to poverty, with 52 males (76.5%) and 12 females (27.3%) in their respective age groups living below the poverty level.
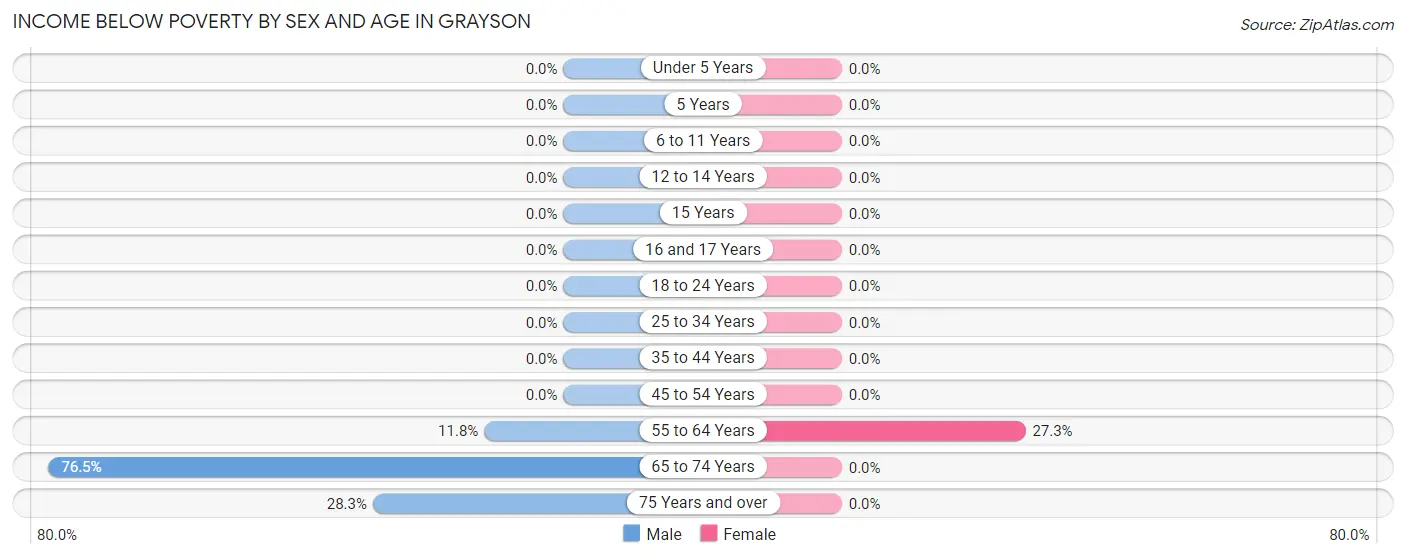
| Age Bracket | Male | Female |
| Under 5 Years | 0 (0.0%) | 0 (0.0%) |
| 5 Years | 0 (0.0%) | 0 (0.0%) |
| 6 to 11 Years | 0 (0.0%) | 0 (0.0%) |
| 12 to 14 Years | 0 (0.0%) | 0 (0.0%) |
| 15 Years | 0 (0.0%) | 0 (0.0%) |
| 16 and 17 Years | 0 (0.0%) | 0 (0.0%) |
| 18 to 24 Years | 0 (0.0%) | 0 (0.0%) |
| 25 to 34 Years | 0 (0.0%) | 0 (0.0%) |
| 35 to 44 Years | 0 (0.0%) | 0 (0.0%) |
| 45 to 54 Years | 0 (0.0%) | 0 (0.0%) |
| 55 to 64 Years | 12 (11.8%) | 12 (27.3%) |
| 65 to 74 Years | 52 (76.5%) | 0 (0.0%) |
| 75 Years and over | 15 (28.3%) | 0 (0.0%) |
| Total | 79 (7.4%) | 12 (2.3%) |
Income Above Poverty by Sex and Age in Grayson
According to the poverty statistics in Grayson, males aged under 5 years and females aged under 5 years are the age groups that are most secure financially, with 100.0% of males and 100.0% of females in these age groups living above the poverty line.
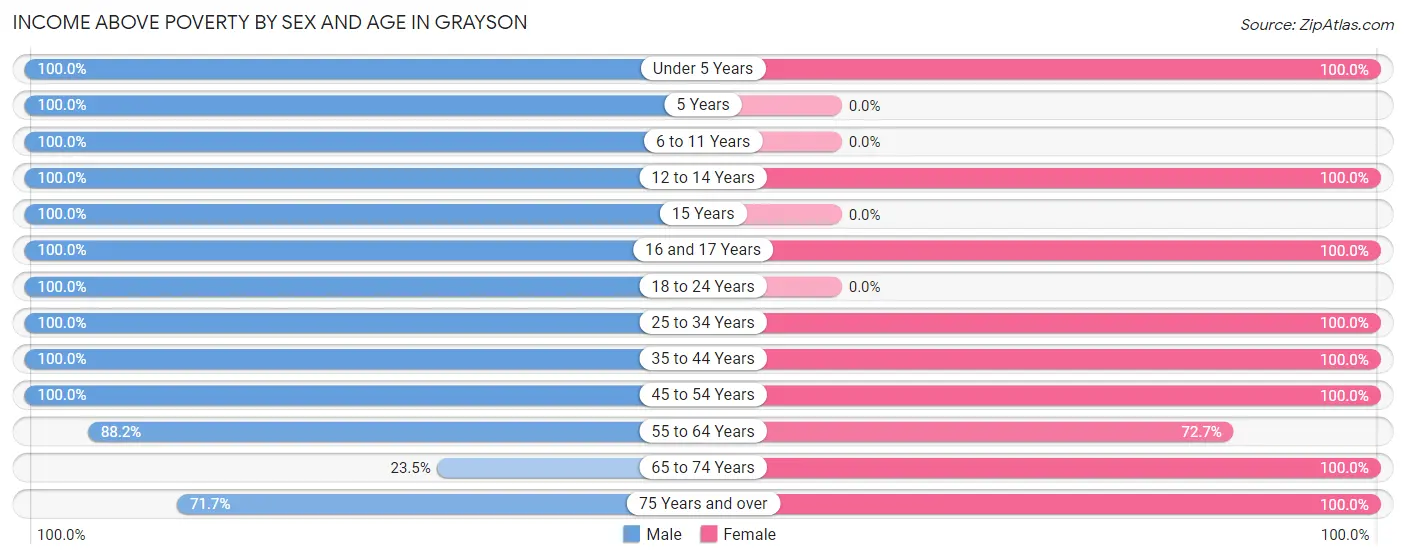
| Age Bracket | Male | Female |
| Under 5 Years | 42 (100.0%) | 8 (100.0%) |
| 5 Years | 8 (100.0%) | 0 (0.0%) |
| 6 to 11 Years | 20 (100.0%) | 0 (0.0%) |
| 12 to 14 Years | 64 (100.0%) | 121 (100.0%) |
| 15 Years | 13 (100.0%) | 0 (0.0%) |
| 16 and 17 Years | 93 (100.0%) | 27 (100.0%) |
| 18 to 24 Years | 205 (100.0%) | 0 (0.0%) |
| 25 to 34 Years | 180 (100.0%) | 22 (100.0%) |
| 35 to 44 Years | 85 (100.0%) | 77 (100.0%) |
| 45 to 54 Years | 137 (100.0%) | 188 (100.0%) |
| 55 to 64 Years | 90 (88.2%) | 32 (72.7%) |
| 65 to 74 Years | 16 (23.5%) | 19 (100.0%) |
| 75 Years and over | 38 (71.7%) | 17 (100.0%) |
| Total | 991 (92.6%) | 511 (97.7%) |
Income Below Poverty Among Married-Couple Families in Grayson
The poverty statistics for married-couple families in Grayson show that 4.4% or 12 of the total 275 families live below the poverty line. Families with no children have the highest poverty rate of 27.9%, comprising of 12 families. On the other hand, families with 1 or 2 children have the lowest poverty rate of 0.0%, which includes 0 families.
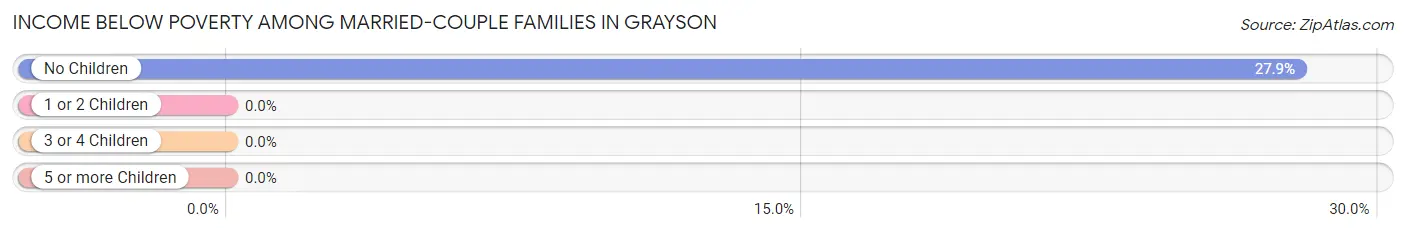
| Children | Above Poverty | Below Poverty |
| No Children | 31 (72.1%) | 12 (27.9%) |
| 1 or 2 Children | 205 (100.0%) | 0 (0.0%) |
| 3 or 4 Children | 27 (100.0%) | 0 (0.0%) |
| 5 or more Children | 0 (0.0%) | 0 (0.0%) |
| Total | 263 (95.6%) | 12 (4.4%) |
Income Below Poverty Among Single-Parent Households in Grayson
| Children | Single Father | Single Mother |
| No Children | 0 (0.0%) | 0 (0.0%) |
| 1 or 2 Children | 0 (0.0%) | 0 (0.0%) |
| 3 or 4 Children | 0 (0.0%) | 0 (0.0%) |
| 5 or more Children | 0 (0.0%) | 0 (0.0%) |
| Total | 0 (0.0%) | 0 (0.0%) |
Income Below Poverty Among Married-Couple vs Single-Parent Households in Grayson
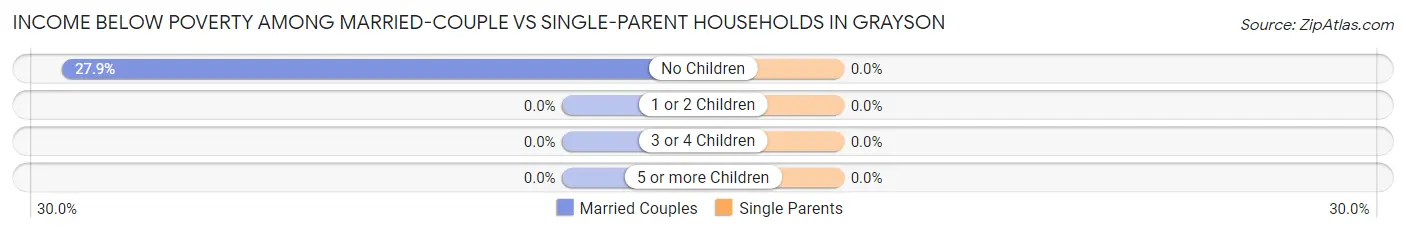
| Children | Married-Couple Families | Single-Parent Households |
| No Children | 12 (27.9%) | 0 (0.0%) |
| 1 or 2 Children | 0 (0.0%) | 0 (0.0%) |
| 3 or 4 Children | 0 (0.0%) | 0 (0.0%) |
| 5 or more Children | 0 (0.0%) | 0 (0.0%) |
| Total | 12 (4.4%) | 0 (0.0%) |
Race in Grayson
The most populous races in Grayson are Hispanic or Latino (1,553 | 97.5%), Two or more Races (760 | 47.7%), and White / Caucasian (488 | 30.6%).
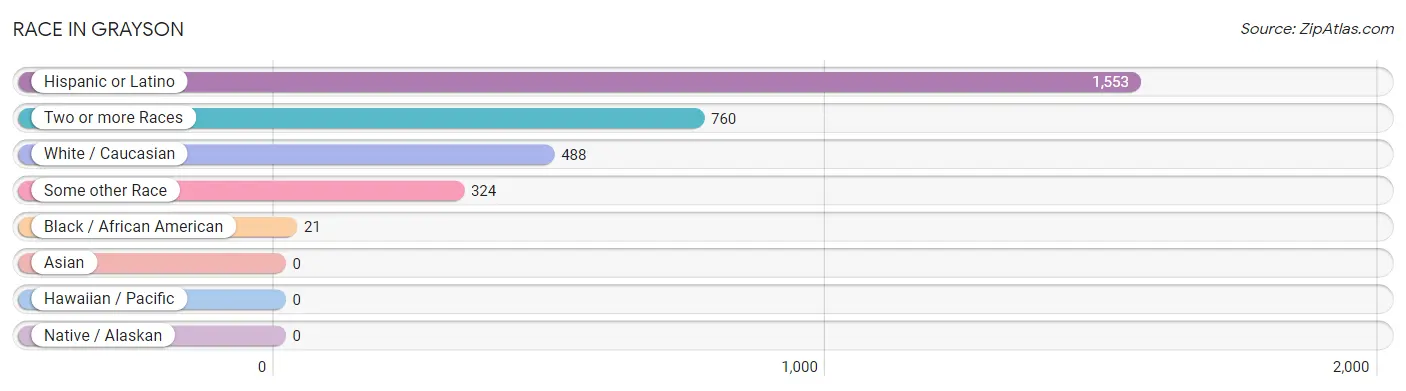
| Race | # Population | % Population |
| Asian | 0 | 0.0% |
| Black / African American | 21 | 1.3% |
| Hawaiian / Pacific | 0 | 0.0% |
| Hispanic or Latino | 1,553 | 97.5% |
| Native / Alaskan | 0 | 0.0% |
| White / Caucasian | 488 | 30.6% |
| Two or more Races | 760 | 47.7% |
| Some other Race | 324 | 20.3% |
| Total | 1,593 | 100.0% |
Ancestry in Grayson
The most populous ancestries reported in Grayson are Mexican (1,454 | 91.3%), Puerto Rican (48 | 3.0%), Central American (36 | 2.3%), Salvadoran (36 | 2.3%), and Portuguese (19 | 1.2%), together accounting for 100.0% of all Grayson residents.
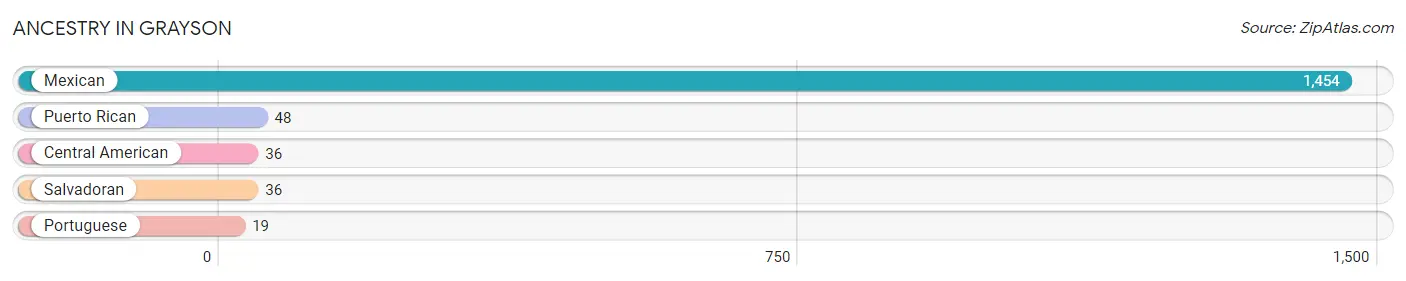
| Ancestry | # Population | % Population |
| Central American | 36 | 2.3% |
| Mexican | 1,454 | 91.3% |
| Portuguese | 19 | 1.2% |
| Puerto Rican | 48 | 3.0% |
| Salvadoran | 36 | 2.3% | View All 5 Rows |
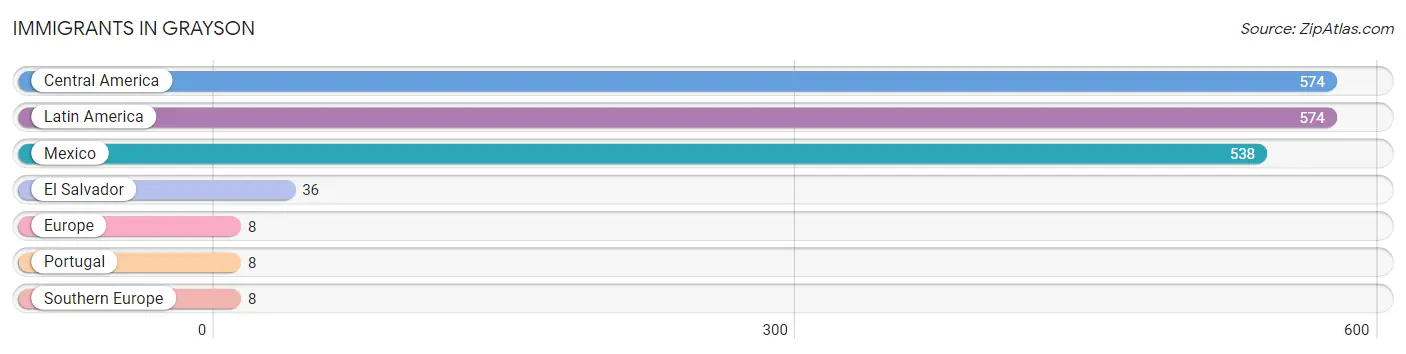
Immigrants in Grayson
The most numerous immigrant groups reported in Grayson came from Central America (574 | 36.0%), Latin America (574 | 36.0%), Mexico (538 | 33.8%), El Salvador (36 | 2.3%), and Europe (8 | 0.5%), together accounting for 108.6% of all Grayson residents.
| Immigration Origin | # Population | % Population |
| Central America | 574 | 36.0% |
| El Salvador | 36 | 2.3% |
| Europe | 8 | 0.5% |
| Latin America | 574 | 36.0% |
| Mexico | 538 | 33.8% |
| Portugal | 8 | 0.5% |
| Southern Europe | 8 | 0.5% | View All 7 Rows |
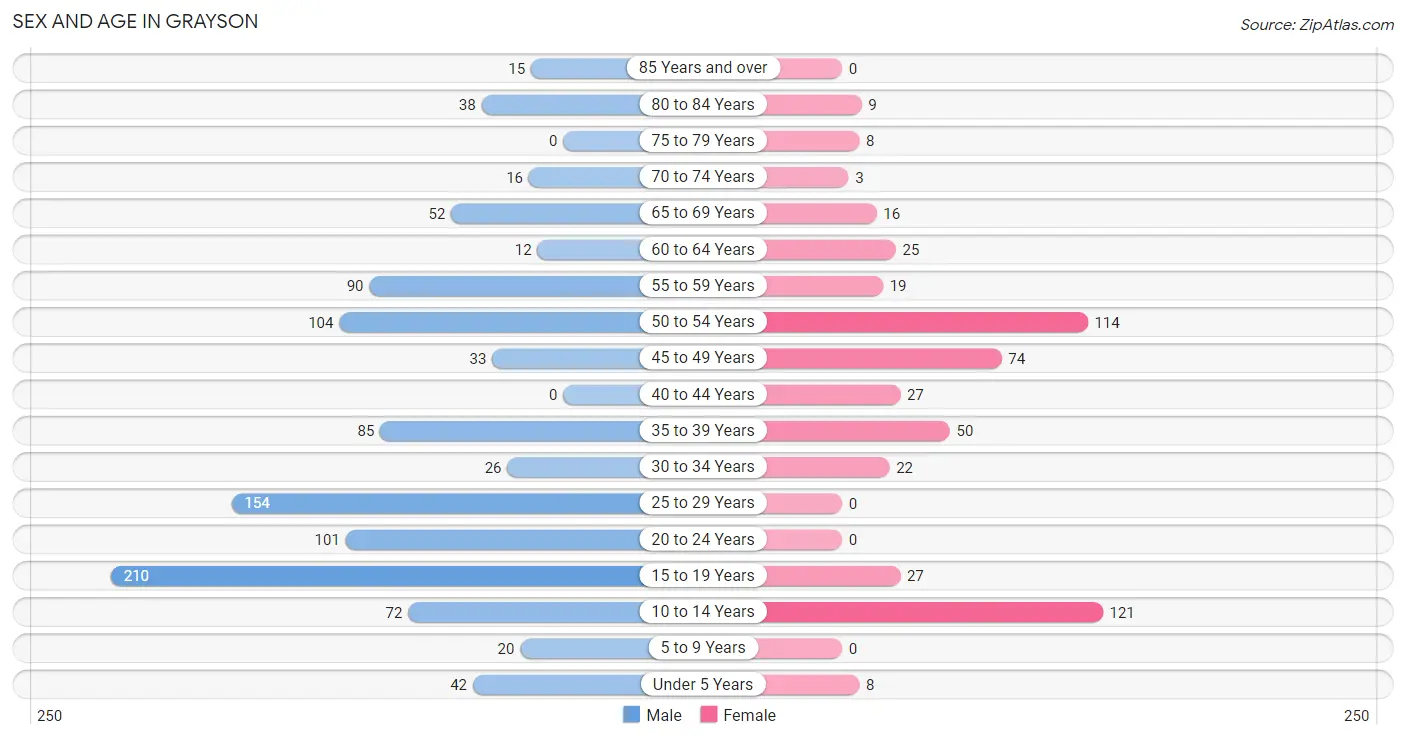
Sex and Age in Grayson
Sex and Age in Grayson
The most populous age groups in Grayson are 15 to 19 Years (210 | 19.6%) for men and 10 to 14 Years (121 | 23.1%) for women.
| Age Bracket | Male | Female |
| Under 5 Years | 42 (3.9%) | 8 (1.5%) |
| 5 to 9 Years | 20 (1.9%) | 0 (0.0%) |
| 10 to 14 Years | 72 (6.7%) | 121 (23.1%) |
| 15 to 19 Years | 210 (19.6%) | 27 (5.2%) |
| 20 to 24 Years | 101 (9.4%) | 0 (0.0%) |
| 25 to 29 Years | 154 (14.4%) | 0 (0.0%) |
| 30 to 34 Years | 26 (2.4%) | 22 (4.2%) |
| 35 to 39 Years | 85 (7.9%) | 50 (9.6%) |
| 40 to 44 Years | 0 (0.0%) | 27 (5.2%) |
| 45 to 49 Years | 33 (3.1%) | 74 (14.1%) |
| 50 to 54 Years | 104 (9.7%) | 114 (21.8%) |
| 55 to 59 Years | 90 (8.4%) | 19 (3.6%) |
| 60 to 64 Years | 12 (1.1%) | 25 (4.8%) |
| 65 to 69 Years | 52 (4.9%) | 16 (3.1%) |
| 70 to 74 Years | 16 (1.5%) | 3 (0.6%) |
| 75 to 79 Years | 0 (0.0%) | 8 (1.5%) |
| 80 to 84 Years | 38 (3.5%) | 9 (1.7%) |
| 85 Years and over | 15 (1.4%) | 0 (0.0%) |
| Total | 1,070 (100.0%) | 523 (100.0%) |
Families and Households in Grayson
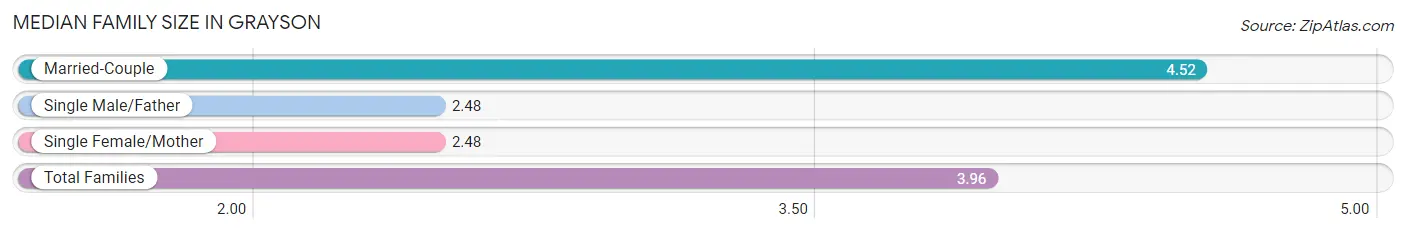
Median Family Size in Grayson
The median family size in Grayson is 3.96 persons per family, with married-couple families (275 | 72.8%) accounting for the largest median family size of 4.52 persons per family. On the other hand, single male/father families (63 | 16.7%) represent the smallest median family size with 2.48 persons per family.
| Family Type | # Families | Family Size |
| Married-Couple | 275 (72.8%) | 4.52 |
| Single Male/Father | 63 (16.7%) | 2.48 |
| Single Female/Mother | 40 (10.6%) | 2.48 |
| Total Families | 378 (100.0%) | 3.96 |
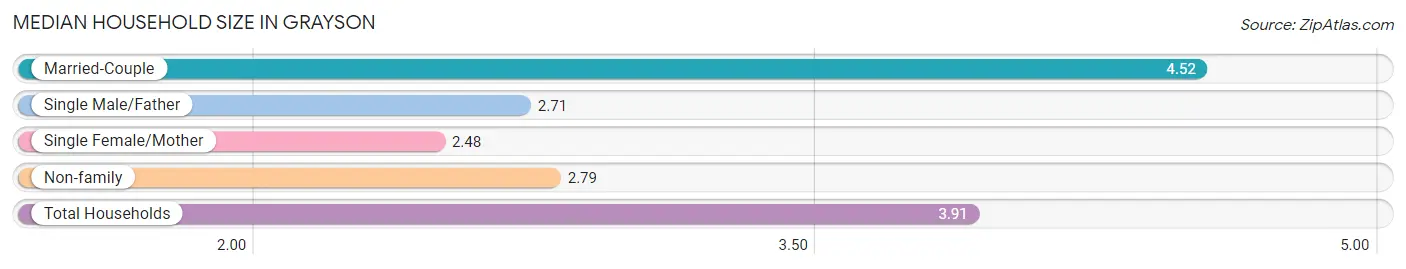
Median Household Size in Grayson
The median household size in Grayson is 3.91 persons per household, with married-couple households (275 | 67.6%) accounting for the largest median household size of 4.52 persons per household. single female/mother households (40 | 9.8%) represent the smallest median household size with 2.48 persons per household.
| Household Type | # Households | Household Size |
| Married-Couple | 275 (67.6%) | 4.52 |
| Single Male/Father | 63 (15.5%) | 2.71 |
| Single Female/Mother | 40 (9.8%) | 2.48 |
| Non-family | 29 (7.1%) | 2.79 |
| Total Households | 407 (100.0%) | 3.91 |
Household Size by Marriage Status in Grayson
Out of a total of 407 households in Grayson, 378 (92.9%) are family households, while 29 (7.1%) are nonfamily households. The most numerous type of family households are 3-person households, comprising 144, and the most common type of nonfamily households are 2-person households, comprising 29.
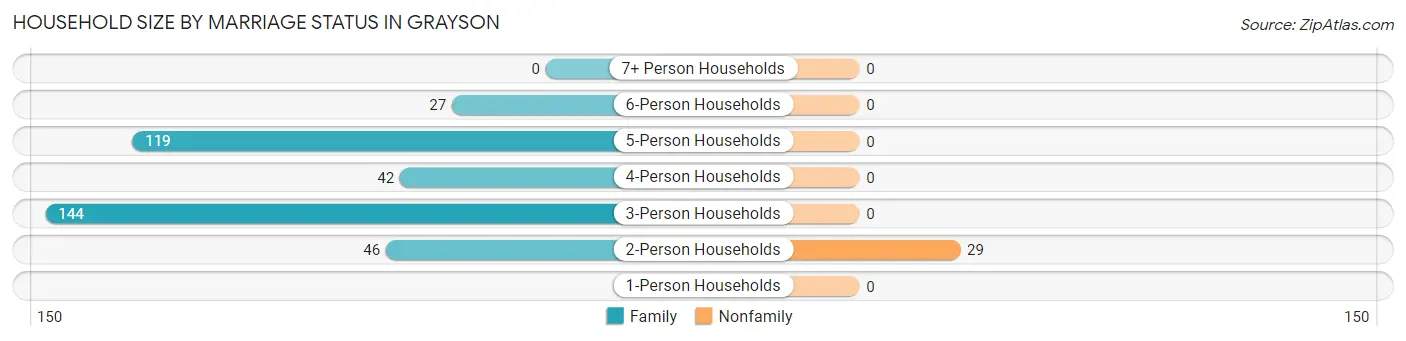
| Household Size | Family Households | Nonfamily Households |
| 1-Person Households | - | 0 (0.0%) |
| 2-Person Households | 46 (11.3%) | 29 (7.1%) |
| 3-Person Households | 144 (35.4%) | 0 (0.0%) |
| 4-Person Households | 42 (10.3%) | 0 (0.0%) |
| 5-Person Households | 119 (29.2%) | 0 (0.0%) |
| 6-Person Households | 27 (6.6%) | 0 (0.0%) |
| 7+ Person Households | 0 (0.0%) | 0 (0.0%) |
| Total | 378 (92.9%) | 29 (7.1%) |
Female Fertility in Grayson
Fertility by Age in Grayson
| Age Bracket | Women with Births | Births / 1,000 Women |
| 15 to 19 years | 0 (0.0%) | 0.0 |
| 20 to 34 years | 0 (0.0%) | 0.0 |
| 35 to 50 years | 0 (0.0%) | 0.0 |
| Total | 0 (0.0%) | 0.0 |
Fertility by Age by Marriage Status in Grayson
| Age Bracket | Married | Unmarried |
| 15 to 19 years | 0 (0.0%) | 0 (0.0%) |
| 20 to 34 years | 0 (0.0%) | 0 (0.0%) |
| 35 to 50 years | 0 (0.0%) | 0 (0.0%) |
| Total | 0 (0.0%) | 0 (0.0%) |
Fertility by Education in Grayson
| Educational Attainment | Women with Births | Births / 1,000 Women |
| Less than High School | 0 (0.0%) | 0.0 |
| High School Diploma | 0 (0.0%) | 0.0 |
| College or Associate's Degree | 0 (0.0%) | 0.0 |
| Bachelor's Degree | 0 (0.0%) | 0.0 |
| Graduate Degree | 0 (0.0%) | 0.0 |
| Total | 0 (0.0%) | 0.0 |
Fertility by Education by Marriage Status in Grayson
| Educational Attainment | Married | Unmarried |
| Less than High School | 0 (0.0%) | 0 (0.0%) |
| High School Diploma | 0 (0.0%) | 0 (0.0%) |
| College or Associate's Degree | 0 (0.0%) | 0 (0.0%) |
| Bachelor's Degree | 0 (0.0%) | 0 (0.0%) |
| Graduate Degree | 0 (0.0%) | 0 (0.0%) |
| Total | 0 (0.0%) | 0 (0.0%) |
Employment Characteristics in Grayson
Employment by Class of Employer in Grayson
Among the 847 employed individuals in Grayson, private company employees (586 | 69.2%), not-for-profit organizations (116 | 13.7%), and state government employees (53 | 6.3%) make up the most common classes of employment.
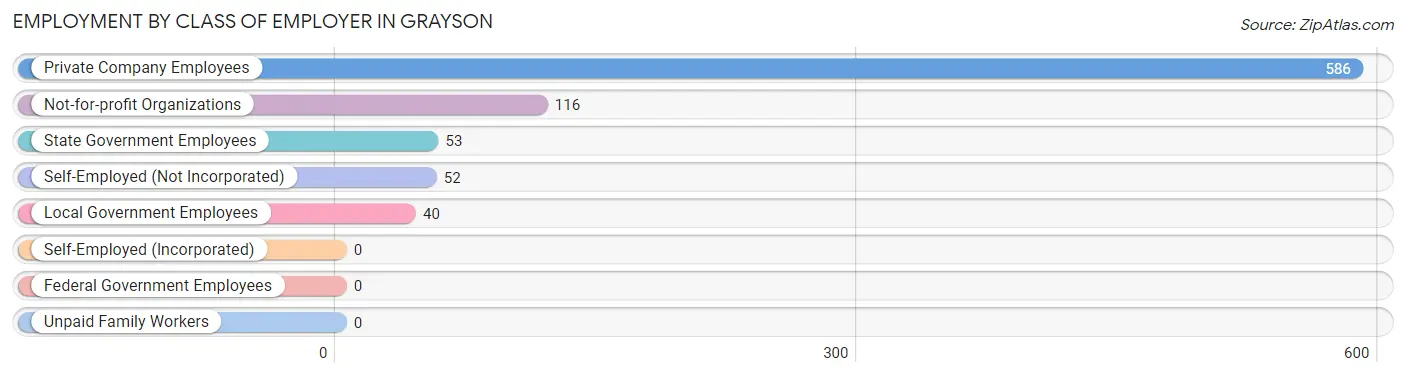
| Employer Class | # Employees | % Employees |
| Private Company Employees | 586 | 69.2% |
| Self-Employed (Incorporated) | 0 | 0.0% |
| Self-Employed (Not Incorporated) | 52 | 6.1% |
| Not-for-profit Organizations | 116 | 13.7% |
| Local Government Employees | 40 | 4.7% |
| State Government Employees | 53 | 6.3% |
| Federal Government Employees | 0 | 0.0% |
| Unpaid Family Workers | 0 | 0.0% |
| Total | 847 | 100.0% |
Employment Status by Age in Grayson
According to the labor force statistics for Grayson, out of the total population over 16 years of age (1,317), 66.9% or 881 individuals are in the labor force, with 2.0% or 18 of them unemployed. The age group with the highest labor force participation rate is 25 to 29 years, with 100.0% or 154 individuals in the labor force. Within the labor force, the 25 to 29 years age range has the highest percentage of unemployed individuals, with 11.7% or 18 of them being unemployed.
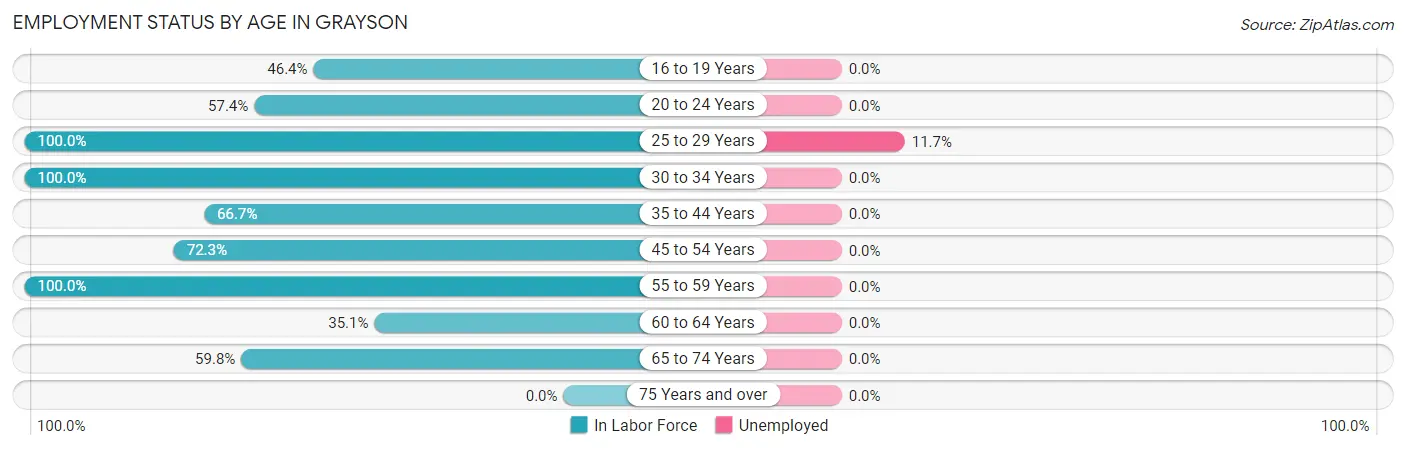
| Age Bracket | In Labor Force | Unemployed |
| 16 to 19 Years | 104 (46.4%) | 0 (0.0%) |
| 20 to 24 Years | 58 (57.4%) | 0 (0.0%) |
| 25 to 29 Years | 154 (100.0%) | 18 (11.7%) |
| 30 to 34 Years | 48 (100.0%) | 0 (0.0%) |
| 35 to 44 Years | 108 (66.7%) | 0 (0.0%) |
| 45 to 54 Years | 235 (72.3%) | 0 (0.0%) |
| 55 to 59 Years | 109 (100.0%) | 0 (0.0%) |
| 60 to 64 Years | 13 (35.1%) | 0 (0.0%) |
| 65 to 74 Years | 52 (59.8%) | 0 (0.0%) |
| 75 Years and over | 0 (0.0%) | 0 (0.0%) |
| Total | 881 (66.9%) | 18 (2.0%) |
Employment Status by Educational Attainment in Grayson
According to labor force statistics for Grayson, 79.9% of individuals (667) out of the total population between 25 and 64 years of age (835) are in the labor force, with 2.7% or 18 of them being unemployed. The group with the highest labor force participation rate are those with the educational attainment of bachelor's degree or higher, with 100.0% or 36 individuals in the labor force. Within the labor force, individuals with high school diploma education have the highest percentage of unemployment, with 5.5% or 18 of them being unemployed.
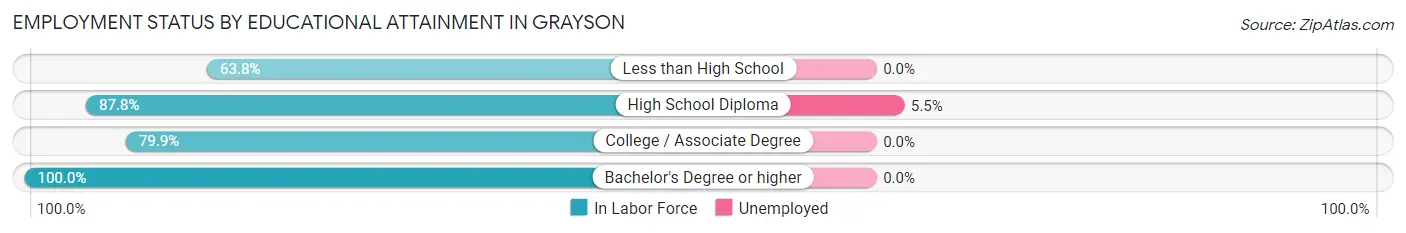
| Educational Attainment | In Labor Force | Unemployed |
| Less than High School | 146 (63.8%) | 0 (0.0%) |
| High School Diploma | 330 (87.8%) | 21 (5.5%) |
| College / Associate Degree | 155 (79.9%) | 0 (0.0%) |
| Bachelor's Degree or higher | 36 (100.0%) | 0 (0.0%) |
| Total | 667 (79.9%) | 23 (2.7%) |
Employment Occupations by Sex in Grayson
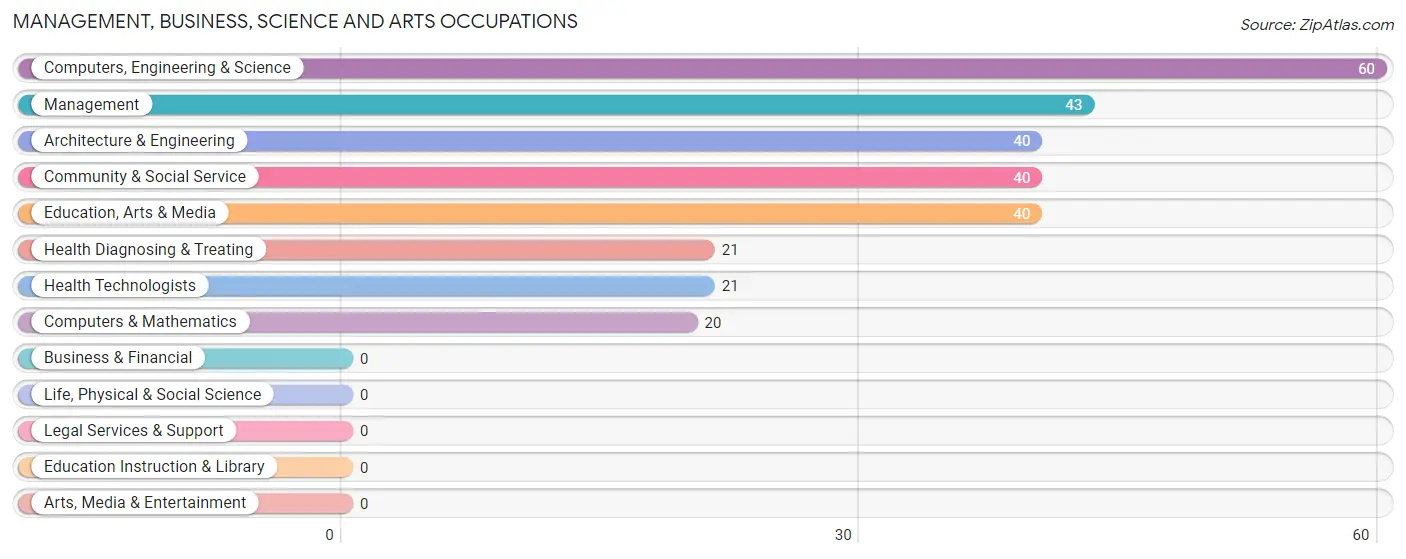
Management, Business, Science and Arts Occupations
The most common Management, Business, Science and Arts occupations in Grayson are Computers, Engineering & Science (60 | 7.0%), Management (43 | 5.0%), Architecture & Engineering (40 | 4.6%), Community & Social Service (40 | 4.6%), and Education, Arts & Media (40 | 4.6%).
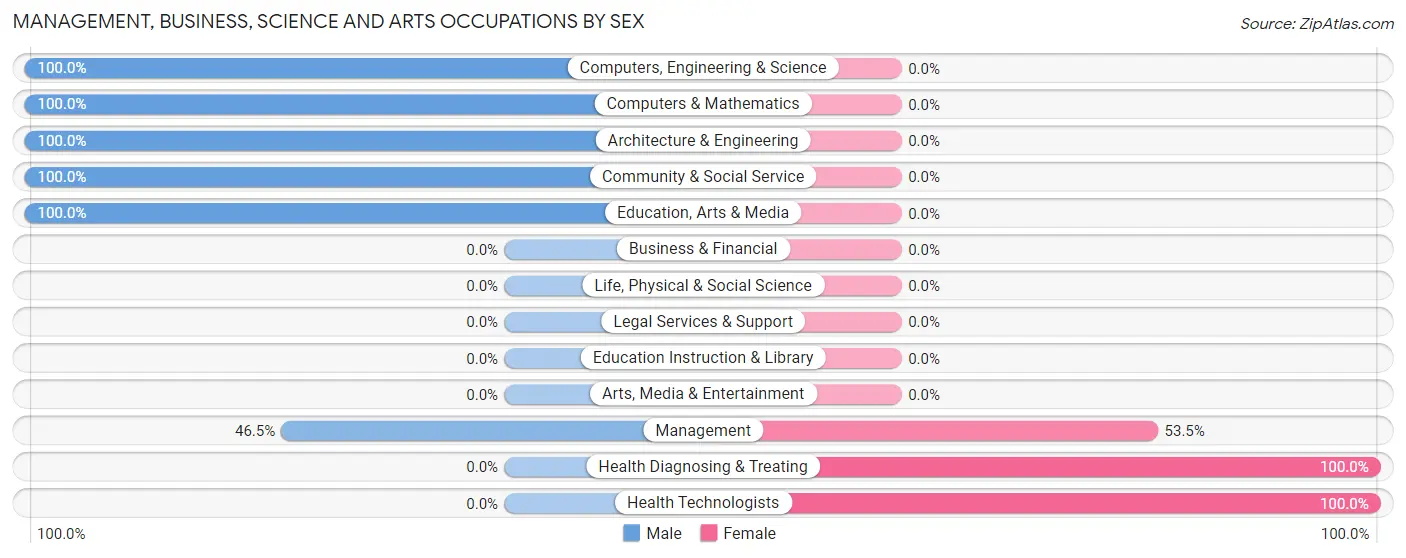
Management, Business, Science and Arts Occupations by Sex
Within the Management, Business, Science and Arts occupations in Grayson, the most male-oriented occupations are Computers, Engineering & Science (100.0%), Computers & Mathematics (100.0%), and Architecture & Engineering (100.0%), while the most female-oriented occupations are Health Diagnosing & Treating (100.0%), Health Technologists (100.0%), and Management (53.5%).
| Occupation | Male | Female |
| Management | 20 (46.5%) | 23 (53.5%) |
| Business & Financial | 0 (0.0%) | 0 (0.0%) |
| Computers, Engineering & Science | 60 (100.0%) | 0 (0.0%) |
| Computers & Mathematics | 20 (100.0%) | 0 (0.0%) |
| Architecture & Engineering | 40 (100.0%) | 0 (0.0%) |
| Life, Physical & Social Science | 0 (0.0%) | 0 (0.0%) |
| Community & Social Service | 40 (100.0%) | 0 (0.0%) |
| Education, Arts & Media | 40 (100.0%) | 0 (0.0%) |
| Legal Services & Support | 0 (0.0%) | 0 (0.0%) |
| Education Instruction & Library | 0 (0.0%) | 0 (0.0%) |
| Arts, Media & Entertainment | 0 (0.0%) | 0 (0.0%) |
| Health Diagnosing & Treating | 0 (0.0%) | 21 (100.0%) |
| Health Technologists | 0 (0.0%) | 21 (100.0%) |
| Total (Category) | 120 (73.2%) | 44 (26.8%) |
| Total (Overall) | 677 (78.4%) | 186 (21.5%) |
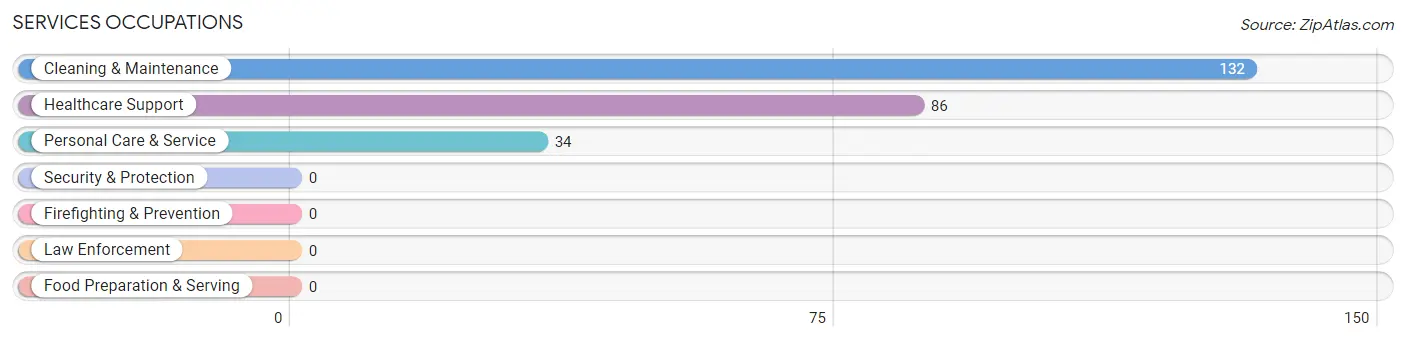
Services Occupations
The most common Services occupations in Grayson are Cleaning & Maintenance (132 | 15.3%), Healthcare Support (86 | 10.0%), and Personal Care & Service (34 | 3.9%).
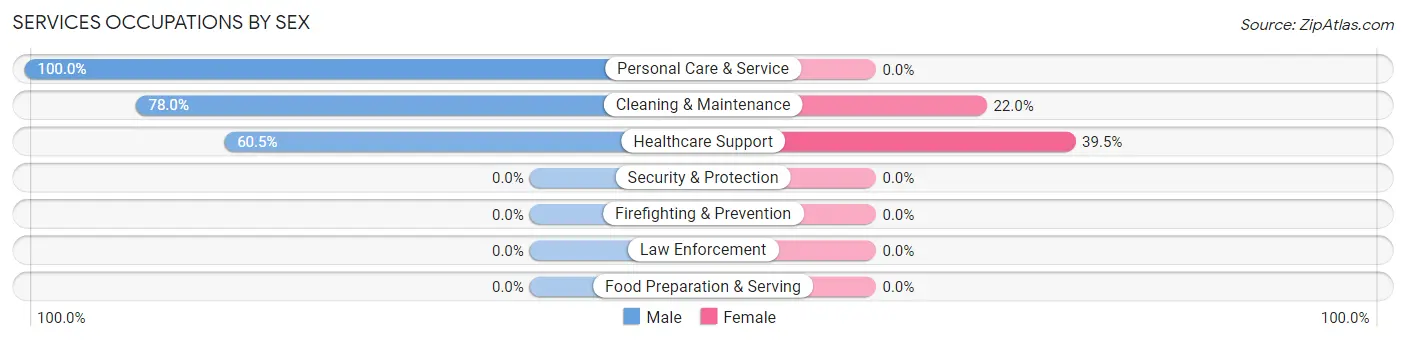
Services Occupations by Sex
Within the Services occupations in Grayson, the most male-oriented occupations are Personal Care & Service (100.0%), Cleaning & Maintenance (78.0%), and Healthcare Support (60.5%), while the most female-oriented occupations are Healthcare Support (39.5%), and Cleaning & Maintenance (22.0%).
| Occupation | Male | Female |
| Healthcare Support | 52 (60.5%) | 34 (39.5%) |
| Security & Protection | 0 (0.0%) | 0 (0.0%) |
| Firefighting & Prevention | 0 (0.0%) | 0 (0.0%) |
| Law Enforcement | 0 (0.0%) | 0 (0.0%) |
| Food Preparation & Serving | 0 (0.0%) | 0 (0.0%) |
| Cleaning & Maintenance | 103 (78.0%) | 29 (22.0%) |
| Personal Care & Service | 34 (100.0%) | 0 (0.0%) |
| Total (Category) | 189 (75.0%) | 63 (25.0%) |
| Total (Overall) | 677 (78.4%) | 186 (21.5%) |
Sales and Office Occupations
The most common Sales and Office occupations in Grayson are Sales & Related (31 | 3.6%), and Office & Administration (19 | 2.2%).
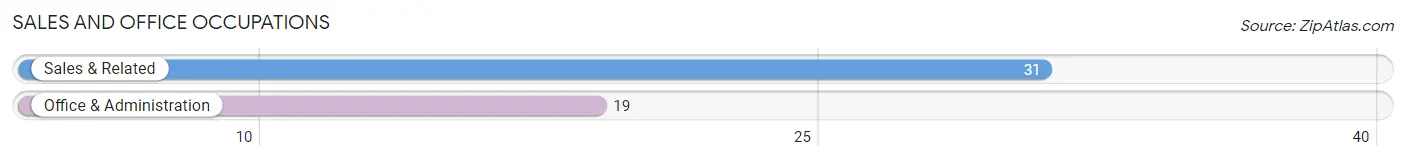
Sales and Office Occupations by Sex
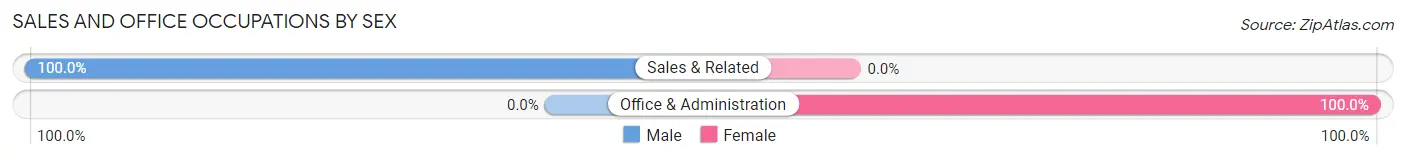
| Occupation | Male | Female |
| Sales & Related | 31 (100.0%) | 0 (0.0%) |
| Office & Administration | 0 (0.0%) | 19 (100.0%) |
| Total (Category) | 31 (62.0%) | 19 (38.0%) |
| Total (Overall) | 677 (78.4%) | 186 (21.5%) |
Natural Resources, Construction and Maintenance Occupations
The most common Natural Resources, Construction and Maintenance occupations in Grayson are Construction & Extraction (93 | 10.8%), Installation, Maintenance & Repair (56 | 6.5%), and Farming, Fishing & Forestry (9 | 1.0%).
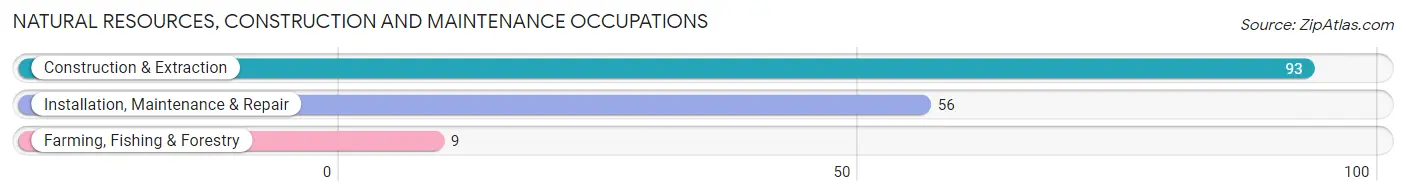
Natural Resources, Construction and Maintenance Occupations by Sex
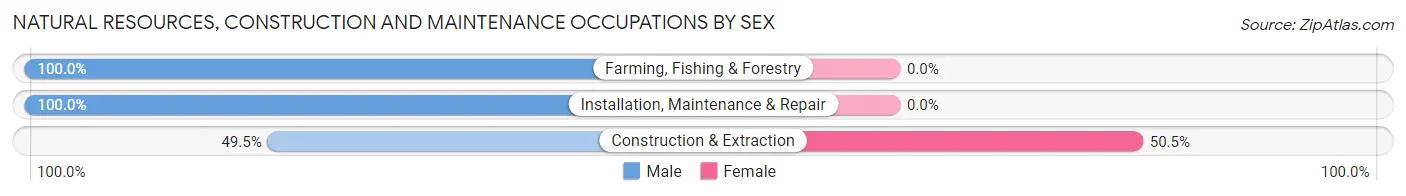
| Occupation | Male | Female |
| Farming, Fishing & Forestry | 9 (100.0%) | 0 (0.0%) |
| Construction & Extraction | 46 (49.5%) | 47 (50.5%) |
| Installation, Maintenance & Repair | 56 (100.0%) | 0 (0.0%) |
| Total (Category) | 111 (70.3%) | 47 (29.7%) |
| Total (Overall) | 677 (78.4%) | 186 (21.5%) |
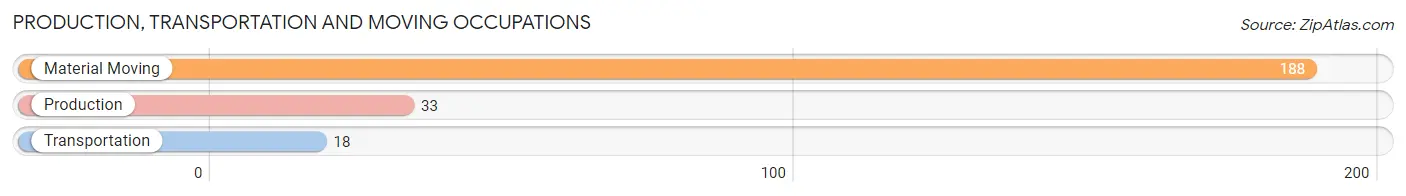
Production, Transportation and Moving Occupations
The most common Production, Transportation and Moving occupations in Grayson are Material Moving (188 | 21.8%), Production (33 | 3.8%), and Transportation (18 | 2.1%).
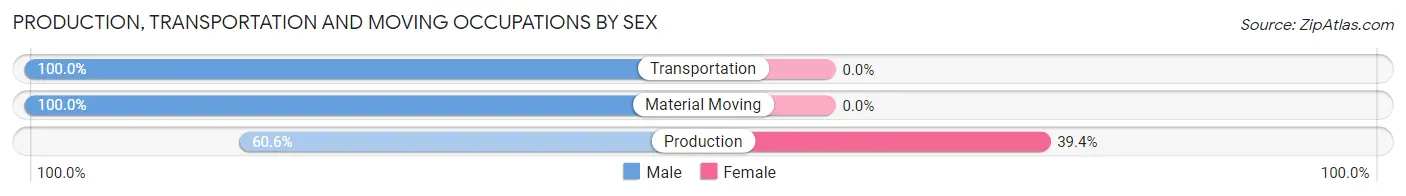
Production, Transportation and Moving Occupations by Sex
| Occupation | Male | Female |
| Production | 20 (60.6%) | 13 (39.4%) |
| Transportation | 18 (100.0%) | 0 (0.0%) |
| Material Moving | 188 (100.0%) | 0 (0.0%) |
| Total (Category) | 226 (94.6%) | 13 (5.4%) |
| Total (Overall) | 677 (78.4%) | 186 (21.5%) |
Employment Industries by Sex in Grayson
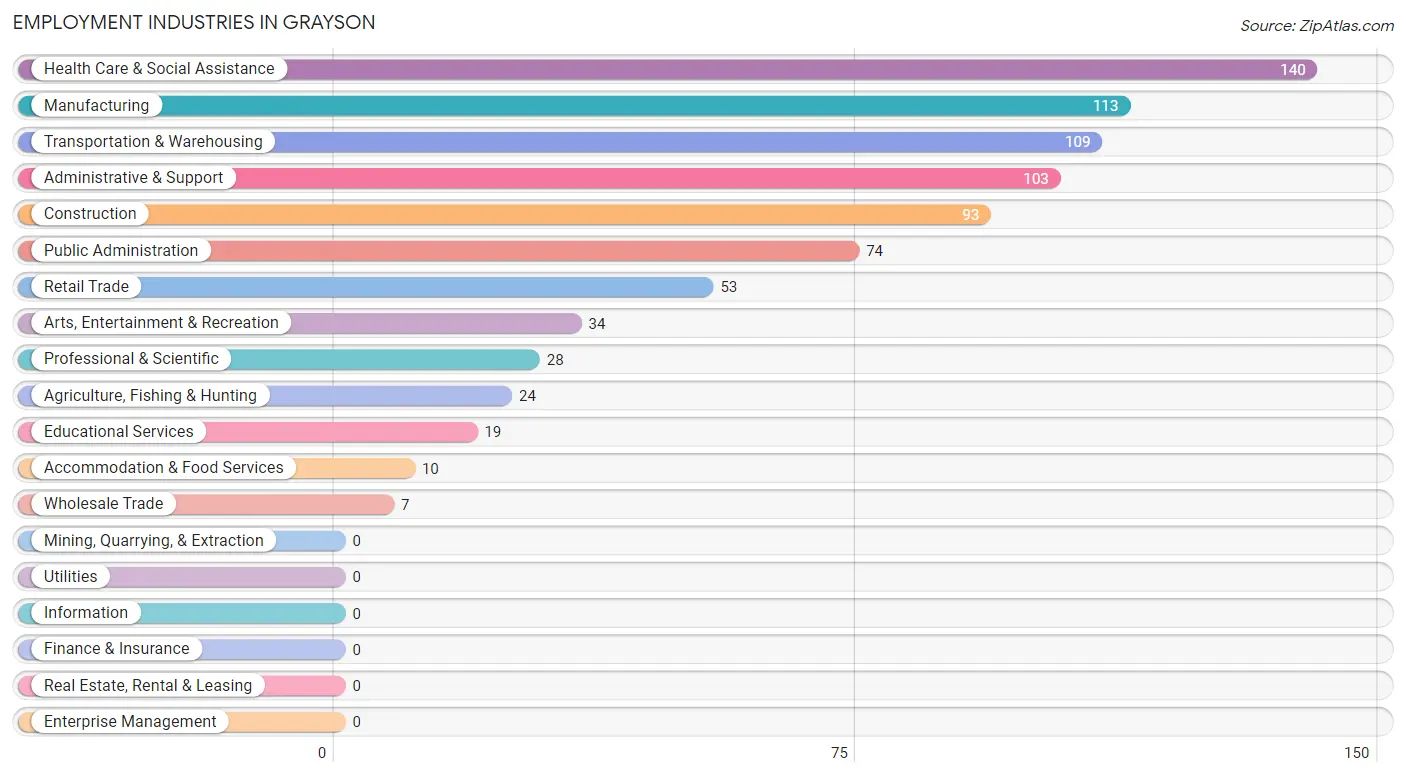
Employment Industries in Grayson
The major employment industries in Grayson include Health Care & Social Assistance (140 | 16.2%), Manufacturing (113 | 13.1%), Transportation & Warehousing (109 | 12.6%), Administrative & Support (103 | 11.9%), and Construction (93 | 10.8%).
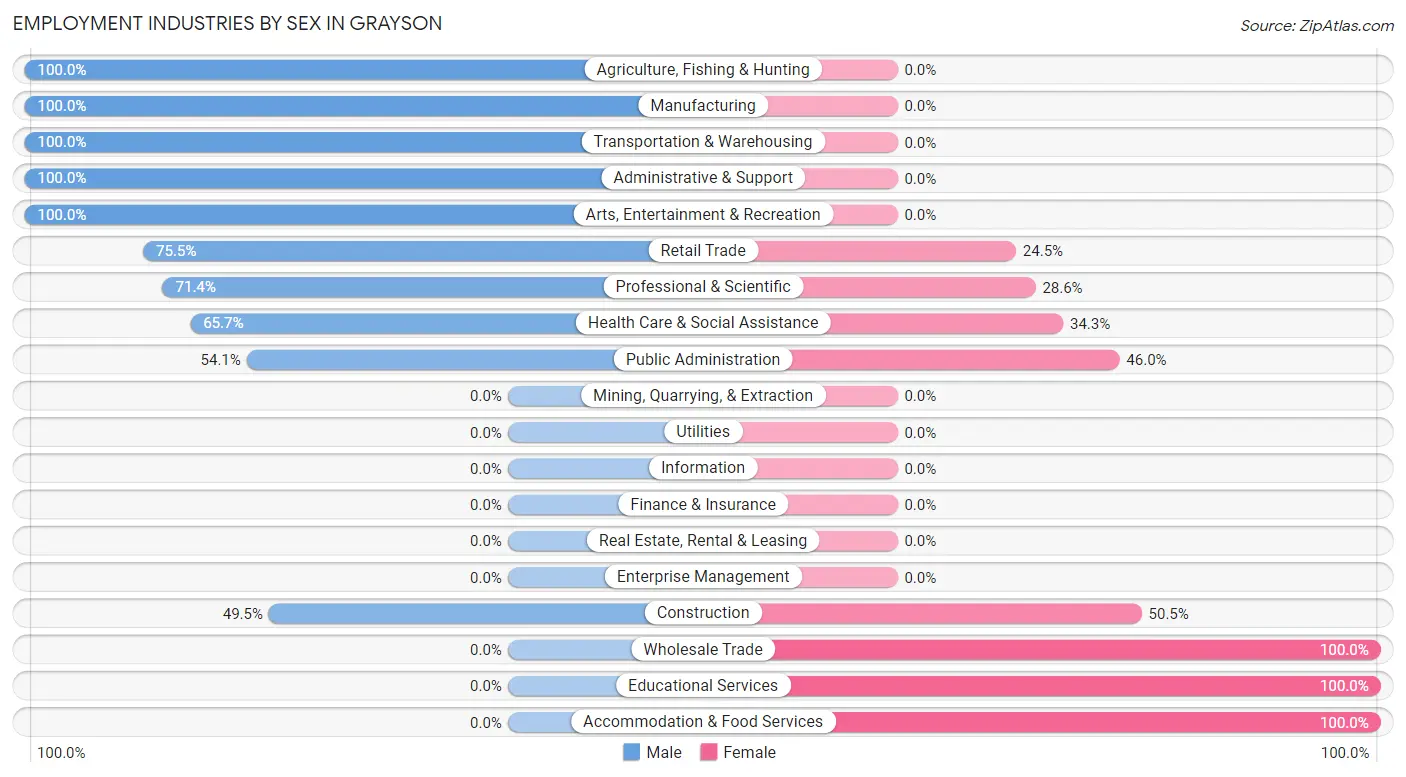
Employment Industries by Sex in Grayson
The Grayson industries that see more men than women are Agriculture, Fishing & Hunting (100.0%), Manufacturing (100.0%), and Transportation & Warehousing (100.0%), whereas the industries that tend to have a higher number of women are Wholesale Trade (100.0%), Educational Services (100.0%), and Accommodation & Food Services (100.0%).
| Industry | Male | Female |
| Agriculture, Fishing & Hunting | 24 (100.0%) | 0 (0.0%) |
| Mining, Quarrying, & Extraction | 0 (0.0%) | 0 (0.0%) |
| Construction | 46 (49.5%) | 47 (50.5%) |
| Manufacturing | 113 (100.0%) | 0 (0.0%) |
| Wholesale Trade | 0 (0.0%) | 7 (100.0%) |
| Retail Trade | 40 (75.5%) | 13 (24.5%) |
| Transportation & Warehousing | 109 (100.0%) | 0 (0.0%) |
| Utilities | 0 (0.0%) | 0 (0.0%) |
| Information | 0 (0.0%) | 0 (0.0%) |
| Finance & Insurance | 0 (0.0%) | 0 (0.0%) |
| Real Estate, Rental & Leasing | 0 (0.0%) | 0 (0.0%) |
| Professional & Scientific | 20 (71.4%) | 8 (28.6%) |
| Enterprise Management | 0 (0.0%) | 0 (0.0%) |
| Administrative & Support | 103 (100.0%) | 0 (0.0%) |
| Educational Services | 0 (0.0%) | 19 (100.0%) |
| Health Care & Social Assistance | 92 (65.7%) | 48 (34.3%) |
| Arts, Entertainment & Recreation | 34 (100.0%) | 0 (0.0%) |
| Accommodation & Food Services | 0 (0.0%) | 10 (100.0%) |
| Public Administration | 40 (54.0%) | 34 (46.0%) |
| Total | 677 (78.4%) | 186 (21.5%) |
Education in Grayson
School Enrollment in Grayson
The most common levels of schooling among the 602 students in Grayson are college / undergraduate (238 | 39.5%), high school (196 | 32.6%), and middle school (132 | 21.9%).
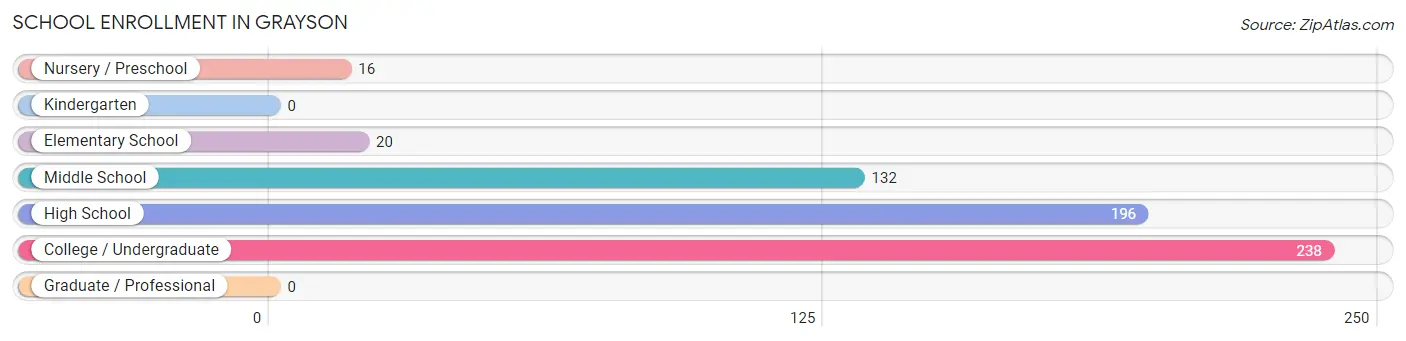
| School Level | # Students | % Students |
| Nursery / Preschool | 16 | 2.7% |
| Kindergarten | 0 | 0.0% |
| Elementary School | 20 | 3.3% |
| Middle School | 132 | 21.9% |
| High School | 196 | 32.6% |
| College / Undergraduate | 238 | 39.5% |
| Graduate / Professional | 0 | 0.0% |
| Total | 602 | 100.0% |
School Enrollment by Age by Funding Source in Grayson
Out of a total of 602 students who are enrolled in schools in Grayson, 59 (9.8%) attend a private institution, while the remaining 543 (90.2%) are enrolled in public schools. The age group of 3 to 4 year olds has the highest likelihood of being enrolled in private schools, with 8 (100.0% in the age bracket) enrolled. Conversely, the age group of 10 to 14 year olds has the lowest likelihood of being enrolled in a private school, with 193 (100.0% in the age bracket) attending a public institution.
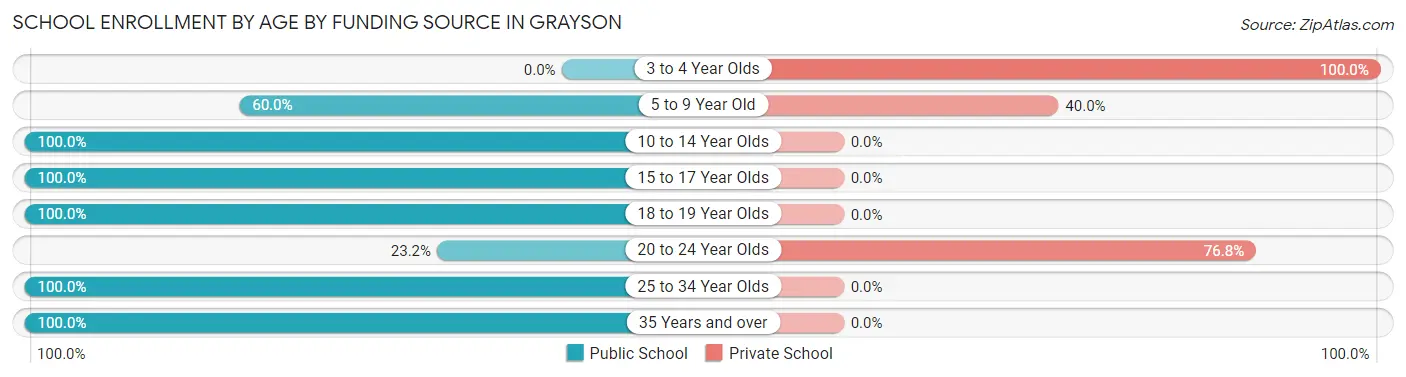
| Age Bracket | Public School | Private School |
| 3 to 4 Year Olds | 0 (0.0%) | 8 (100.0%) |
| 5 to 9 Year Old | 12 (60.0%) | 8 (40.0%) |
| 10 to 14 Year Olds | 193 (100.0%) | 0 (0.0%) |
| 15 to 17 Year Olds | 133 (100.0%) | 0 (0.0%) |
| 18 to 19 Year Olds | 104 (100.0%) | 0 (0.0%) |
| 20 to 24 Year Olds | 13 (23.2%) | 43 (76.8%) |
| 25 to 34 Year Olds | 40 (100.0%) | 0 (0.0%) |
| 35 Years and over | 48 (100.0%) | 0 (0.0%) |
| Total | 543 (90.2%) | 59 (9.8%) |
Educational Attainment by Field of Study in Grayson
Literature & languages (23 | 52.3%), and engineering (21 | 47.7%) are the most common fields of study among 44 individuals in Grayson who have obtained a bachelor's degree or higher.
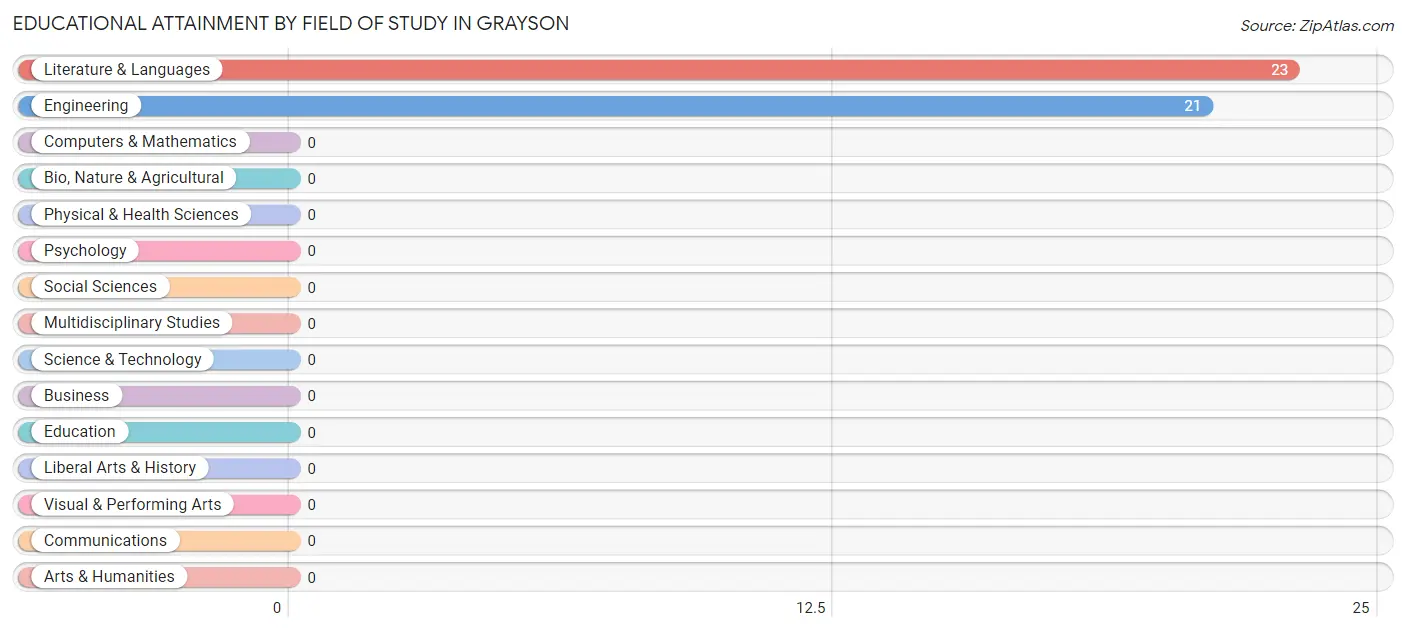
| Field of Study | # Graduates | % Graduates |
| Computers & Mathematics | 0 | 0.0% |
| Bio, Nature & Agricultural | 0 | 0.0% |
| Physical & Health Sciences | 0 | 0.0% |
| Psychology | 0 | 0.0% |
| Social Sciences | 0 | 0.0% |
| Engineering | 21 | 47.7% |
| Multidisciplinary Studies | 0 | 0.0% |
| Science & Technology | 0 | 0.0% |
| Business | 0 | 0.0% |
| Education | 0 | 0.0% |
| Literature & Languages | 23 | 52.3% |
| Liberal Arts & History | 0 | 0.0% |
| Visual & Performing Arts | 0 | 0.0% |
| Communications | 0 | 0.0% |
| Arts & Humanities | 0 | 0.0% |
| Total | 44 | 100.0% |
Transportation & Commute in Grayson
Vehicle Availability by Sex in Grayson
The most prevalent vehicle ownership categories in Grayson are males with 3 vehicles (307, accounting for 46.4%) and females with 3 vehicles (46, making up 165.1%).
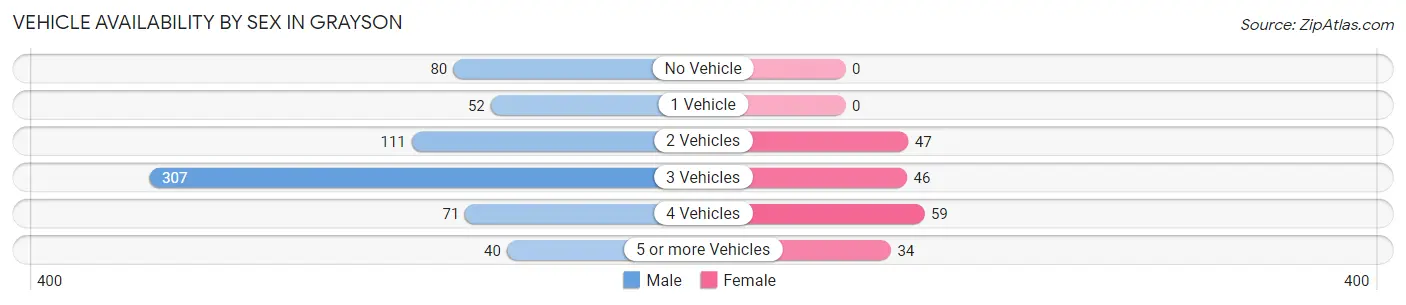
| Vehicles Available | Male | Female |
| No Vehicle | 80 (12.1%) | 0 (0.0%) |
| 1 Vehicle | 52 (7.9%) | 0 (0.0%) |
| 2 Vehicles | 111 (16.8%) | 47 (25.3%) |
| 3 Vehicles | 307 (46.4%) | 46 (24.7%) |
| 4 Vehicles | 71 (10.7%) | 59 (31.7%) |
| 5 or more Vehicles | 40 (6.0%) | 34 (18.3%) |
| Total | 661 (100.0%) | 186 (100.0%) |
Commute Time in Grayson
The most frequently occuring commute durations in Grayson are 45 to 59 minutes (164 commuters, 21.5%), 90 or more minutes (161 commuters, 21.2%), and 15 to 19 minutes (124 commuters, 16.3%).
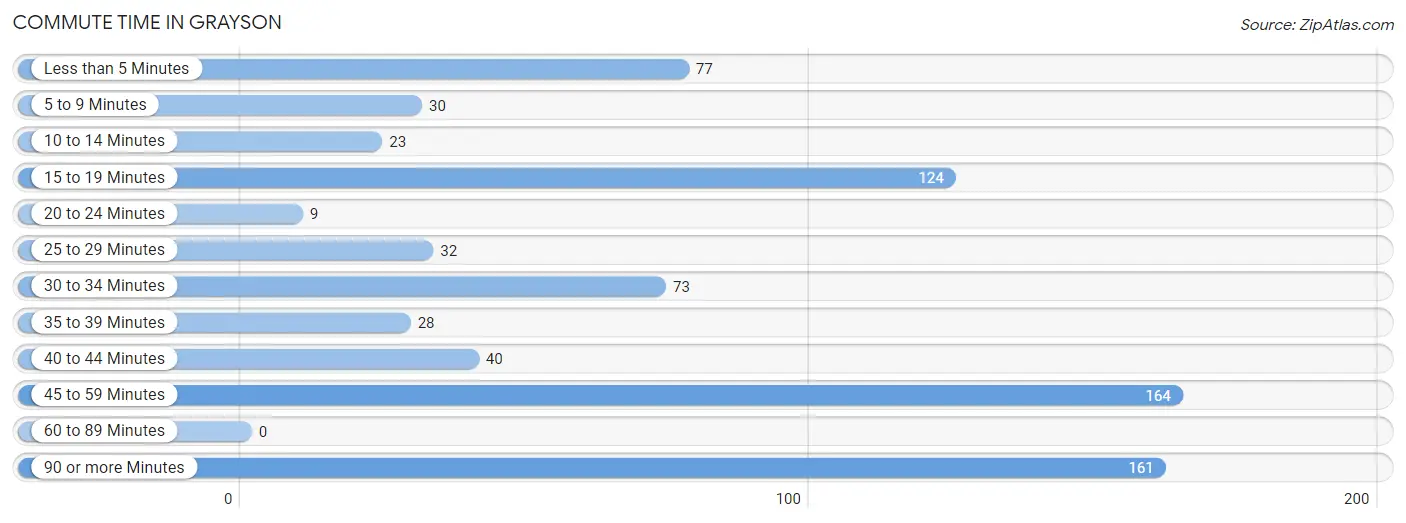
| Commute Time | # Commuters | % Commuters |
| Less than 5 Minutes | 77 | 10.1% |
| 5 to 9 Minutes | 30 | 3.9% |
| 10 to 14 Minutes | 23 | 3.0% |
| 15 to 19 Minutes | 124 | 16.3% |
| 20 to 24 Minutes | 9 | 1.2% |
| 25 to 29 Minutes | 32 | 4.2% |
| 30 to 34 Minutes | 73 | 9.6% |
| 35 to 39 Minutes | 28 | 3.7% |
| 40 to 44 Minutes | 40 | 5.3% |
| 45 to 59 Minutes | 164 | 21.5% |
| 60 to 89 Minutes | 0 | 0.0% |
| 90 or more Minutes | 161 | 21.2% |
Commute Time by Sex in Grayson
The most common commute times in Grayson are 45 to 59 minutes (149 commuters, 25.9%) for males and 90 or more minutes (55 commuters, 29.6%) for females.
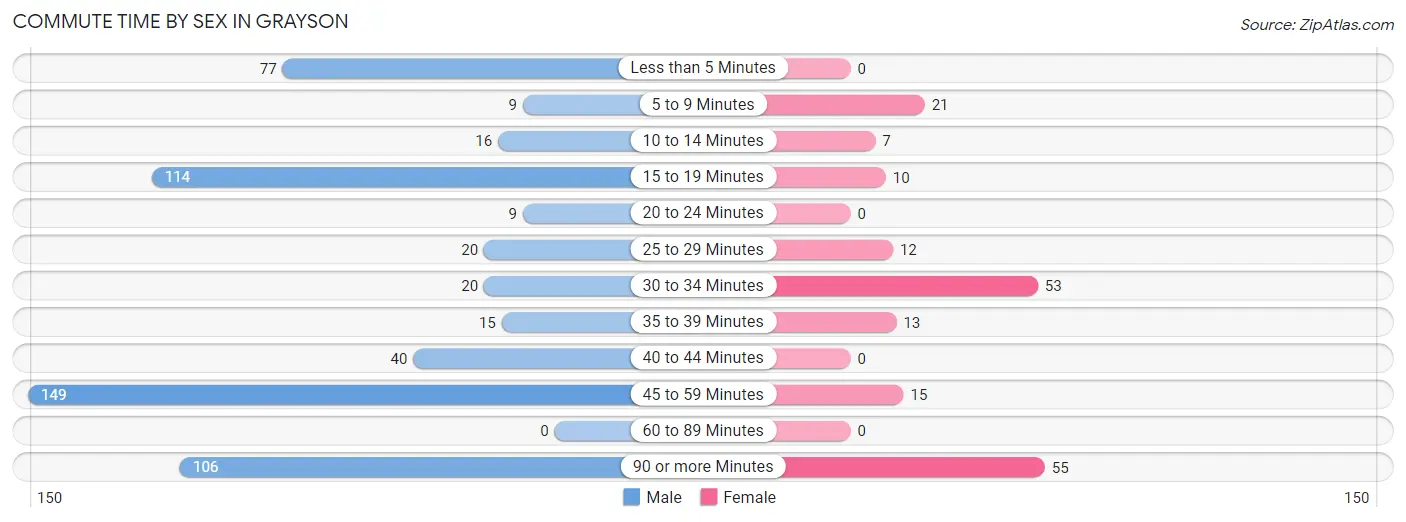
| Commute Time | Male | Female |
| Less than 5 Minutes | 77 (13.4%) | 0 (0.0%) |
| 5 to 9 Minutes | 9 (1.6%) | 21 (11.3%) |
| 10 to 14 Minutes | 16 (2.8%) | 7 (3.8%) |
| 15 to 19 Minutes | 114 (19.8%) | 10 (5.4%) |
| 20 to 24 Minutes | 9 (1.6%) | 0 (0.0%) |
| 25 to 29 Minutes | 20 (3.5%) | 12 (6.5%) |
| 30 to 34 Minutes | 20 (3.5%) | 53 (28.5%) |
| 35 to 39 Minutes | 15 (2.6%) | 13 (7.0%) |
| 40 to 44 Minutes | 40 (7.0%) | 0 (0.0%) |
| 45 to 59 Minutes | 149 (25.9%) | 15 (8.1%) |
| 60 to 89 Minutes | 0 (0.0%) | 0 (0.0%) |
| 90 or more Minutes | 106 (18.4%) | 55 (29.6%) |
Time of Departure to Work by Sex in Grayson
The most frequent times of departure to work in Grayson are 12:00 AM to 4:59 AM (176, 30.6%) for males and 12:00 AM to 4:59 AM (55, 29.6%) for females.
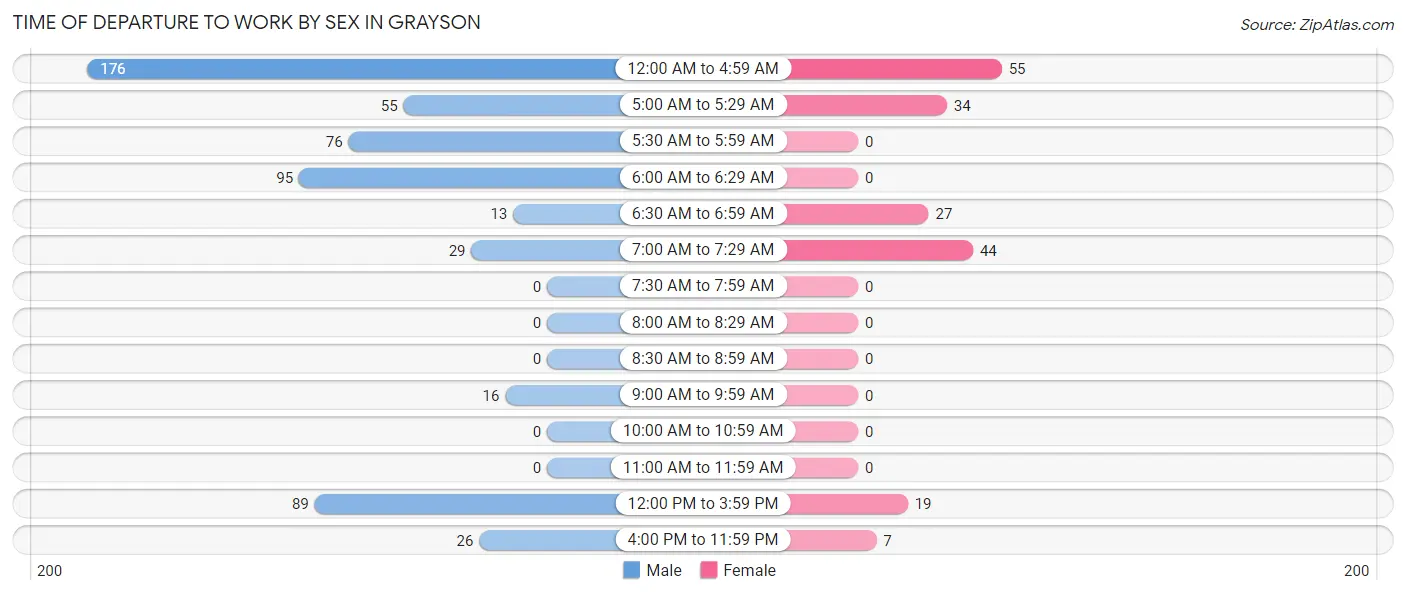
| Time of Departure | Male | Female |
| 12:00 AM to 4:59 AM | 176 (30.6%) | 55 (29.6%) |
| 5:00 AM to 5:29 AM | 55 (9.6%) | 34 (18.3%) |
| 5:30 AM to 5:59 AM | 76 (13.2%) | 0 (0.0%) |
| 6:00 AM to 6:29 AM | 95 (16.5%) | 0 (0.0%) |
| 6:30 AM to 6:59 AM | 13 (2.3%) | 27 (14.5%) |
| 7:00 AM to 7:29 AM | 29 (5.0%) | 44 (23.7%) |
| 7:30 AM to 7:59 AM | 0 (0.0%) | 0 (0.0%) |
| 8:00 AM to 8:29 AM | 0 (0.0%) | 0 (0.0%) |
| 8:30 AM to 8:59 AM | 0 (0.0%) | 0 (0.0%) |
| 9:00 AM to 9:59 AM | 16 (2.8%) | 0 (0.0%) |
| 10:00 AM to 10:59 AM | 0 (0.0%) | 0 (0.0%) |
| 11:00 AM to 11:59 AM | 0 (0.0%) | 0 (0.0%) |
| 12:00 PM to 3:59 PM | 89 (15.5%) | 19 (10.2%) |
| 4:00 PM to 11:59 PM | 26 (4.5%) | 7 (3.8%) |
| Total | 575 (100.0%) | 186 (100.0%) |
Housing Occupancy in Grayson
Occupancy by Ownership in Grayson
Of the total 407 dwellings in Grayson, owner-occupied units account for 232 (57.0%), while renter-occupied units make up 175 (43.0%).
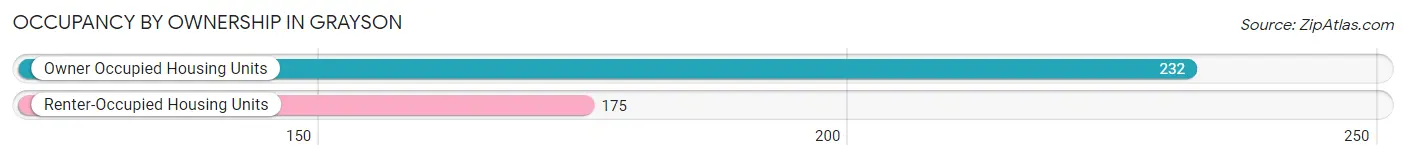
| Occupancy | # Housing Units | % Housing Units |
| Owner Occupied Housing Units | 232 | 57.0% |
| Renter-Occupied Housing Units | 175 | 43.0% |
| Total Occupied Housing Units | 407 | 100.0% |
Occupancy by Household Size in Grayson
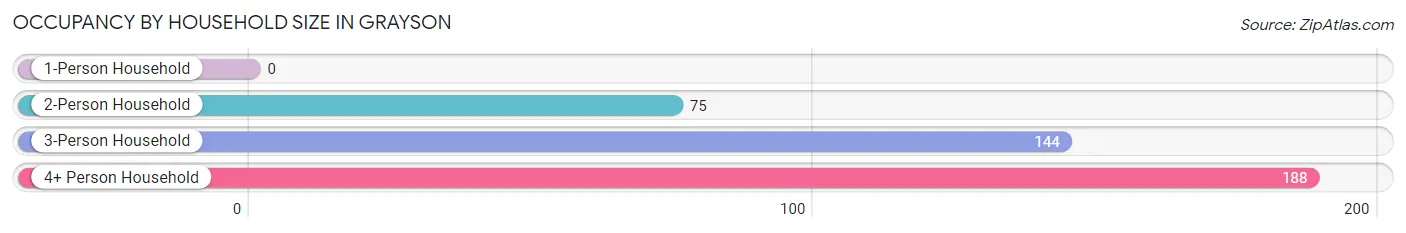
| Household Size | # Housing Units | % Housing Units |
| 1-Person Household | 0 | 0.0% |
| 2-Person Household | 75 | 18.4% |
| 3-Person Household | 144 | 35.4% |
| 4+ Person Household | 188 | 46.2% |
| Total Housing Units | 407 | 100.0% |
Occupancy by Ownership by Household Size in Grayson
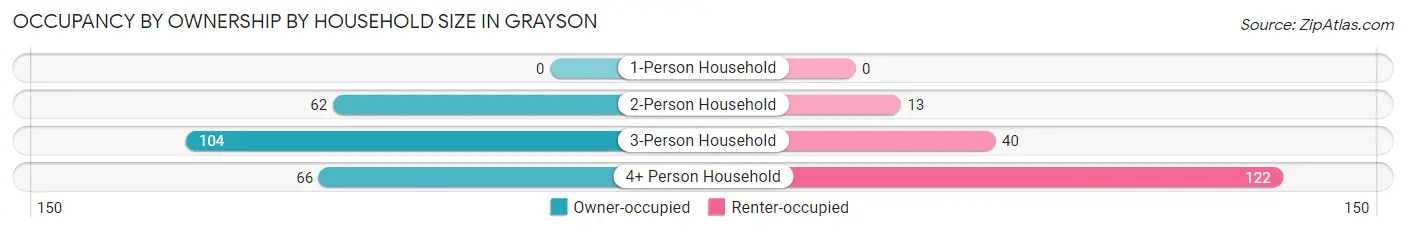
| Household Size | Owner-occupied | Renter-occupied |
| 1-Person Household | 0 (0.0%) | 0 (0.0%) |
| 2-Person Household | 62 (82.7%) | 13 (17.3%) |
| 3-Person Household | 104 (72.2%) | 40 (27.8%) |
| 4+ Person Household | 66 (35.1%) | 122 (64.9%) |
| Total Housing Units | 232 (57.0%) | 175 (43.0%) |
Occupancy by Educational Attainment in Grayson
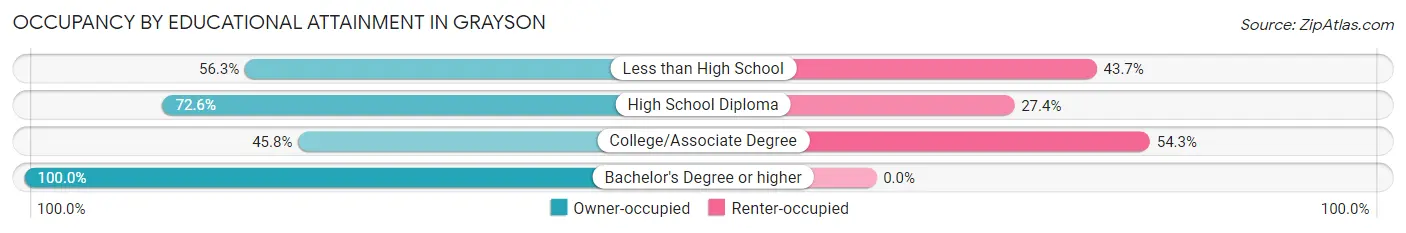
| Household Size | Owner-occupied | Renter-occupied |
| Less than High School | 85 (56.3%) | 66 (43.7%) |
| High School Diploma | 69 (72.6%) | 26 (27.4%) |
| College/Associate Degree | 70 (45.8%) | 83 (54.2%) |
| Bachelor's Degree or higher | 8 (100.0%) | 0 (0.0%) |
Occupancy by Age of Householder in Grayson
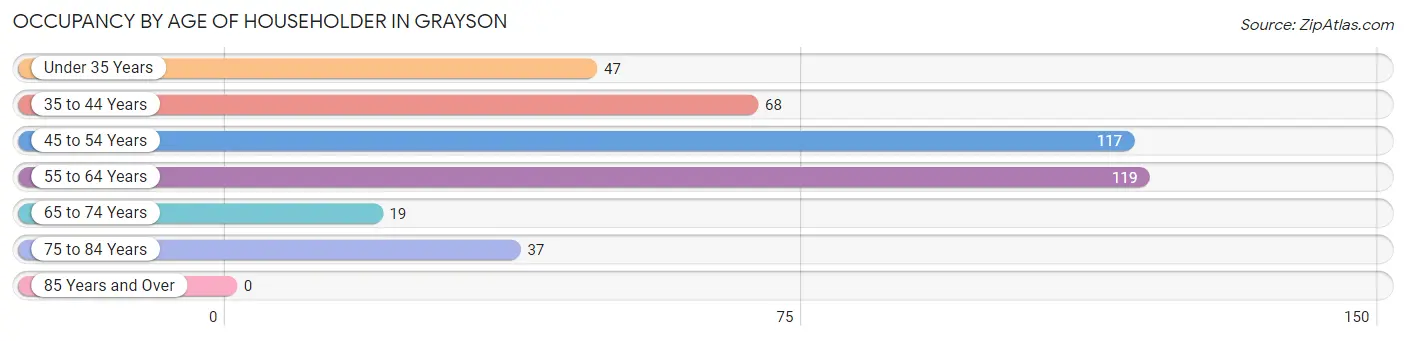
| Age Bracket | # Households | % Households |
| Under 35 Years | 47 | 11.6% |
| 35 to 44 Years | 68 | 16.7% |
| 45 to 54 Years | 117 | 28.7% |
| 55 to 64 Years | 119 | 29.2% |
| 65 to 74 Years | 19 | 4.7% |
| 75 to 84 Years | 37 | 9.1% |
| 85 Years and Over | 0 | 0.0% |
| Total | 407 | 100.0% |
Housing Finances in Grayson
Median Income by Occupancy in Grayson
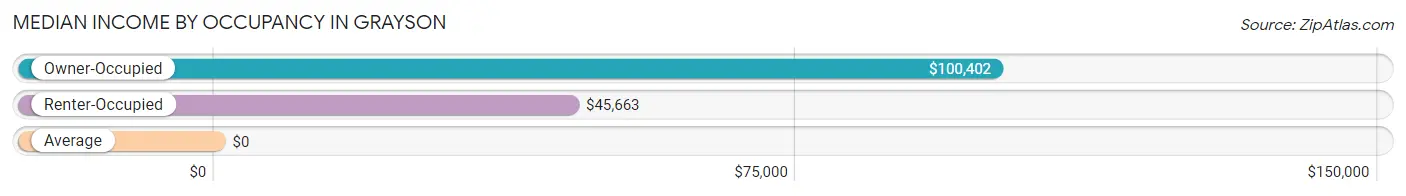
| Occupancy Type | # Households | Median Income |
| Owner-Occupied | 232 (57.0%) | $100,402 |
| Renter-Occupied | 175 (43.0%) | $45,663 |
| Average | 407 (100.0%) | $0 |
Occupancy by Householder Income Bracket in Grayson
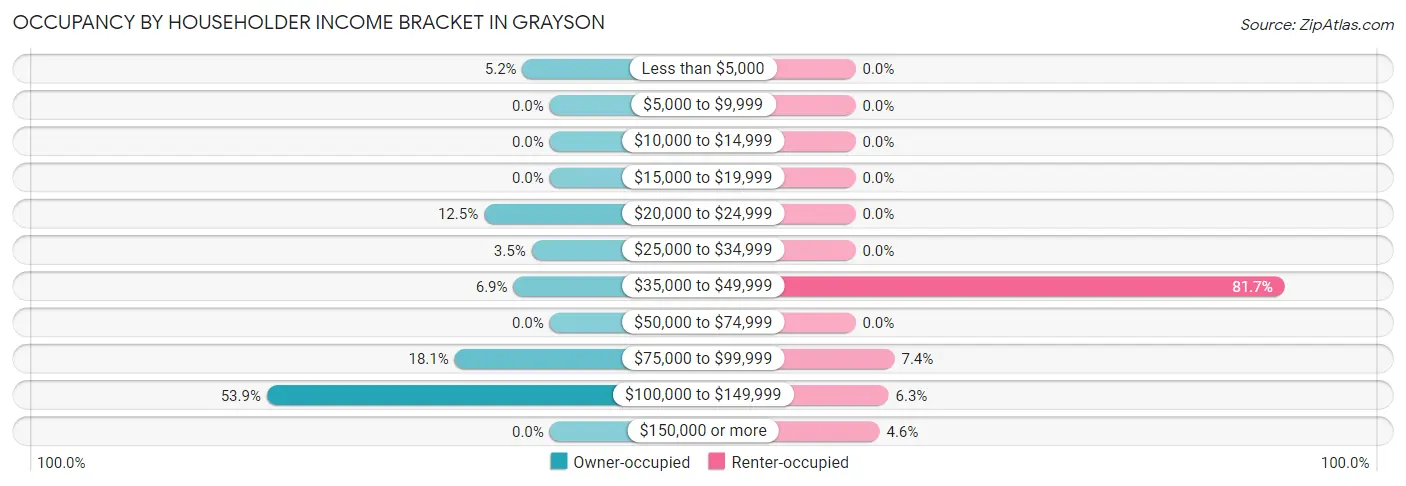
| Income Bracket | Owner-occupied | Renter-occupied |
| Less than $5,000 | 12 (5.2%) | 0 (0.0%) |
| $5,000 to $9,999 | 0 (0.0%) | 0 (0.0%) |
| $10,000 to $14,999 | 0 (0.0%) | 0 (0.0%) |
| $15,000 to $19,999 | 0 (0.0%) | 0 (0.0%) |
| $20,000 to $24,999 | 29 (12.5%) | 0 (0.0%) |
| $25,000 to $34,999 | 8 (3.5%) | 0 (0.0%) |
| $35,000 to $49,999 | 16 (6.9%) | 143 (81.7%) |
| $50,000 to $74,999 | 0 (0.0%) | 0 (0.0%) |
| $75,000 to $99,999 | 42 (18.1%) | 13 (7.4%) |
| $100,000 to $149,999 | 125 (53.9%) | 11 (6.3%) |
| $150,000 or more | 0 (0.0%) | 8 (4.6%) |
| Total | 232 (100.0%) | 175 (100.0%) |
Monthly Housing Cost Tiers in Grayson
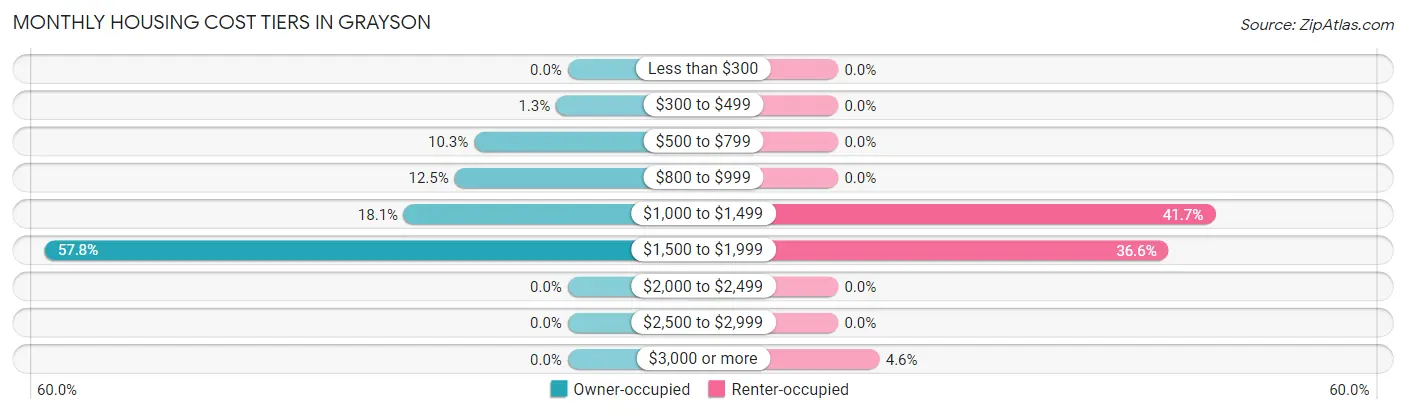
| Monthly Cost | Owner-occupied | Renter-occupied |
| Less than $300 | 0 (0.0%) | 0 (0.0%) |
| $300 to $499 | 3 (1.3%) | 0 (0.0%) |
| $500 to $799 | 24 (10.3%) | 0 (0.0%) |
| $800 to $999 | 29 (12.5%) | 0 (0.0%) |
| $1,000 to $1,499 | 42 (18.1%) | 73 (41.7%) |
| $1,500 to $1,999 | 134 (57.8%) | 64 (36.6%) |
| $2,000 to $2,499 | 0 (0.0%) | 0 (0.0%) |
| $2,500 to $2,999 | 0 (0.0%) | 0 (0.0%) |
| $3,000 or more | 0 (0.0%) | 8 (4.6%) |
| Total | 232 (100.0%) | 175 (100.0%) |
Physical Housing Characteristics in Grayson
Housing Structures in Grayson
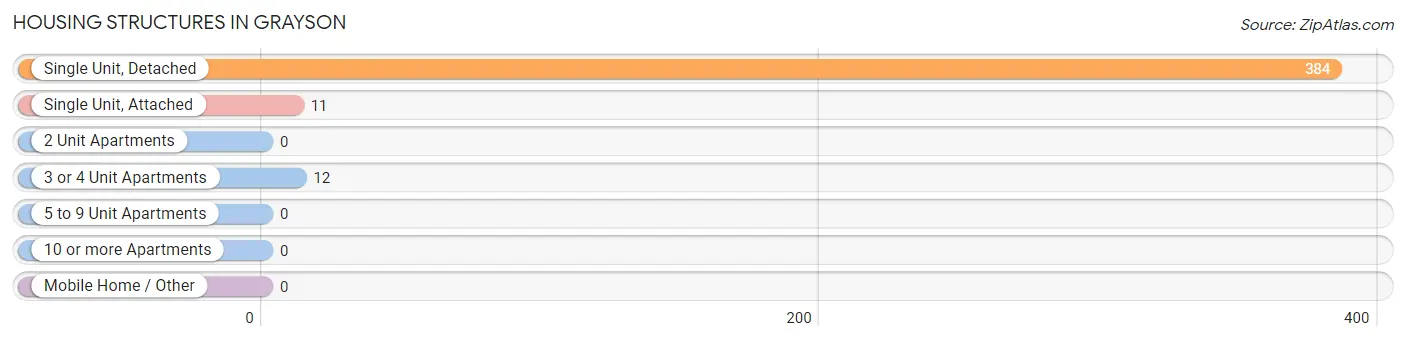
| Structure Type | # Housing Units | % Housing Units |
| Single Unit, Detached | 384 | 94.4% |
| Single Unit, Attached | 11 | 2.7% |
| 2 Unit Apartments | 0 | 0.0% |
| 3 or 4 Unit Apartments | 12 | 2.9% |
| 5 to 9 Unit Apartments | 0 | 0.0% |
| 10 or more Apartments | 0 | 0.0% |
| Mobile Home / Other | 0 | 0.0% |
| Total | 407 | 100.0% |
Housing Structures by Occupancy in Grayson
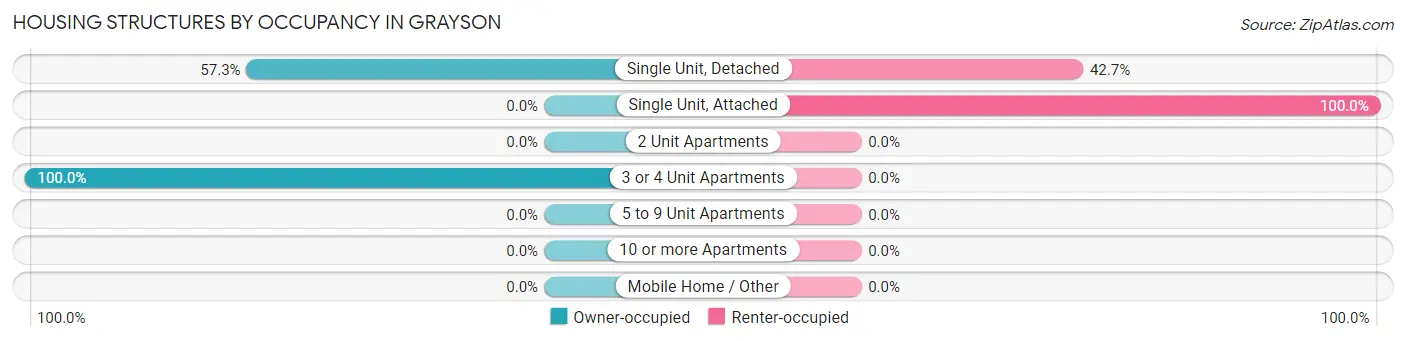
| Structure Type | Owner-occupied | Renter-occupied |
| Single Unit, Detached | 220 (57.3%) | 164 (42.7%) |
| Single Unit, Attached | 0 (0.0%) | 11 (100.0%) |
| 2 Unit Apartments | 0 (0.0%) | 0 (0.0%) |
| 3 or 4 Unit Apartments | 12 (100.0%) | 0 (0.0%) |
| 5 to 9 Unit Apartments | 0 (0.0%) | 0 (0.0%) |
| 10 or more Apartments | 0 (0.0%) | 0 (0.0%) |
| Mobile Home / Other | 0 (0.0%) | 0 (0.0%) |
| Total | 232 (57.0%) | 175 (43.0%) |
Housing Structures by Number of Rooms in Grayson
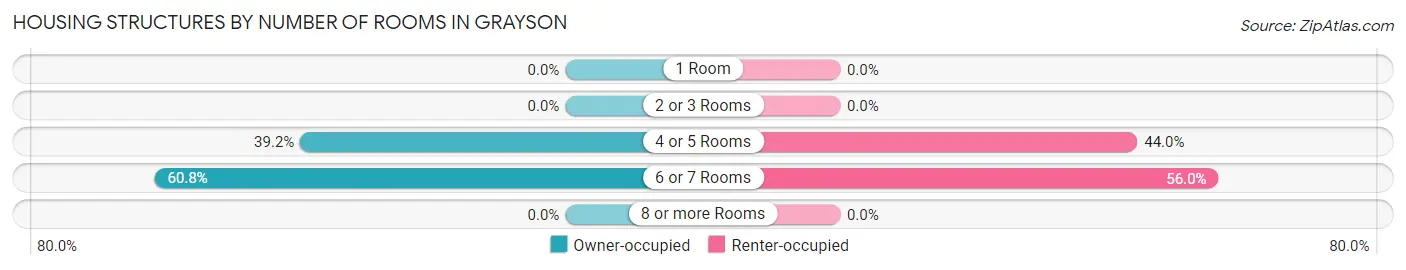
| Number of Rooms | Owner-occupied | Renter-occupied |
| 1 Room | 0 (0.0%) | 0 (0.0%) |
| 2 or 3 Rooms | 0 (0.0%) | 0 (0.0%) |
| 4 or 5 Rooms | 91 (39.2%) | 77 (44.0%) |
| 6 or 7 Rooms | 141 (60.8%) | 98 (56.0%) |
| 8 or more Rooms | 0 (0.0%) | 0 (0.0%) |
| Total | 232 (100.0%) | 175 (100.0%) |
Housing Structure by Heating Type in Grayson
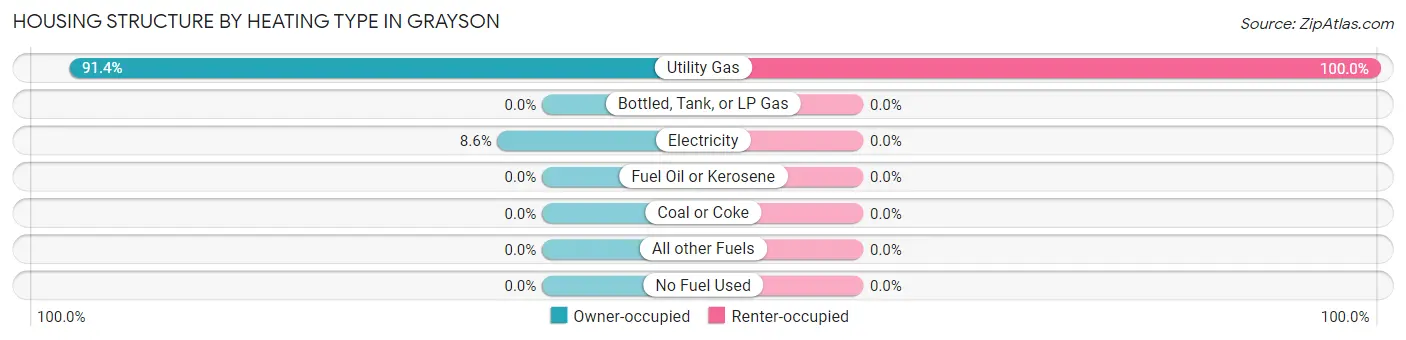
| Heating Type | Owner-occupied | Renter-occupied |
| Utility Gas | 212 (91.4%) | 175 (100.0%) |
| Bottled, Tank, or LP Gas | 0 (0.0%) | 0 (0.0%) |
| Electricity | 20 (8.6%) | 0 (0.0%) |
| Fuel Oil or Kerosene | 0 (0.0%) | 0 (0.0%) |
| Coal or Coke | 0 (0.0%) | 0 (0.0%) |
| All other Fuels | 0 (0.0%) | 0 (0.0%) |
| No Fuel Used | 0 (0.0%) | 0 (0.0%) |
| Total | 232 (100.0%) | 175 (100.0%) |
Household Vehicle Usage in Grayson
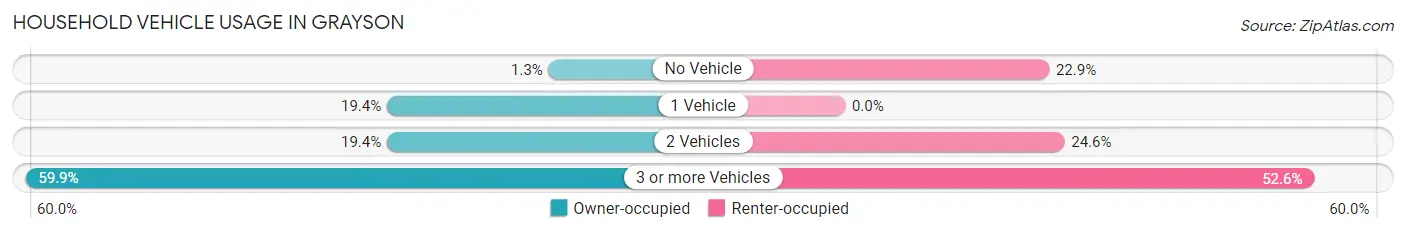
| Vehicles per Household | Owner-occupied | Renter-occupied |
| No Vehicle | 3 (1.3%) | 40 (22.9%) |
| 1 Vehicle | 45 (19.4%) | 0 (0.0%) |
| 2 Vehicles | 45 (19.4%) | 43 (24.6%) |
| 3 or more Vehicles | 139 (59.9%) | 92 (52.6%) |
| Total | 232 (100.0%) | 175 (100.0%) |
Real Estate & Mortgages in Grayson
Real Estate and Mortgage Overview in Grayson
| Characteristic | Without Mortgage | With Mortgage |
| Housing Units | 56 | 176 |
| Median Property Value | $431,700 | $350,000 |
| Median Household Income | - | - |
| Monthly Housing Costs | $903 | $0 |
| Real Estate Taxes | - | - |
Property Value by Mortgage Status in Grayson
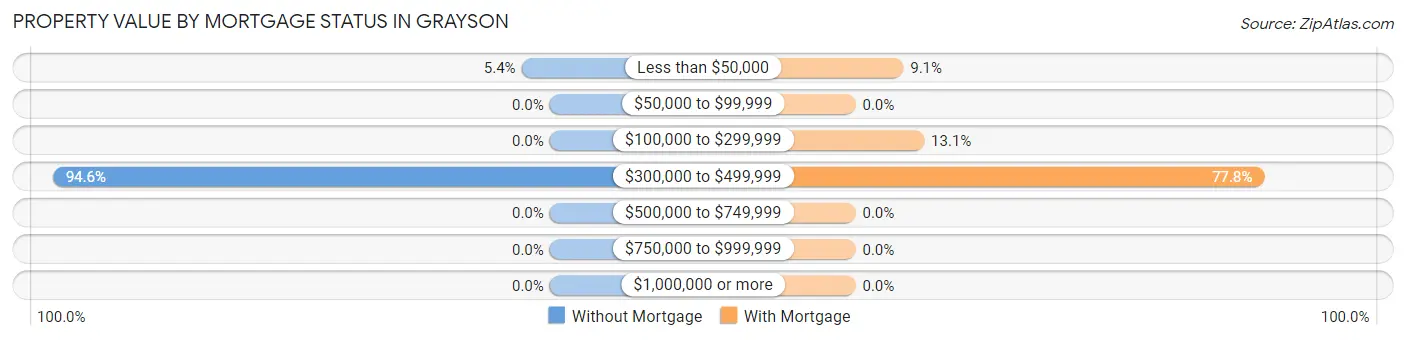
| Property Value | Without Mortgage | With Mortgage |
| Less than $50,000 | 3 (5.4%) | 16 (9.1%) |
| $50,000 to $99,999 | 0 (0.0%) | 0 (0.0%) |
| $100,000 to $299,999 | 0 (0.0%) | 23 (13.1%) |
| $300,000 to $499,999 | 53 (94.6%) | 137 (77.8%) |
| $500,000 to $749,999 | 0 (0.0%) | 0 (0.0%) |
| $750,000 to $999,999 | 0 (0.0%) | 0 (0.0%) |
| $1,000,000 or more | 0 (0.0%) | 0 (0.0%) |
| Total | 56 (100.0%) | 176 (100.0%) |
Household Income by Mortgage Status in Grayson
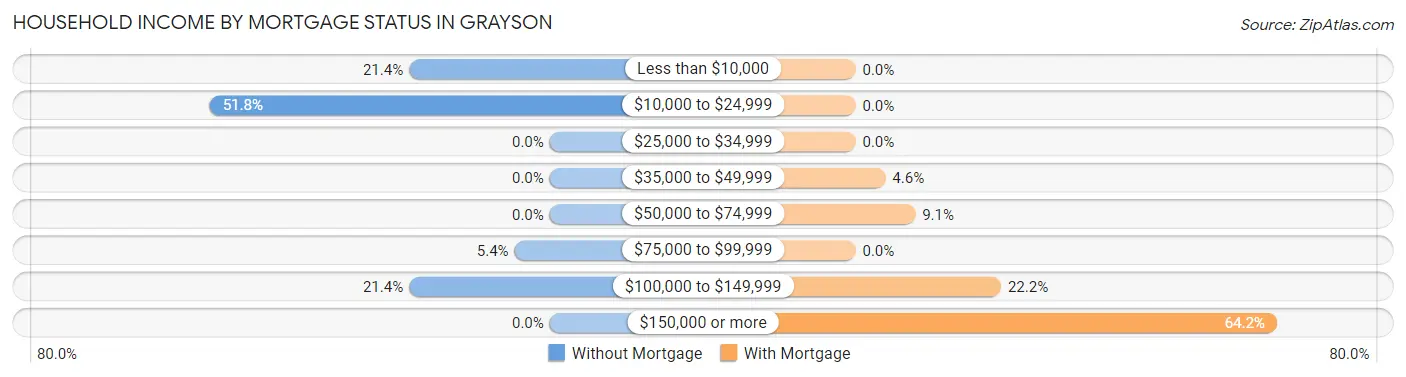
| Household Income | Without Mortgage | With Mortgage |
| Less than $10,000 | 12 (21.4%) | 0 (0.0%) |
| $10,000 to $24,999 | 29 (51.8%) | 0 (0.0%) |
| $25,000 to $34,999 | 0 (0.0%) | 0 (0.0%) |
| $35,000 to $49,999 | 0 (0.0%) | 8 (4.5%) |
| $50,000 to $74,999 | 0 (0.0%) | 16 (9.1%) |
| $75,000 to $99,999 | 3 (5.4%) | 0 (0.0%) |
| $100,000 to $149,999 | 12 (21.4%) | 39 (22.2%) |
| $150,000 or more | 0 (0.0%) | 113 (64.2%) |
| Total | 56 (100.0%) | 176 (100.0%) |
Property Value to Household Income Ratio in Grayson
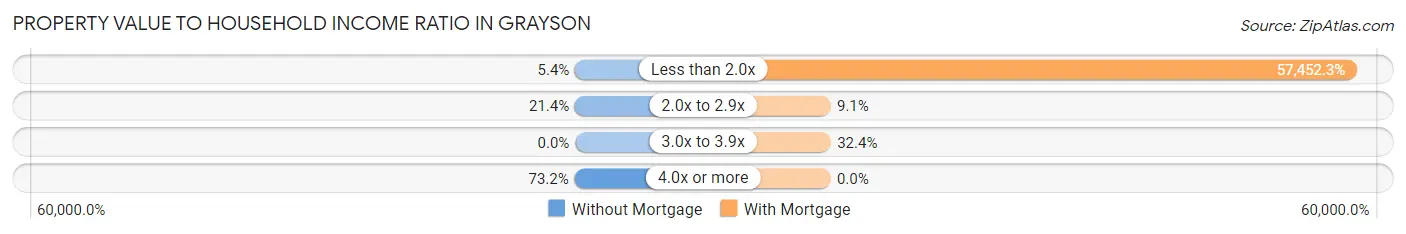
| Value-to-Income Ratio | Without Mortgage | With Mortgage |
| Less than 2.0x | 3 (5.4%) | 101,116 (57,452.3%) |
| 2.0x to 2.9x | 12 (21.4%) | 16 (9.1%) |
| 3.0x to 3.9x | 0 (0.0%) | 57 (32.4%) |
| 4.0x or more | 41 (73.2%) | 0 (0.0%) |
| Total | 56 (100.0%) | 176 (100.0%) |
Real Estate Taxes by Mortgage Status in Grayson
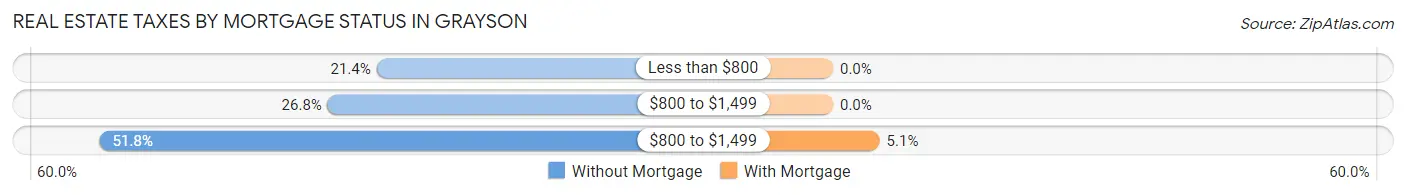
| Property Taxes | Without Mortgage | With Mortgage |
| Less than $800 | 12 (21.4%) | 0 (0.0%) |
| $800 to $1,499 | 15 (26.8%) | 0 (0.0%) |
| $800 to $1,499 | 29 (51.8%) | 9 (5.1%) |
| Total | 56 (100.0%) | 176 (100.0%) |
Health & Disability in Grayson
Health Insurance Coverage by Age in Grayson
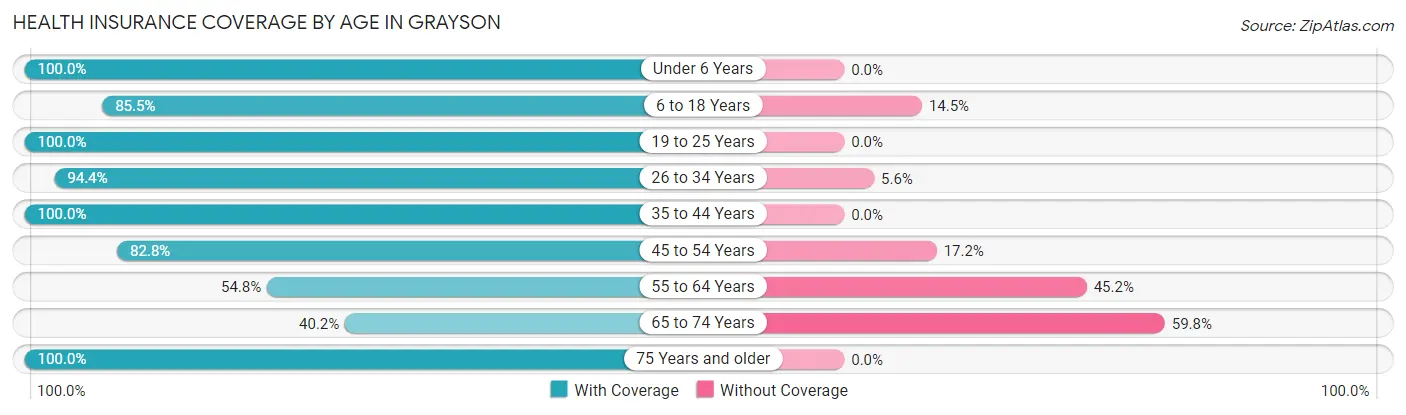
| Age Bracket | With Coverage | Without Coverage |
| Under 6 Years | 58 (100.0%) | 0 (0.0%) |
| 6 to 18 Years | 378 (85.5%) | 64 (14.5%) |
| 19 to 25 Years | 141 (100.0%) | 0 (0.0%) |
| 26 to 34 Years | 153 (94.4%) | 9 (5.6%) |
| 35 to 44 Years | 162 (100.0%) | 0 (0.0%) |
| 45 to 54 Years | 269 (82.8%) | 56 (17.2%) |
| 55 to 64 Years | 80 (54.8%) | 66 (45.2%) |
| 65 to 74 Years | 35 (40.2%) | 52 (59.8%) |
| 75 Years and older | 70 (100.0%) | 0 (0.0%) |
| Total | 1,346 (84.5%) | 247 (15.5%) |
Health Insurance Coverage by Citizenship Status in Grayson
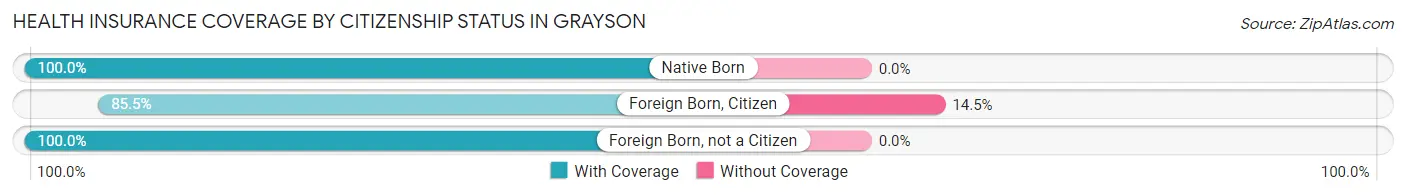
| Citizenship Status | With Coverage | Without Coverage |
| Native Born | 58 (100.0%) | 0 (0.0%) |
| Foreign Born, Citizen | 378 (85.5%) | 64 (14.5%) |
| Foreign Born, not a Citizen | 141 (100.0%) | 0 (0.0%) |
Health Insurance Coverage by Household Income in Grayson
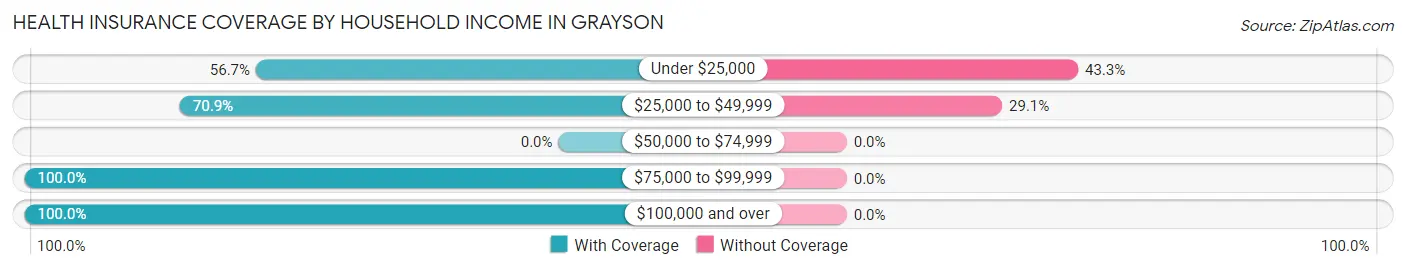
| Household Income | With Coverage | Without Coverage |
| Under $25,000 | 68 (56.7%) | 52 (43.3%) |
| $25,000 to $49,999 | 475 (70.9%) | 195 (29.1%) |
| $50,000 to $74,999 | 0 (0.0%) | 0 (0.0%) |
| $75,000 to $99,999 | 212 (100.0%) | 0 (0.0%) |
| $100,000 and over | 591 (100.0%) | 0 (0.0%) |
Public vs Private Health Insurance Coverage by Age in Grayson
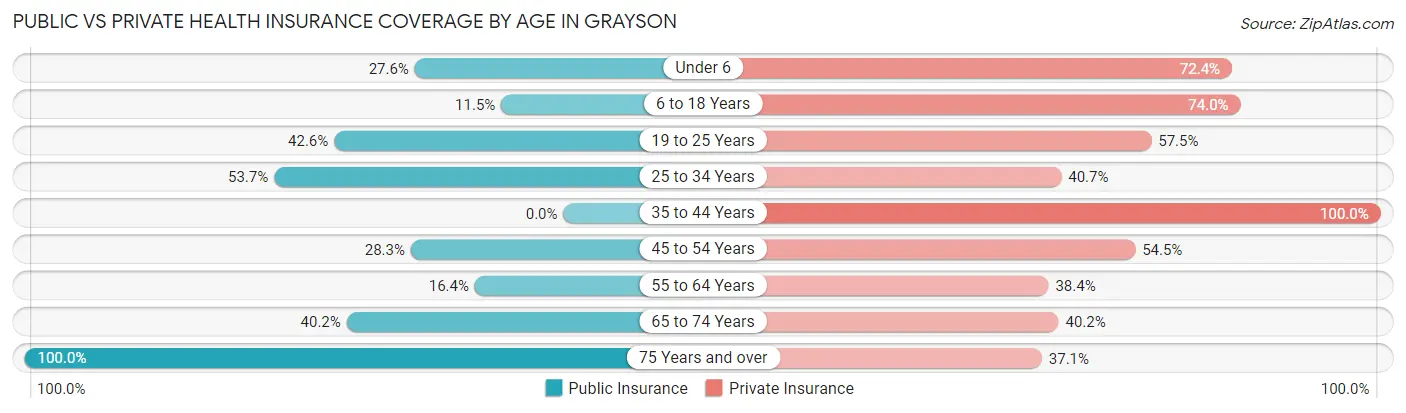
| Age Bracket | Public Insurance | Private Insurance |
| Under 6 | 16 (27.6%) | 42 (72.4%) |
| 6 to 18 Years | 51 (11.5%) | 327 (74.0%) |
| 19 to 25 Years | 60 (42.5%) | 81 (57.5%) |
| 25 to 34 Years | 87 (53.7%) | 66 (40.7%) |
| 35 to 44 Years | 0 (0.0%) | 162 (100.0%) |
| 45 to 54 Years | 92 (28.3%) | 177 (54.5%) |
| 55 to 64 Years | 24 (16.4%) | 56 (38.4%) |
| 65 to 74 Years | 35 (40.2%) | 35 (40.2%) |
| 75 Years and over | 70 (100.0%) | 26 (37.1%) |
| Total | 435 (27.3%) | 972 (61.0%) |
Disability Status by Sex by Age in Grayson
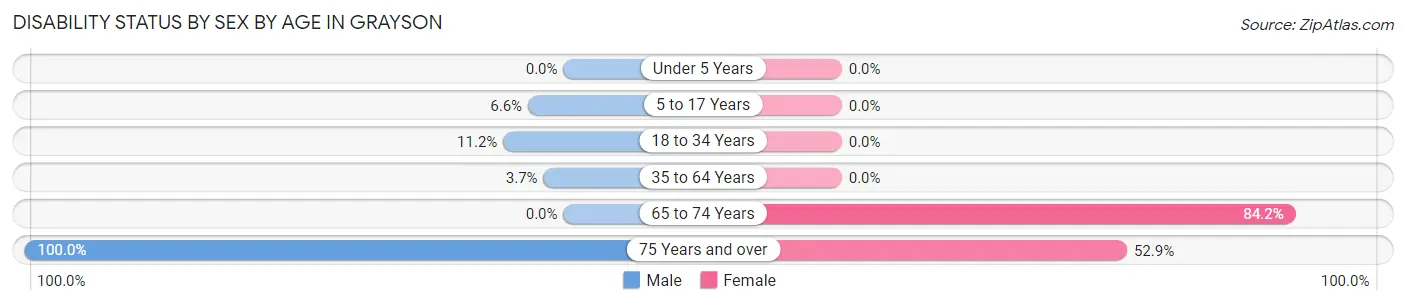
| Age Bracket | Male | Female |
| Under 5 Years | 0 (0.0%) | 0 (0.0%) |
| 5 to 17 Years | 13 (6.6%) | 0 (0.0%) |
| 18 to 34 Years | 43 (11.2%) | 0 (0.0%) |
| 35 to 64 Years | 12 (3.7%) | 0 (0.0%) |
| 65 to 74 Years | 0 (0.0%) | 16 (84.2%) |
| 75 Years and over | 53 (100.0%) | 9 (52.9%) |
Disability Class by Sex by Age in Grayson
Disability Class: Hearing Difficulty
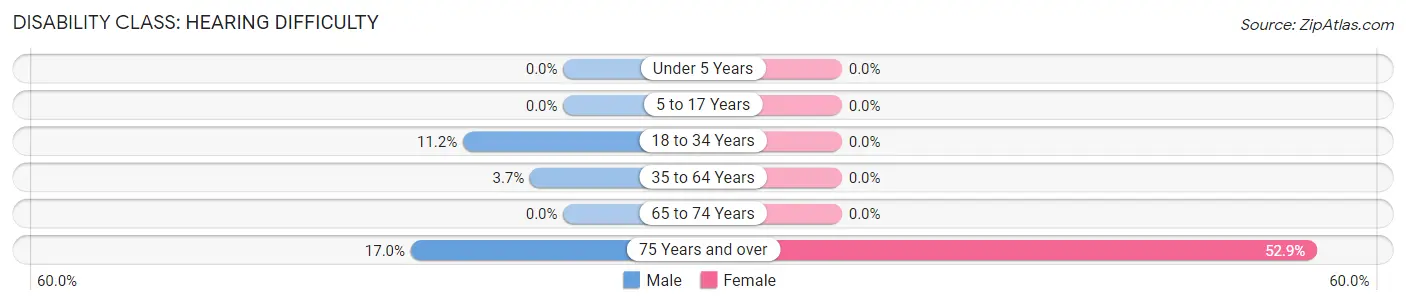
| Age Bracket | Male | Female |
| Under 5 Years | 0 (0.0%) | 0 (0.0%) |
| 5 to 17 Years | 0 (0.0%) | 0 (0.0%) |
| 18 to 34 Years | 43 (11.2%) | 0 (0.0%) |
| 35 to 64 Years | 12 (3.7%) | 0 (0.0%) |
| 65 to 74 Years | 0 (0.0%) | 0 (0.0%) |
| 75 Years and over | 9 (17.0%) | 9 (52.9%) |
Disability Class: Vision Difficulty
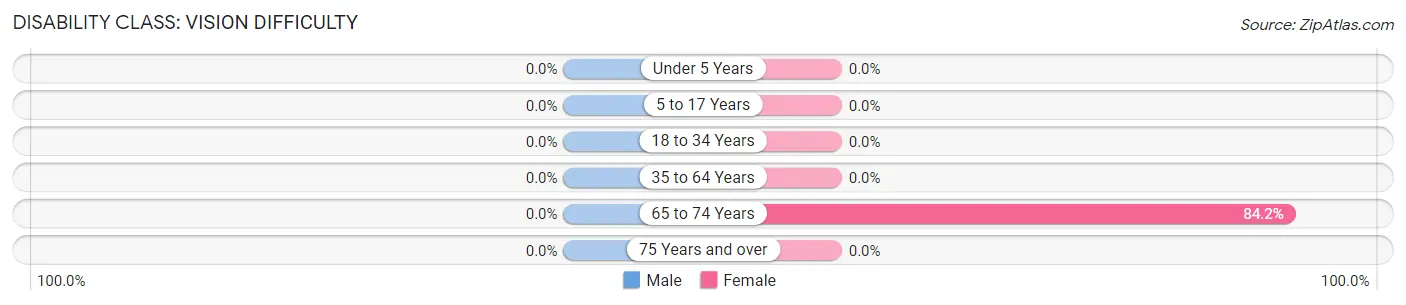
| Age Bracket | Male | Female |
| Under 5 Years | 0 (0.0%) | 0 (0.0%) |
| 5 to 17 Years | 0 (0.0%) | 0 (0.0%) |
| 18 to 34 Years | 0 (0.0%) | 0 (0.0%) |
| 35 to 64 Years | 0 (0.0%) | 0 (0.0%) |
| 65 to 74 Years | 0 (0.0%) | 16 (84.2%) |
| 75 Years and over | 0 (0.0%) | 0 (0.0%) |
Disability Class: Cognitive Difficulty
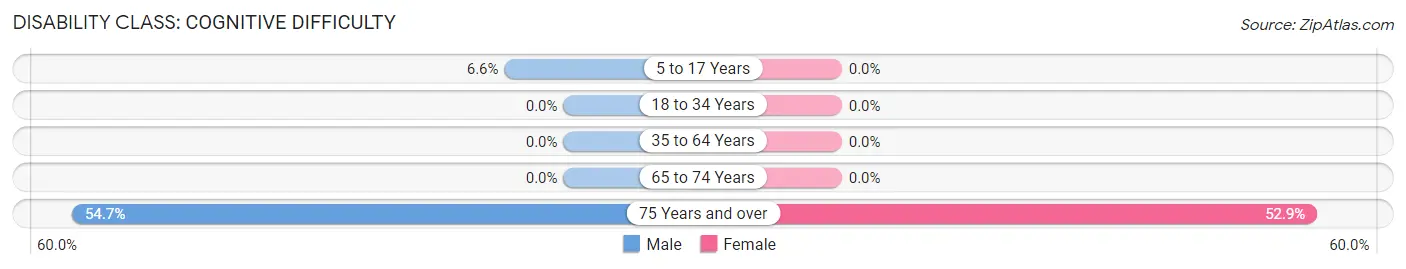
| Age Bracket | Male | Female |
| 5 to 17 Years | 13 (6.6%) | 0 (0.0%) |
| 18 to 34 Years | 0 (0.0%) | 0 (0.0%) |
| 35 to 64 Years | 0 (0.0%) | 0 (0.0%) |
| 65 to 74 Years | 0 (0.0%) | 0 (0.0%) |
| 75 Years and over | 29 (54.7%) | 9 (52.9%) |
Disability Class: Ambulatory Difficulty
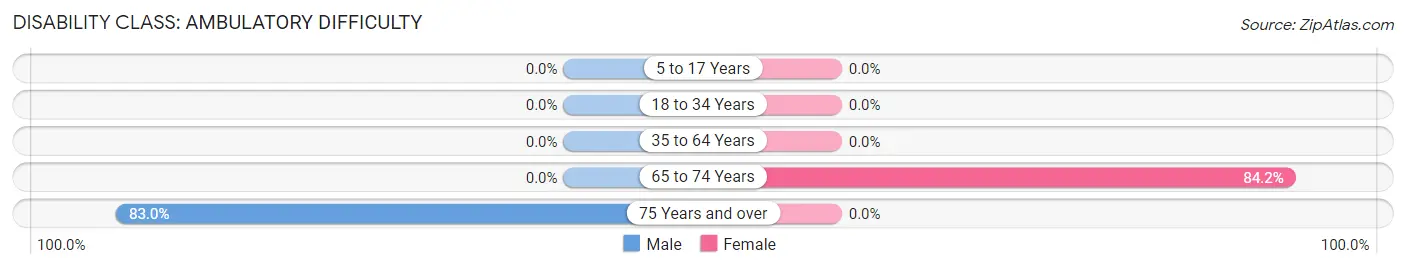
| Age Bracket | Male | Female |
| 5 to 17 Years | 0 (0.0%) | 0 (0.0%) |
| 18 to 34 Years | 0 (0.0%) | 0 (0.0%) |
| 35 to 64 Years | 0 (0.0%) | 0 (0.0%) |
| 65 to 74 Years | 0 (0.0%) | 16 (84.2%) |
| 75 Years and over | 44 (83.0%) | 0 (0.0%) |
Disability Class: Self-Care Difficulty
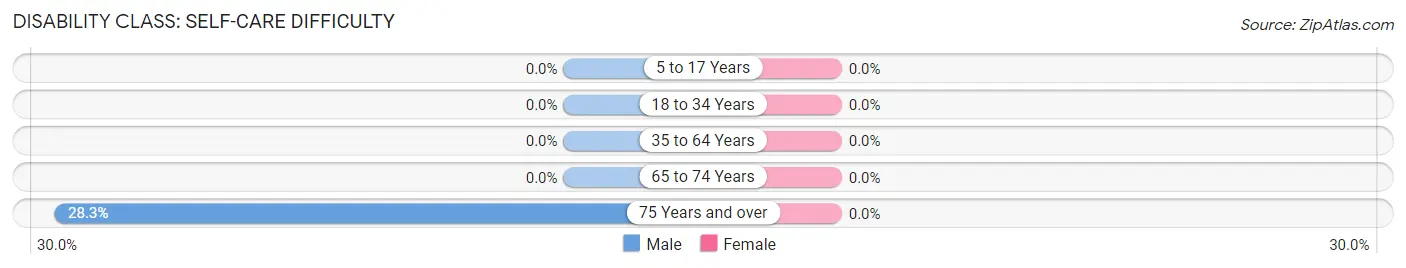
| Age Bracket | Male | Female |
| 5 to 17 Years | 0 (0.0%) | 0 (0.0%) |
| 18 to 34 Years | 0 (0.0%) | 0 (0.0%) |
| 35 to 64 Years | 0 (0.0%) | 0 (0.0%) |
| 65 to 74 Years | 0 (0.0%) | 0 (0.0%) |
| 75 Years and over | 15 (28.3%) | 0 (0.0%) |
Technology Access in Grayson
Computing Device Access in Grayson
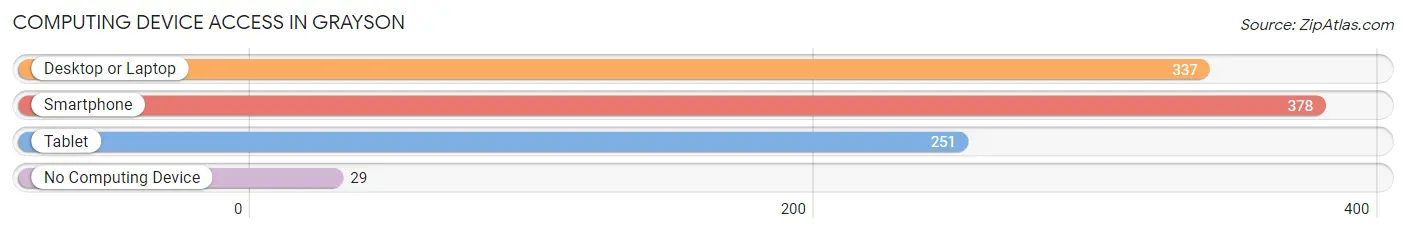
| Device Type | # Households | % Households |
| Desktop or Laptop | 337 | 82.8% |
| Smartphone | 378 | 92.9% |
| Tablet | 251 | 61.7% |
| No Computing Device | 29 | 7.1% |
| Total | 407 | 100.0% |
Internet Access in Grayson
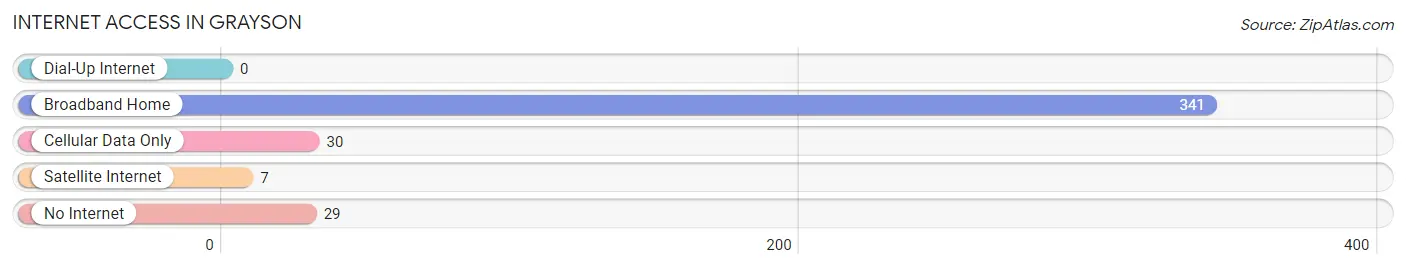
| Internet Type | # Households | % Households |
| Dial-Up Internet | 0 | 0.0% |
| Broadband Home | 341 | 83.8% |
| Cellular Data Only | 30 | 7.4% |
| Satellite Internet | 7 | 1.7% |
| No Internet | 29 | 7.1% |
| Total | 407 | 100.0% |
Grayson Summary
Grayson is a small unincorporated community located in Contra Costa County, California. It is situated in the San Francisco Bay Area, approximately 25 miles east of San Francisco. The population of Grayson was estimated to be 1,845 in the year 2000.
History
Grayson was originally part of the Rancho El Sobrante land grant, which was granted to the Castro family in 1841. The area was then known as Castroville. In 1879, the area was renamed Grayson after the Grayson family, who had purchased the land from the Castro family. The Grayson family operated a dairy farm in the area until the early 1900s.
In the early 1900s, the area began to develop as a residential community. The first post office was established in Grayson in 1906. In the 1920s, the area was connected to the rest of the Bay Area by the completion of the San Francisco-Oakland Bay Bridge.
Geography
Grayson is located in Contra Costa County, California. It is situated in the San Francisco Bay Area, approximately 25 miles east of San Francisco. The area is bordered by El Sobrante to the north, San Pablo to the east, Pinole to the south, and Richmond to the west.
The area is mostly flat, with an elevation of approximately 200 feet. The climate is mild, with temperatures ranging from the mid-50s to the mid-70s throughout the year.
Economy
The economy of Grayson is largely based on the service industry. The area is home to a variety of restaurants, retail stores, and other businesses. The area also has a number of industrial and manufacturing businesses.
The median household income in Grayson was estimated to be $50,845 in the year 2000. The unemployment rate was estimated to be 4.2%.
Demographics
The population of Grayson was estimated to be 1,845 in the year 2000. The racial makeup of the area was estimated to be 57.3% White, 24.2% Hispanic, 11.2% Asian, and 7.3% African American.
The median age in Grayson was estimated to be 37.5 years. The median age for males was estimated to be 36.2 years, and the median age for females was estimated to be 38.8 years.
Conclusion
Grayson is a small unincorporated community located in Contra Costa County, California. It is situated in the San Francisco Bay Area, approximately 25 miles east of San Francisco. The population of Grayson was estimated to be 1,845 in the year 2000. The economy of Grayson is largely based on the service industry, and the median household income was estimated to be $50,845 in the year 2000. The racial makeup of the area was estimated to be 57.3% White, 24.2% Hispanic, 11.2% Asian, and 7.3% African American. The median age in Grayson was estimated to be 37.5 years.
Common Questions
What is Per Capita Income in Grayson?
Per Capita income in Grayson is $22,729.
What is the Median Family Income in Grayson?
Median Family Income in Grayson is $69,286.
What is Income or Wage Gap in Grayson?
Income or Wage Gap in Grayson is 44.8%.
Women in Grayson earn 55.2 cents for every dollar earned by a man.
What is Inequality or Gini Index in Grayson?
Inequality or Gini Index in Grayson is 0.34.
What is the Total Population of Grayson?
Total Population of Grayson is 1,593.
What is the Total Male Population of Grayson?
Total Male Population of Grayson is 1,070.
What is the Total Female Population of Grayson?
Total Female Population of Grayson is 523.
What is the Ratio of Males per 100 Females in Grayson?
There are 204.59 Males per 100 Females in Grayson.
What is the Ratio of Females per 100 Males in Grayson?
There are 48.88 Females per 100 Males in Grayson.
What is the Median Population Age in Grayson?
Median Population Age in Grayson is 34.8 Years.
What is the Average Family Size in Grayson
Average Family Size in Grayson is 4.0 People.
What is the Average Household Size in Grayson
Average Household Size in Grayson is 3.9 People.
How Large is the Labor Force in Grayson?
There are 881 People in the Labor Forcein in Grayson.
What is the Percentage of People in the Labor Force in Grayson?
66.9% of People are in the Labor Force in Grayson.
What is the Unemployment Rate in Grayson?
Unemployment Rate in Grayson is 2.0%.