Ford City, CA Map & Demographics
Ford City Map
Ford City Overview
$15,888
PER CAPITA INCOME
$43,162
AVG FAMILY INCOME
$42,826
AVG HOUSEHOLD INCOME
20.1%
WAGE / INCOME GAP [ % ]
79.9¢/ $1
WAGE / INCOME GAP [ $ ]
0.44
INEQUALITY / GINI INDEX
4,357
TOTAL POPULATION
2,233
MALE POPULATION
2,124
FEMALE POPULATION
105.13
MALES / 100 FEMALES
95.12
FEMALES / 100 MALES
25.7
MEDIAN AGE
3.7
AVG FAMILY SIZE
3.5
AVG HOUSEHOLD SIZE
1,911
LABOR FORCE [ PEOPLE ]
61.4%
PERCENT IN LABOR FORCE
20.8%
UNEMPLOYMENT RATE
Income in Ford City
Income Overview in Ford City
Per Capita Income in Ford City is $15,888, while median incomes of families and households are $43,162 and $42,826 respectively.
| Characteristic | Number | Measure |
| Per Capita Income | 4,357 | $15,888 |
| Median Family Income | 943 | $43,162 |
| Mean Family Income | 943 | $56,904 |
| Median Household Income | 1,258 | $42,826 |
| Mean Household Income | 1,258 | $53,626 |
| Income Deficit | 943 | $0 |
| Wage / Income Gap (%) | 4,357 | 20.06% |
| Wage / Income Gap ($) | 4,357 | 79.94¢ per $1 |
| Gini / Inequality Index | 4,357 | 0.44 |
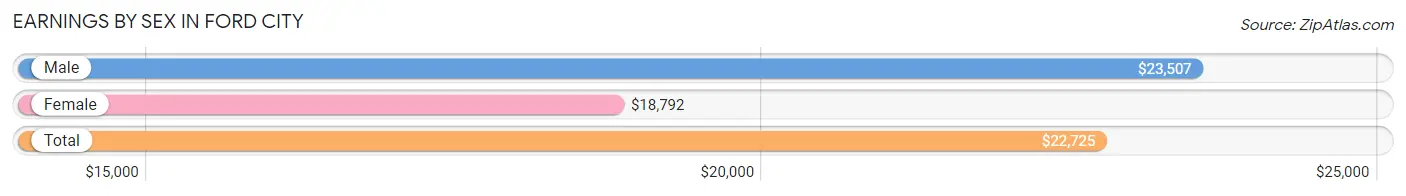
Earnings by Sex in Ford City
Average Earnings in Ford City are $22,725, $23,507 for men and $18,792 for women, a difference of 20.1%.
| Sex | Number | Average Earnings |
| Male | 1,146 (61.6%) | $23,507 |
| Female | 716 (38.5%) | $18,792 |
| Total | 1,862 (100.0%) | $22,725 |
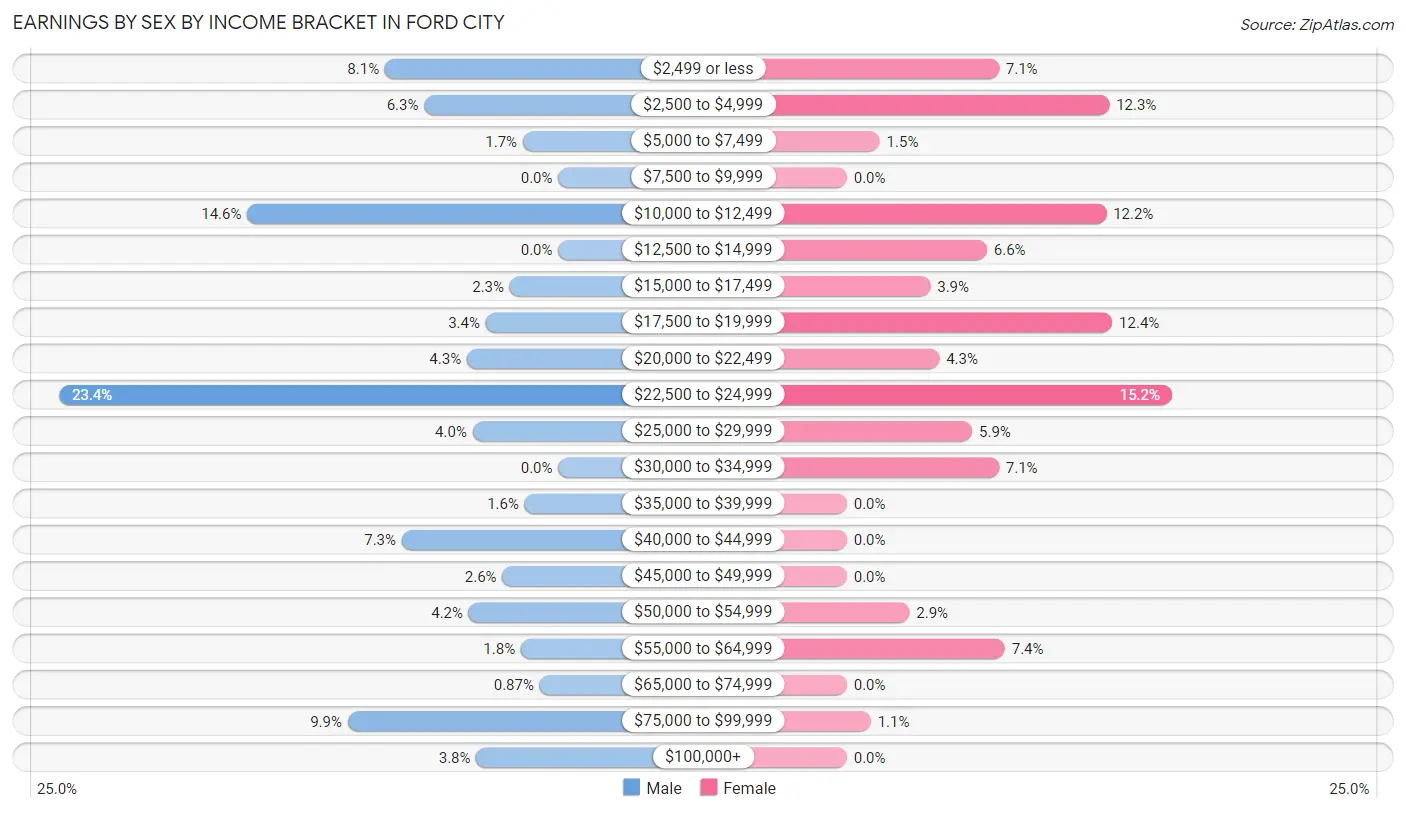
Earnings by Sex by Income Bracket in Ford City
The most common earnings brackets in Ford City are $22,500 to $24,999 for men (268 | 23.4%) and $22,500 to $24,999 for women (109 | 15.2%).
| Income | Male | Female |
| $2,499 or less | 93 (8.1%) | 51 (7.1%) |
| $2,500 to $4,999 | 72 (6.3%) | 88 (12.3%) |
| $5,000 to $7,499 | 19 (1.7%) | 11 (1.5%) |
| $7,500 to $9,999 | 0 (0.0%) | 0 (0.0%) |
| $10,000 to $12,499 | 167 (14.6%) | 87 (12.1%) |
| $12,500 to $14,999 | 0 (0.0%) | 47 (6.6%) |
| $15,000 to $17,499 | 26 (2.3%) | 28 (3.9%) |
| $17,500 to $19,999 | 39 (3.4%) | 89 (12.4%) |
| $20,000 to $22,499 | 49 (4.3%) | 31 (4.3%) |
| $22,500 to $24,999 | 268 (23.4%) | 109 (15.2%) |
| $25,000 to $29,999 | 46 (4.0%) | 42 (5.9%) |
| $30,000 to $34,999 | 0 (0.0%) | 51 (7.1%) |
| $35,000 to $39,999 | 18 (1.6%) | 0 (0.0%) |
| $40,000 to $44,999 | 84 (7.3%) | 0 (0.0%) |
| $45,000 to $49,999 | 30 (2.6%) | 0 (0.0%) |
| $50,000 to $54,999 | 48 (4.2%) | 21 (2.9%) |
| $55,000 to $64,999 | 20 (1.8%) | 53 (7.4%) |
| $65,000 to $74,999 | 10 (0.9%) | 0 (0.0%) |
| $75,000 to $99,999 | 113 (9.9%) | 8 (1.1%) |
| $100,000+ | 44 (3.8%) | 0 (0.0%) |
| Total | 1,146 (100.0%) | 716 (100.0%) |
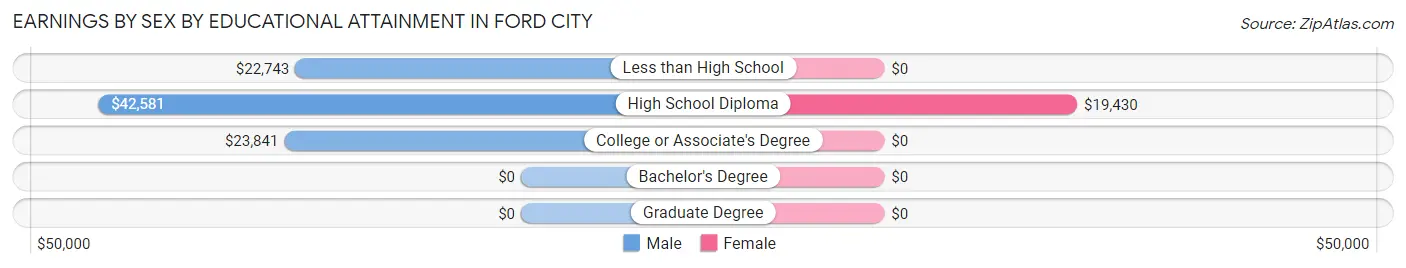
Earnings by Sex by Educational Attainment in Ford City
Average earnings in Ford City are $24,283 for men and $20,161 for women, a difference of 17.0%. Men with an educational attainment of high school diploma enjoy the highest average annual earnings of $42,581, while those with less than high school education earn the least with $22,743. Women with an educational attainment of high school diploma earn the most with the average annual earnings of $19,430, while those with high school diploma education have the smallest earnings of $19,430.
| Educational Attainment | Male Income | Female Income |
| Less than High School | $22,743 | $0 |
| High School Diploma | $42,581 | $19,430 |
| College or Associate's Degree | $23,841 | $0 |
| Bachelor's Degree | - | - |
| Graduate Degree | - | - |
| Total | $24,283 | $20,161 |
Family Income in Ford City
Family Income Brackets in Ford City
According to the Ford City family income data, there are 223 families falling into the $15,000 to $24,999 income range, which is the most common income bracket and makes up 23.6% of all families. Conversely, the $200,000+ income bracket is the least frequent group with only 16 families (1.7%) belonging to this category.
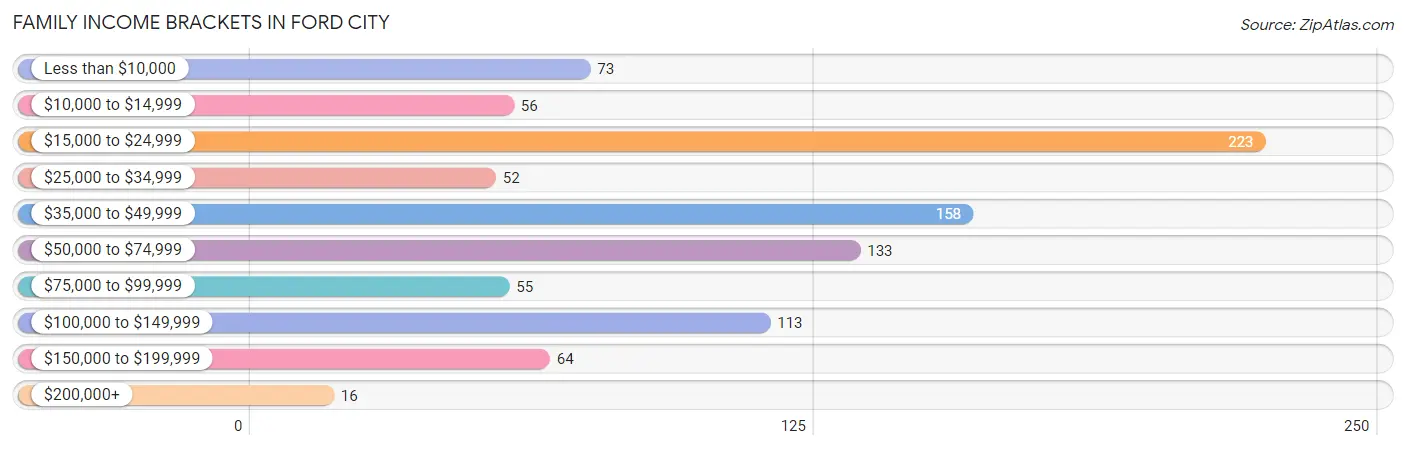
| Income Bracket | # Families | % Families |
| Less than $10,000 | 73 | 7.7% |
| $10,000 to $14,999 | 56 | 5.9% |
| $15,000 to $24,999 | 223 | 23.6% |
| $25,000 to $34,999 | 52 | 5.5% |
| $35,000 to $49,999 | 158 | 16.8% |
| $50,000 to $74,999 | 133 | 14.1% |
| $75,000 to $99,999 | 55 | 5.8% |
| $100,000 to $149,999 | 113 | 12.0% |
| $150,000 to $199,999 | 64 | 6.8% |
| $200,000+ | 16 | 1.7% |
Family Income by Famaliy Size in Ford City
5-person families (122 | 12.9%) account for the highest median family income in Ford City with $44,375 per family, while 2-person families (284 | 30.1%) have the highest median income of $21,382 per family member.
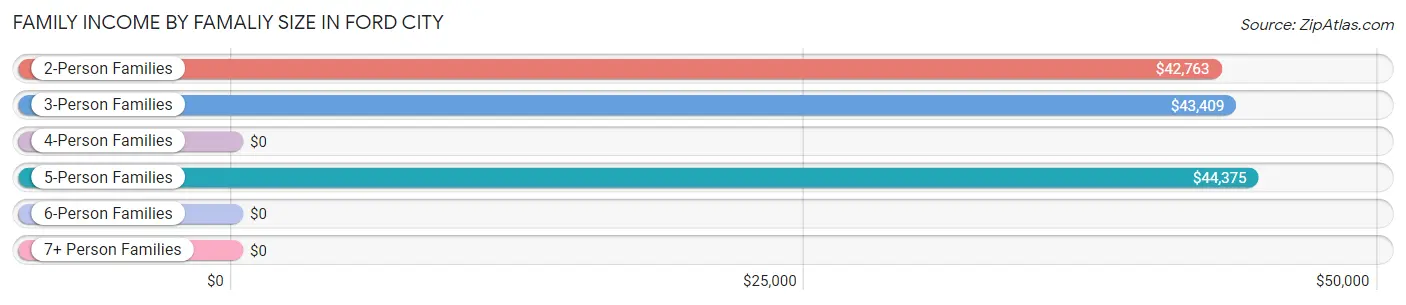
| Income Bracket | # Families | Median Income |
| 2-Person Families | 284 (30.1%) | $42,763 |
| 3-Person Families | 208 (22.1%) | $43,409 |
| 4-Person Families | 257 (27.3%) | $0 |
| 5-Person Families | 122 (12.9%) | $44,375 |
| 6-Person Families | 41 (4.3%) | $0 |
| 7+ Person Families | 31 (3.3%) | $0 |
| Total | 943 (100.0%) | $43,162 |
Family Income by Number of Earners in Ford City
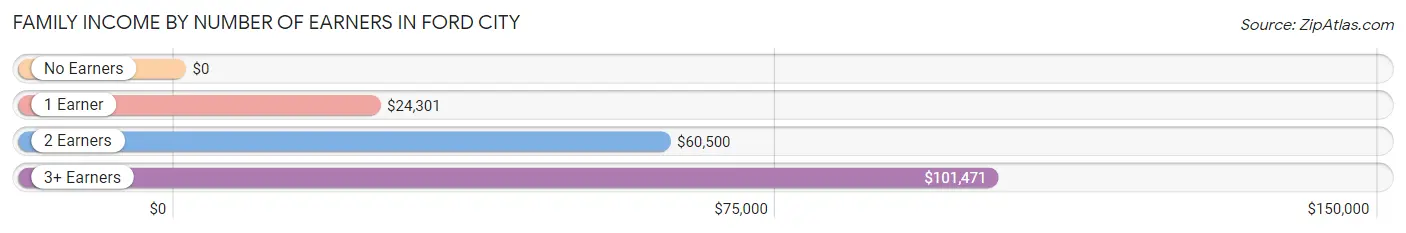
| Number of Earners | # Families | Median Income |
| No Earners | 164 (17.4%) | $0 |
| 1 Earner | 485 (51.4%) | $24,301 |
| 2 Earners | 202 (21.4%) | $60,500 |
| 3+ Earners | 92 (9.8%) | $101,471 |
| Total | 943 (100.0%) | $43,162 |
Household Income in Ford City
Household Income Brackets in Ford City
With 294 households falling in the category, the $35,000 to $49,999 income range is the most frequent in Ford City, accounting for 23.4% of all households. In contrast, only 16 households (1.3%) fall into the $200,000+ income bracket, making it the least populous group.
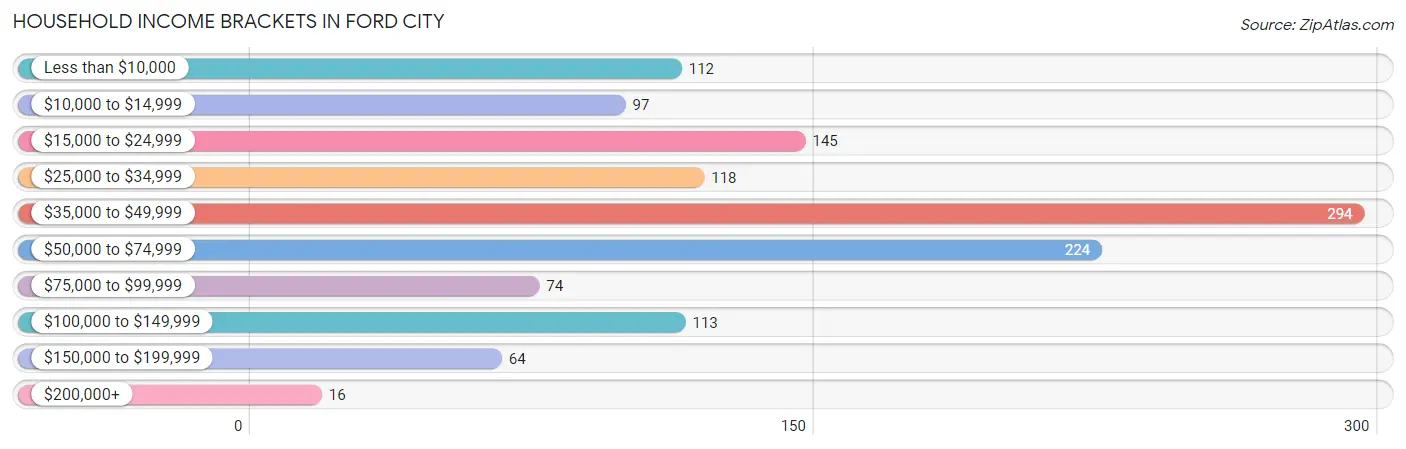
| Income Bracket | # Households | % Households |
| Less than $10,000 | 112 | 8.9% |
| $10,000 to $14,999 | 97 | 7.7% |
| $15,000 to $24,999 | 145 | 11.5% |
| $25,000 to $34,999 | 118 | 9.4% |
| $35,000 to $49,999 | 294 | 23.4% |
| $50,000 to $74,999 | 224 | 17.8% |
| $75,000 to $99,999 | 74 | 5.9% |
| $100,000 to $149,999 | 113 | 9.0% |
| $150,000 to $199,999 | 64 | 5.1% |
| $200,000+ | 16 | 1.3% |
Household Income by Householder Age in Ford City
The median household income in Ford City is $42,826, with the highest median household income of $53,015 found in the 45 to 64 years age bracket for the primary householder. A total of 363 households (28.9%) fall into this category. Meanwhile, the 15 to 24 years age bracket for the primary householder has the lowest median household income of $35,690, with 158 households (12.6%) in this group.
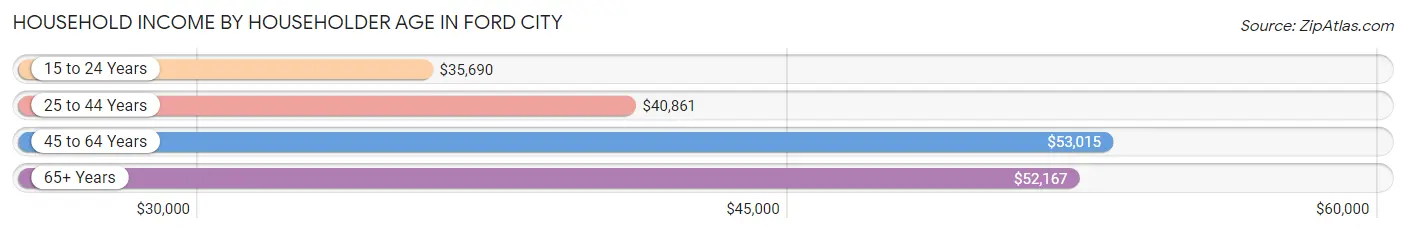
| Income Bracket | # Households | Median Income |
| 15 to 24 Years | 158 (12.6%) | $35,690 |
| 25 to 44 Years | 513 (40.8%) | $40,861 |
| 45 to 64 Years | 363 (28.9%) | $53,015 |
| 65+ Years | 224 (17.8%) | $52,167 |
| Total | 1,258 (100.0%) | $42,826 |
Poverty in Ford City
Income Below Poverty by Sex and Age in Ford City
With 38.1% poverty level for males and 45.4% for females among the residents of Ford City, under 5 year old males and 16 and 17 year old females are the most vulnerable to poverty, with 175 males (100.0%) and 63 females (100.0%) in their respective age groups living below the poverty level.
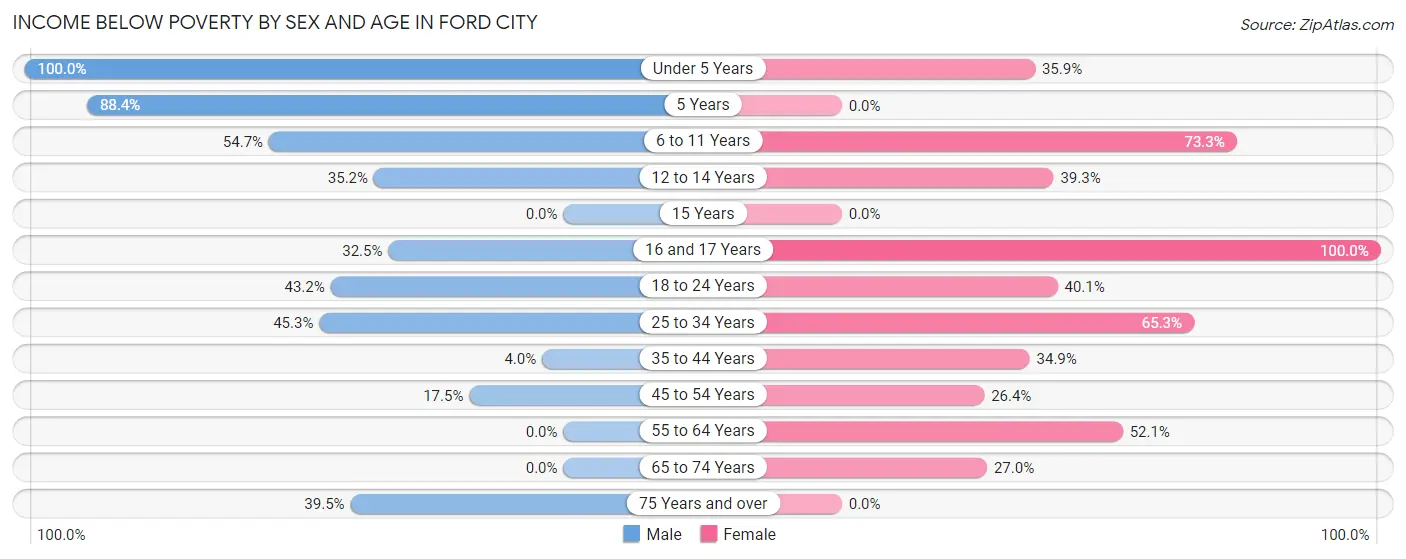
| Age Bracket | Male | Female |
| Under 5 Years | 175 (100.0%) | 71 (35.9%) |
| 5 Years | 84 (88.4%) | 0 (0.0%) |
| 6 to 11 Years | 147 (54.6%) | 159 (73.3%) |
| 12 to 14 Years | 51 (35.2%) | 33 (39.3%) |
| 15 Years | 0 (0.0%) | 0 (0.0%) |
| 16 and 17 Years | 13 (32.5%) | 63 (100.0%) |
| 18 to 24 Years | 105 (43.2%) | 173 (40.1%) |
| 25 to 34 Years | 198 (45.3%) | 230 (65.3%) |
| 35 to 44 Years | 9 (4.0%) | 76 (34.9%) |
| 45 to 54 Years | 51 (17.5%) | 60 (26.4%) |
| 55 to 64 Years | 0 (0.0%) | 61 (52.1%) |
| 65 to 74 Years | 0 (0.0%) | 38 (27.0%) |
| 75 Years and over | 17 (39.5%) | 0 (0.0%) |
| Total | 850 (38.1%) | 964 (45.4%) |
Income Above Poverty by Sex and Age in Ford City
According to the poverty statistics in Ford City, males aged 15 years and females aged 15 years are the age groups that are most secure financially, with 100.0% of males and 100.0% of females in these age groups living above the poverty line.
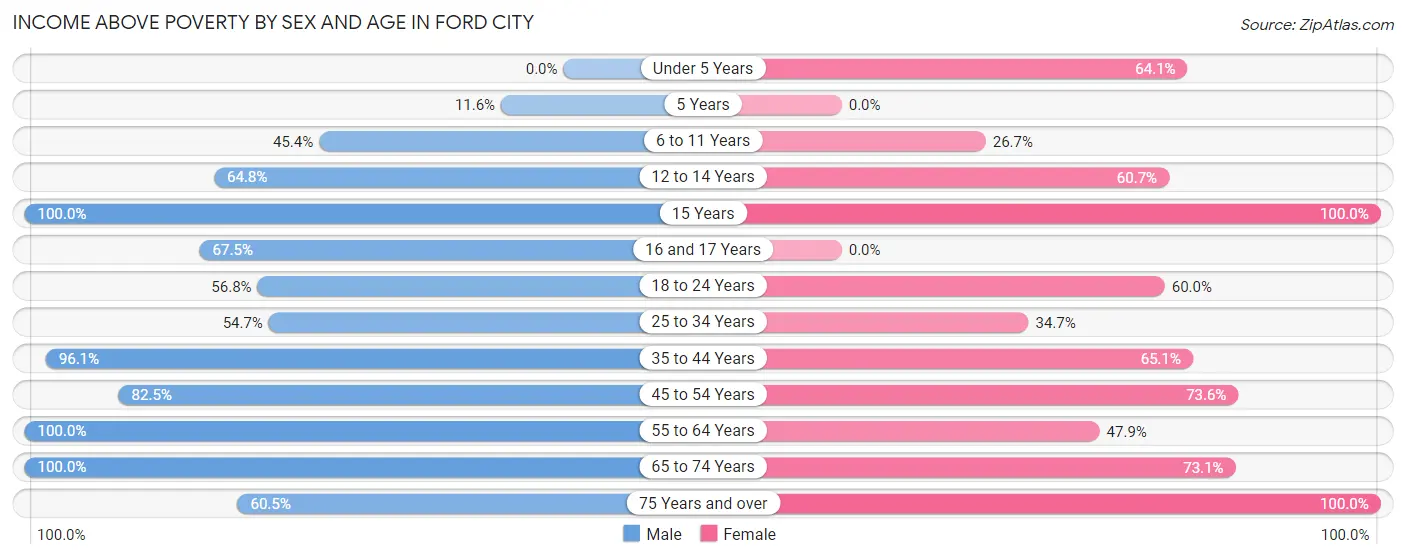
| Age Bracket | Male | Female |
| Under 5 Years | 0 (0.0%) | 127 (64.1%) |
| 5 Years | 11 (11.6%) | 0 (0.0%) |
| 6 to 11 Years | 122 (45.4%) | 58 (26.7%) |
| 12 to 14 Years | 94 (64.8%) | 51 (60.7%) |
| 15 Years | 19 (100.0%) | 43 (100.0%) |
| 16 and 17 Years | 27 (67.5%) | 0 (0.0%) |
| 18 to 24 Years | 138 (56.8%) | 259 (60.0%) |
| 25 to 34 Years | 239 (54.7%) | 122 (34.7%) |
| 35 to 44 Years | 219 (96.1%) | 142 (65.1%) |
| 45 to 54 Years | 241 (82.5%) | 167 (73.6%) |
| 55 to 64 Years | 147 (100.0%) | 56 (47.9%) |
| 65 to 74 Years | 100 (100.0%) | 103 (73.1%) |
| 75 Years and over | 26 (60.5%) | 32 (100.0%) |
| Total | 1,383 (61.9%) | 1,160 (54.6%) |
Income Below Poverty Among Married-Couple Families in Ford City
The poverty statistics for married-couple families in Ford City show that 19.7% or 106 of the total 537 families live below the poverty line. Families with 3 or 4 children have the highest poverty rate of 55.6%, comprising of 35 families. On the other hand, families with no children have the lowest poverty rate of 13.5%, which includes 34 families.
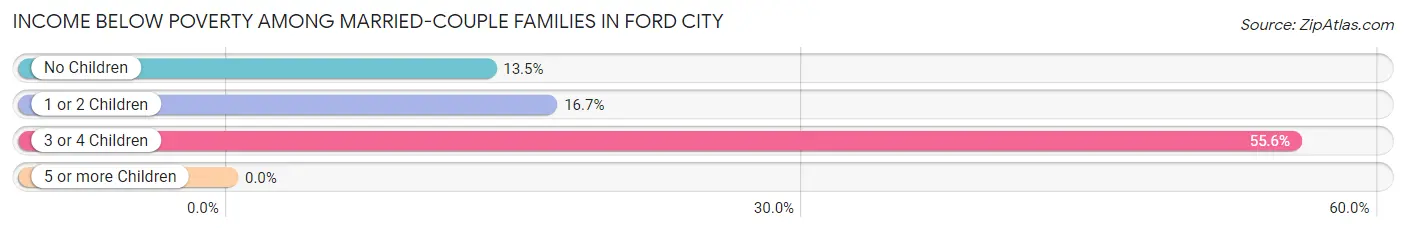
| Children | Above Poverty | Below Poverty |
| No Children | 218 (86.5%) | 34 (13.5%) |
| 1 or 2 Children | 185 (83.3%) | 37 (16.7%) |
| 3 or 4 Children | 28 (44.4%) | 35 (55.6%) |
| 5 or more Children | 0 (0.0%) | 0 (0.0%) |
| Total | 431 (80.3%) | 106 (19.7%) |
Income Below Poverty Among Single-Parent Households in Ford City
According to the poverty data in Ford City, 33.7% or 68 single-father households and 82.4% or 168 single-mother households are living below the poverty line. Among single-father households, those with 1 or 2 children have the highest poverty rate, with 68 households (47.9%) experiencing poverty. Likewise, among single-mother households, those with 3 or 4 children have the highest poverty rate, with 23 households (100.0%) falling below the poverty line.
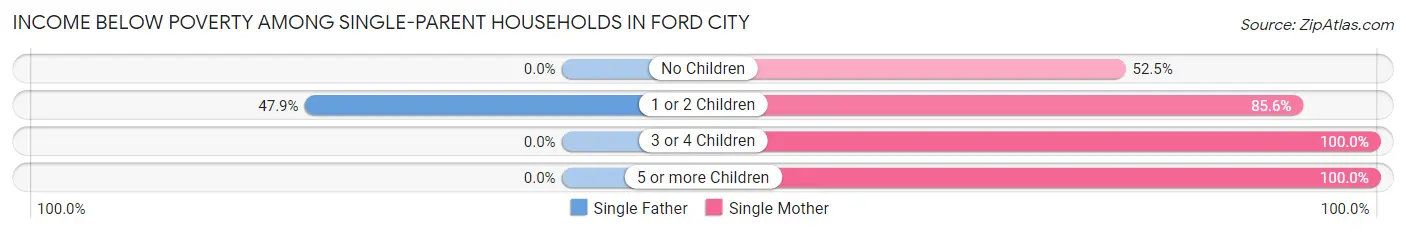
| Children | Single Father | Single Mother |
| No Children | 0 (0.0%) | 21 (52.5%) |
| 1 or 2 Children | 68 (47.9%) | 101 (85.6%) |
| 3 or 4 Children | 0 (0.0%) | 23 (100.0%) |
| 5 or more Children | 0 (0.0%) | 23 (100.0%) |
| Total | 68 (33.7%) | 168 (82.4%) |
Income Below Poverty Among Married-Couple vs Single-Parent Households in Ford City
The poverty data for Ford City shows that 106 of the married-couple family households (19.7%) and 236 of the single-parent households (58.1%) are living below the poverty level. Within the married-couple family households, those with 3 or 4 children have the highest poverty rate, with 35 households (55.6%) falling below the poverty line. Among the single-parent households, those with 3 or 4 children have the highest poverty rate, with 23 household (100.0%) living below poverty.
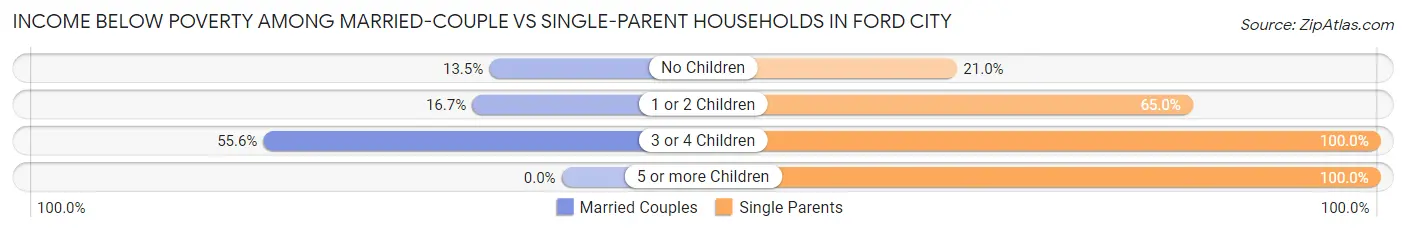
| Children | Married-Couple Families | Single-Parent Households |
| No Children | 34 (13.5%) | 21 (21.0%) |
| 1 or 2 Children | 37 (16.7%) | 169 (65.0%) |
| 3 or 4 Children | 35 (55.6%) | 23 (100.0%) |
| 5 or more Children | 0 (0.0%) | 23 (100.0%) |
| Total | 106 (19.7%) | 236 (58.1%) |
Race in Ford City
The most populous races in Ford City are White / Caucasian (2,788 | 64.0%), Hispanic or Latino (2,193 | 50.3%), and Some other Race (868 | 19.9%).
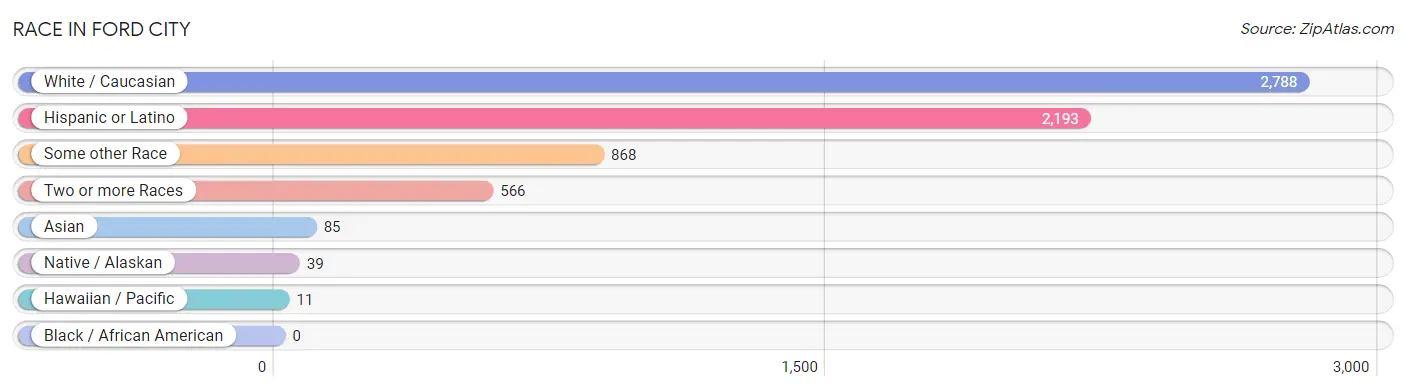
| Race | # Population | % Population |
| Asian | 85 | 1.9% |
| Black / African American | 0 | 0.0% |
| Hawaiian / Pacific | 11 | 0.3% |
| Hispanic or Latino | 2,193 | 50.3% |
| Native / Alaskan | 39 | 0.9% |
| White / Caucasian | 2,788 | 64.0% |
| Two or more Races | 566 | 13.0% |
| Some other Race | 868 | 19.9% |
| Total | 4,357 | 100.0% |
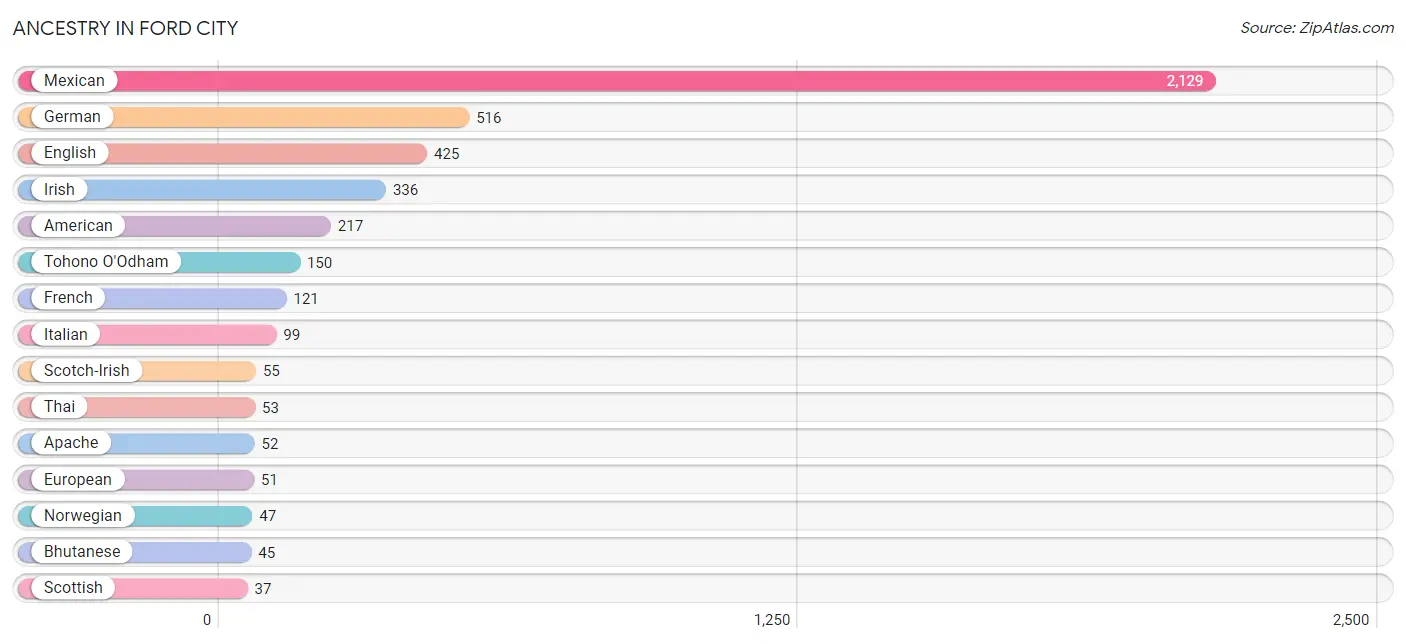
Ancestry in Ford City
The most populous ancestries reported in Ford City are Mexican (2,129 | 48.9%), German (516 | 11.8%), English (425 | 9.8%), Irish (336 | 7.7%), and American (217 | 5.0%), together accounting for 83.1% of all Ford City residents.
| Ancestry | # Population | % Population |
| American | 217 | 5.0% |
| Apache | 52 | 1.2% |
| Argentinean | 12 | 0.3% |
| Armenian | 6 | 0.1% |
| Bhutanese | 45 | 1.0% |
| Burmese | 5 | 0.1% |
| Central American Indian | 17 | 0.4% |
| Cherokee | 15 | 0.3% |
| Choctaw | 12 | 0.3% |
| Dutch | 15 | 0.3% |
| Eastern European | 15 | 0.3% |
| English | 425 | 9.8% |
| European | 51 | 1.2% |
| French | 121 | 2.8% |
| French Canadian | 8 | 0.2% |
| German | 516 | 11.8% |
| Indian (Asian) | 27 | 0.6% |
| Irish | 336 | 7.7% |
| Italian | 99 | 2.3% |
| Korean | 25 | 0.6% |
| Mexican | 2,129 | 48.9% |
| Mexican American Indian | 17 | 0.4% |
| Norwegian | 47 | 1.1% |
| Polish | 16 | 0.4% |
| Samoan | 11 | 0.3% |
| Scotch-Irish | 55 | 1.3% |
| Scottish | 37 | 0.9% |
| South American | 12 | 0.3% |
| Swedish | 35 | 0.8% |
| Thai | 53 | 1.2% |
| Tohono O'Odham | 150 | 3.4% |
| Welsh | 12 | 0.3% | View All 32 Rows |
Immigrants in Ford City
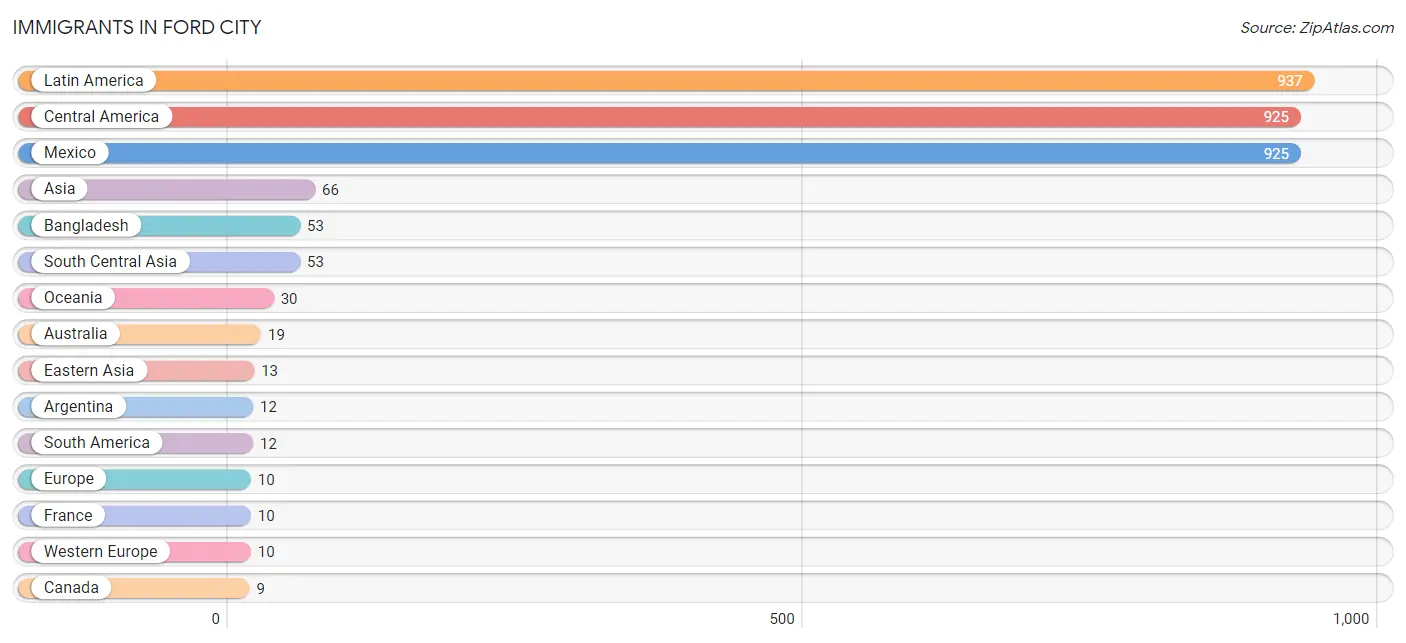
The most numerous immigrant groups reported in Ford City came from Latin America (937 | 21.5%), Central America (925 | 21.2%), Mexico (925 | 21.2%), Asia (66 | 1.5%), and Bangladesh (53 | 1.2%), together accounting for 66.7% of all Ford City residents.
| Immigration Origin | # Population | % Population |
| Argentina | 12 | 0.3% |
| Asia | 66 | 1.5% |
| Australia | 19 | 0.4% |
| Bangladesh | 53 | 1.2% |
| Canada | 9 | 0.2% |
| Central America | 925 | 21.2% |
| China | 8 | 0.2% |
| Eastern Asia | 13 | 0.3% |
| Europe | 10 | 0.2% |
| France | 10 | 0.2% |
| Korea | 5 | 0.1% |
| Latin America | 937 | 21.5% |
| Mexico | 925 | 21.2% |
| Oceania | 30 | 0.7% |
| South America | 12 | 0.3% |
| South Central Asia | 53 | 1.2% |
| Western Europe | 10 | 0.2% | View All 17 Rows |
Sex and Age in Ford City
Sex and Age in Ford City
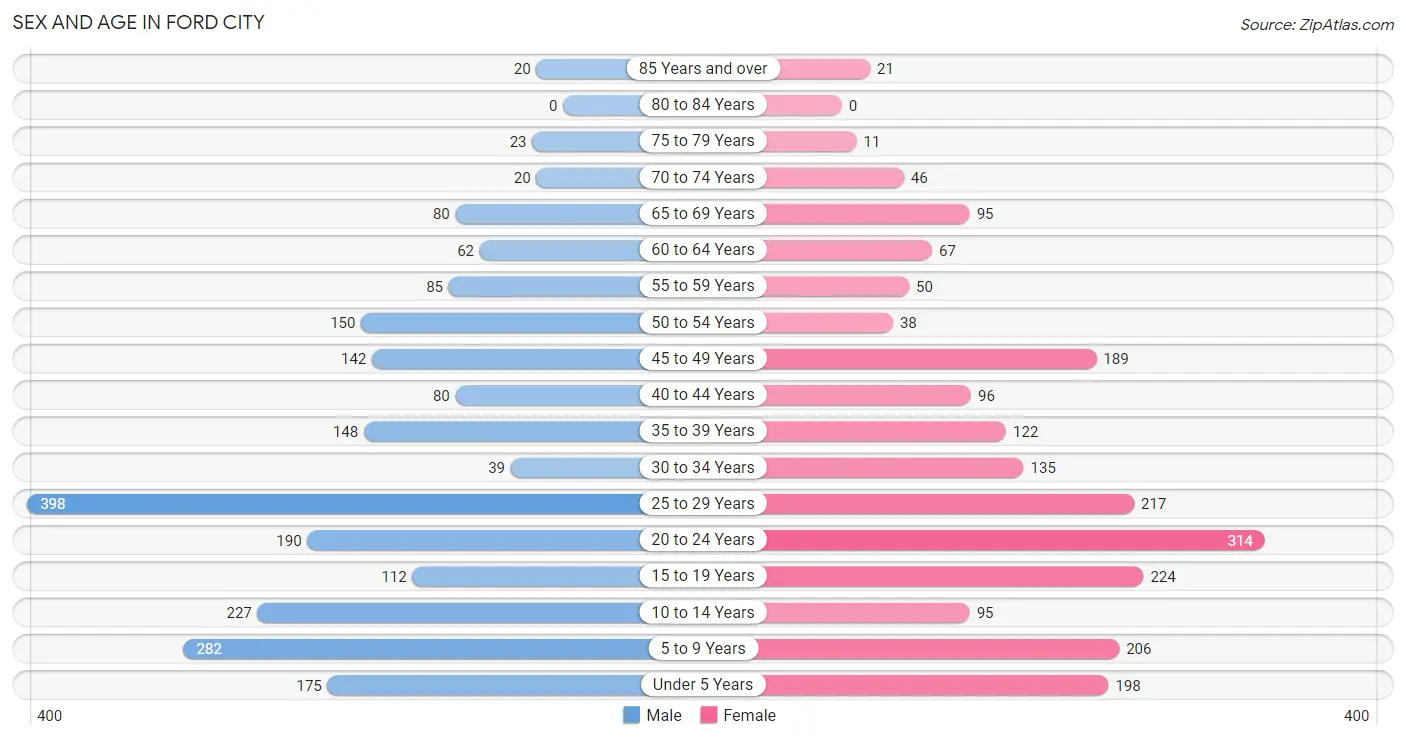
The most populous age groups in Ford City are 25 to 29 Years (398 | 17.8%) for men and 20 to 24 Years (314 | 14.8%) for women.
| Age Bracket | Male | Female |
| Under 5 Years | 175 (7.8%) | 198 (9.3%) |
| 5 to 9 Years | 282 (12.6%) | 206 (9.7%) |
| 10 to 14 Years | 227 (10.2%) | 95 (4.5%) |
| 15 to 19 Years | 112 (5.0%) | 224 (10.5%) |
| 20 to 24 Years | 190 (8.5%) | 314 (14.8%) |
| 25 to 29 Years | 398 (17.8%) | 217 (10.2%) |
| 30 to 34 Years | 39 (1.8%) | 135 (6.4%) |
| 35 to 39 Years | 148 (6.6%) | 122 (5.7%) |
| 40 to 44 Years | 80 (3.6%) | 96 (4.5%) |
| 45 to 49 Years | 142 (6.4%) | 189 (8.9%) |
| 50 to 54 Years | 150 (6.7%) | 38 (1.8%) |
| 55 to 59 Years | 85 (3.8%) | 50 (2.4%) |
| 60 to 64 Years | 62 (2.8%) | 67 (3.2%) |
| 65 to 69 Years | 80 (3.6%) | 95 (4.5%) |
| 70 to 74 Years | 20 (0.9%) | 46 (2.2%) |
| 75 to 79 Years | 23 (1.0%) | 11 (0.5%) |
| 80 to 84 Years | 0 (0.0%) | 0 (0.0%) |
| 85 Years and over | 20 (0.9%) | 21 (1.0%) |
| Total | 2,233 (100.0%) | 2,124 (100.0%) |
Families and Households in Ford City
Median Family Size in Ford City
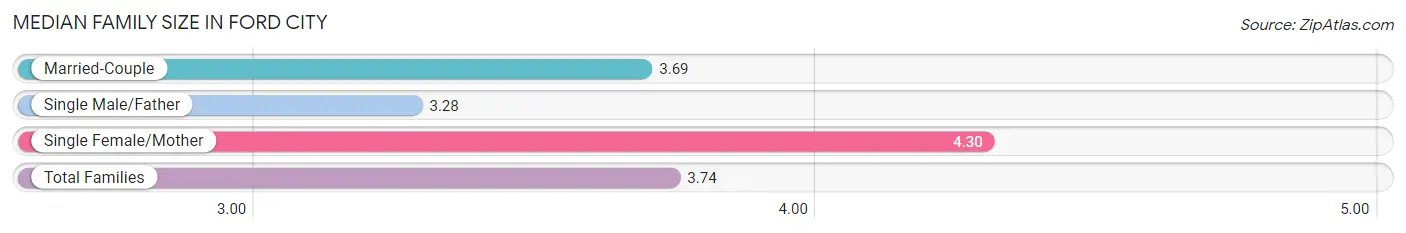
The median family size in Ford City is 3.74 persons per family, with single female/mother families (204 | 21.6%) accounting for the largest median family size of 4.3 persons per family. On the other hand, single male/father families (202 | 21.4%) represent the smallest median family size with 3.28 persons per family.
| Family Type | # Families | Family Size |
| Married-Couple | 537 (57.0%) | 3.69 |
| Single Male/Father | 202 (21.4%) | 3.28 |
| Single Female/Mother | 204 (21.6%) | 4.30 |
| Total Families | 943 (100.0%) | 3.74 |
Median Household Size in Ford City
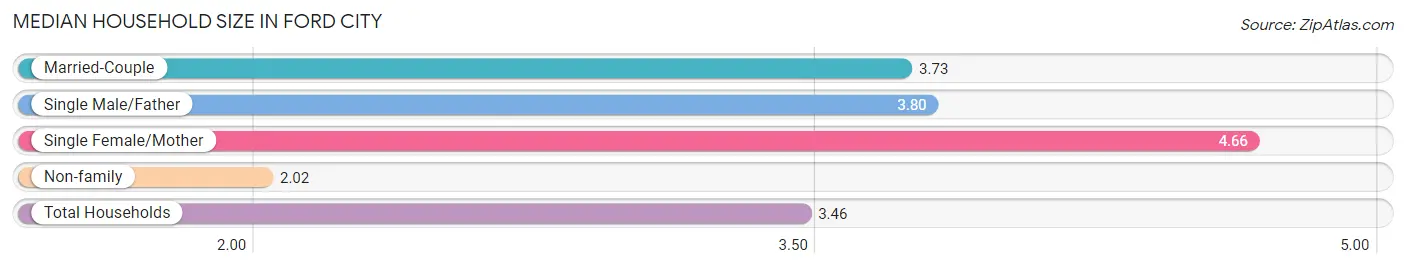
The median household size in Ford City is 3.46 persons per household, with single female/mother households (204 | 16.2%) accounting for the largest median household size of 4.66 persons per household. non-family households (315 | 25.0%) represent the smallest median household size with 2.02 persons per household.
| Household Type | # Households | Household Size |
| Married-Couple | 537 (42.7%) | 3.73 |
| Single Male/Father | 202 (16.1%) | 3.80 |
| Single Female/Mother | 204 (16.2%) | 4.66 |
| Non-family | 315 (25.0%) | 2.02 |
| Total Households | 1,258 (100.0%) | 3.46 |
Household Size by Marriage Status in Ford City
Out of a total of 1,258 households in Ford City, 943 (75.0%) are family households, while 315 (25.0%) are nonfamily households. The most numerous type of family households are 4-person households, comprising 318, and the most common type of nonfamily households are 1-person households, comprising 217.
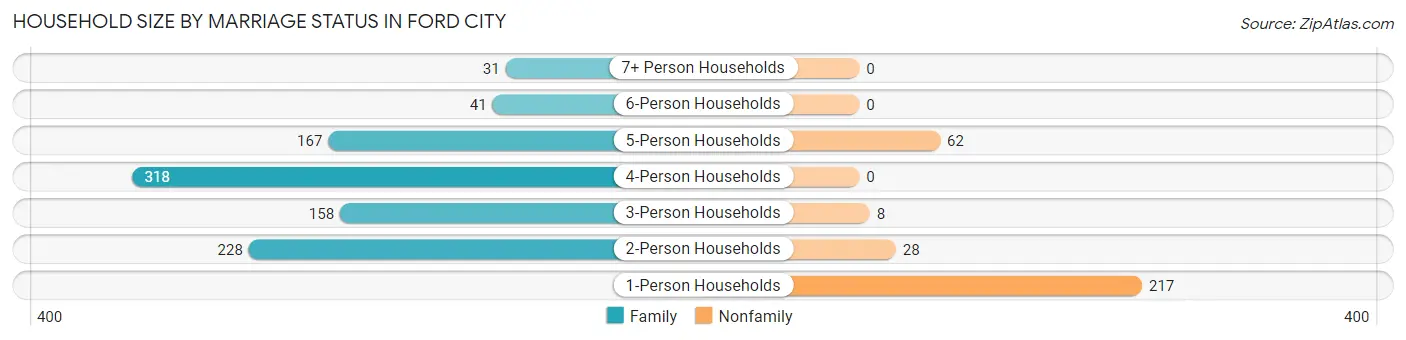
| Household Size | Family Households | Nonfamily Households |
| 1-Person Households | - | 217 (17.2%) |
| 2-Person Households | 228 (18.1%) | 28 (2.2%) |
| 3-Person Households | 158 (12.6%) | 8 (0.6%) |
| 4-Person Households | 318 (25.3%) | 0 (0.0%) |
| 5-Person Households | 167 (13.3%) | 62 (4.9%) |
| 6-Person Households | 41 (3.3%) | 0 (0.0%) |
| 7+ Person Households | 31 (2.5%) | 0 (0.0%) |
| Total | 943 (75.0%) | 315 (25.0%) |
Female Fertility in Ford City
Fertility by Age in Ford City
Average fertility rate in Ford City is 45.0 births per 1,000 women. Women in the age bracket of 35 to 50 years have the highest fertility rate with 60.0 births per 1,000 women. Women in the age bracket of 20 to 34 years acount for 57.6% of all women with births.
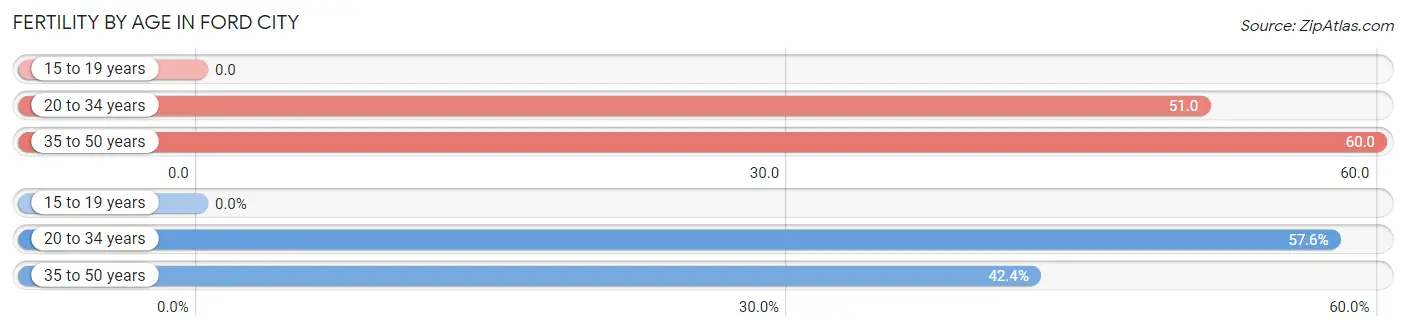
| Age Bracket | Women with Births | Births / 1,000 Women |
| 15 to 19 years | 0 (0.0%) | 0.0 |
| 20 to 34 years | 34 (57.6%) | 51.0 |
| 35 to 50 years | 25 (42.4%) | 60.0 |
| Total | 59 (100.0%) | 45.0 |
Fertility by Age by Marriage Status in Ford City
42.4% of women with births (59) in Ford City are married. The highest percentage of unmarried women with births falls into 20 to 34 years age bracket with 100.0% of them unmarried at the time of birth, while the lowest percentage of unmarried women with births belong to 35 to 50 years age bracket with 0.0% of them unmarried.
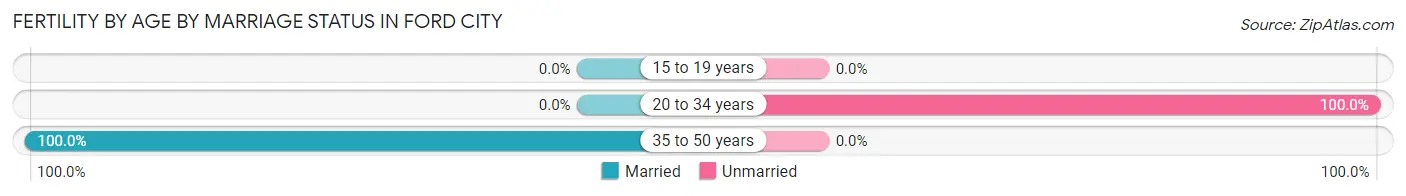
| Age Bracket | Married | Unmarried |
| 15 to 19 years | 0 (0.0%) | 0 (0.0%) |
| 20 to 34 years | 0 (0.0%) | 34 (100.0%) |
| 35 to 50 years | 25 (100.0%) | 0 (0.0%) |
| Total | 25 (42.4%) | 34 (57.6%) |
Fertility by Education in Ford City
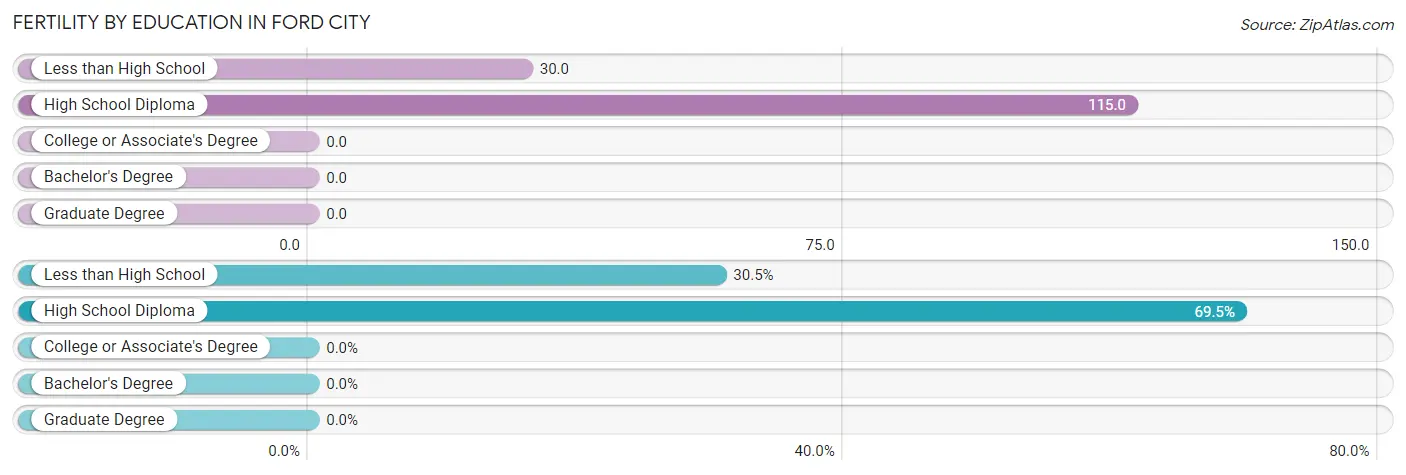
| Educational Attainment | Women with Births | Births / 1,000 Women |
| Less than High School | 18 (30.5%) | 30.0 |
| High School Diploma | 41 (69.5%) | 115.0 |
| College or Associate's Degree | 0 (0.0%) | 0.0 |
| Bachelor's Degree | 0 (0.0%) | 0.0 |
| Graduate Degree | 0 (0.0%) | 0.0 |
| Total | 59 (100.0%) | 45.0 |
Fertility by Education by Marriage Status in Ford City
57.6% of women with births in Ford City are unmarried. Women with the educational attainment of less than high school are most likely to be married with 100.0% of them married at childbirth, while women with the educational attainment of high school diploma are least likely to be married with 82.9% of them unmarried at childbirth.
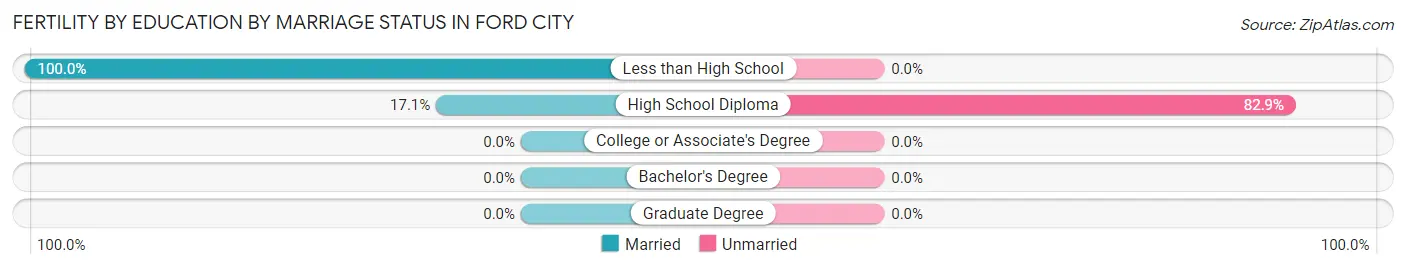
| Educational Attainment | Married | Unmarried |
| Less than High School | 18 (100.0%) | 0 (0.0%) |
| High School Diploma | 7 (17.1%) | 34 (82.9%) |
| College or Associate's Degree | 0 (0.0%) | 0 (0.0%) |
| Bachelor's Degree | 0 (0.0%) | 0 (0.0%) |
| Graduate Degree | 0 (0.0%) | 0 (0.0%) |
| Total | 25 (42.4%) | 34 (57.6%) |
Employment Characteristics in Ford City
Employment by Class of Employer in Ford City
Among the 1,513 employed individuals in Ford City, private company employees (1,222 | 80.8%), state government employees (113 | 7.5%), and local government employees (68 | 4.5%) make up the most common classes of employment.
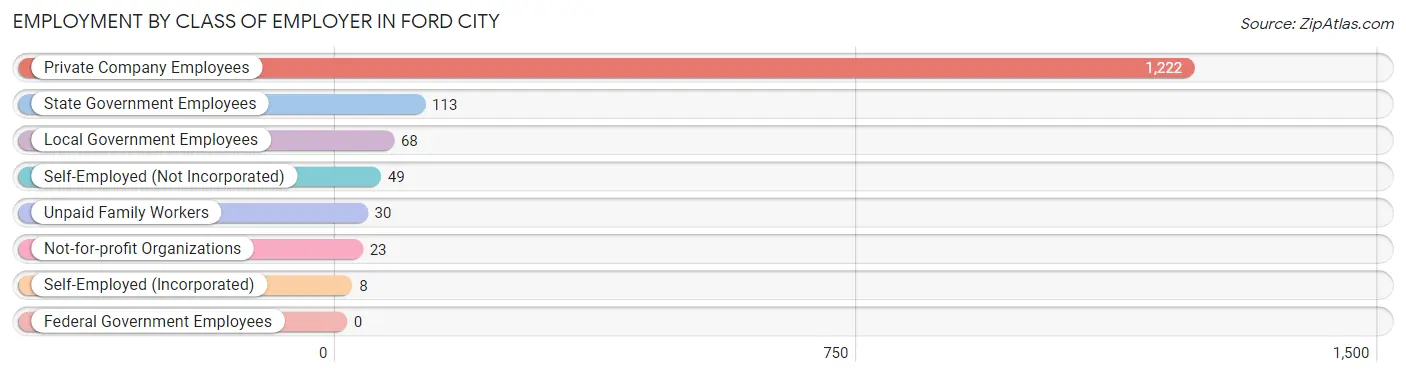
| Employer Class | # Employees | % Employees |
| Private Company Employees | 1,222 | 80.8% |
| Self-Employed (Incorporated) | 8 | 0.5% |
| Self-Employed (Not Incorporated) | 49 | 3.2% |
| Not-for-profit Organizations | 23 | 1.5% |
| Local Government Employees | 68 | 4.5% |
| State Government Employees | 113 | 7.5% |
| Federal Government Employees | 0 | 0.0% |
| Unpaid Family Workers | 30 | 2.0% |
| Total | 1,513 | 100.0% |
Employment Status by Age in Ford City
According to the labor force statistics for Ford City, out of the total population over 16 years of age (3,112), 61.4% or 1,911 individuals are in the labor force, with 20.8% or 397 of them unemployed. The age group with the highest labor force participation rate is 25 to 29 years, with 94.1% or 579 individuals in the labor force. Within the labor force, the 25 to 29 years age range has the highest percentage of unemployed individuals, with 48.2% or 279 of them being unemployed.
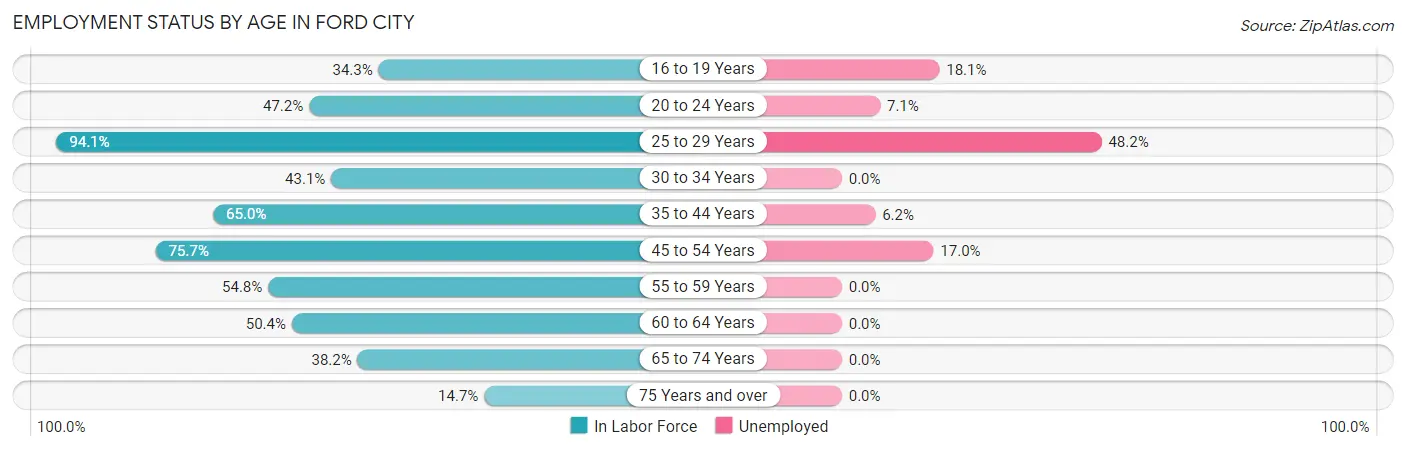
| Age Bracket | In Labor Force | Unemployed |
| 16 to 19 Years | 94 (34.3%) | 17 (18.1%) |
| 20 to 24 Years | 238 (47.2%) | 17 (7.1%) |
| 25 to 29 Years | 579 (94.1%) | 279 (48.2%) |
| 30 to 34 Years | 75 (43.1%) | 0 (0.0%) |
| 35 to 44 Years | 290 (65.0%) | 18 (6.2%) |
| 45 to 54 Years | 393 (75.7%) | 67 (17.0%) |
| 55 to 59 Years | 74 (54.8%) | 0 (0.0%) |
| 60 to 64 Years | 65 (50.4%) | 0 (0.0%) |
| 65 to 74 Years | 92 (38.2%) | 0 (0.0%) |
| 75 Years and over | 11 (14.7%) | 0 (0.0%) |
| Total | 1,911 (61.4%) | 397 (20.8%) |
Employment Status by Educational Attainment in Ford City
According to labor force statistics for Ford City, 73.1% of individuals (1,475) out of the total population between 25 and 64 years of age (2,018) are in the labor force, with 24.7% or 364 of them being unemployed. The group with the highest labor force participation rate are those with the educational attainment of less than high school, with 74.8% or 627 individuals in the labor force. Within the labor force, individuals with less than high school education have the highest percentage of unemployment, with 38.3% or 240 of them being unemployed.
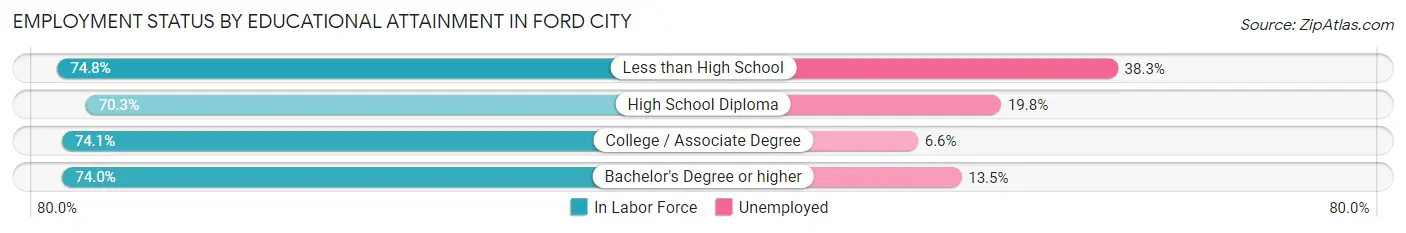
| Educational Attainment | In Labor Force | Unemployed |
| Less than High School | 627 (74.8%) | 321 (38.3%) |
| High School Diploma | 474 (70.3%) | 133 (19.8%) |
| College / Associate Degree | 301 (74.1%) | 27 (6.6%) |
| Bachelor's Degree or higher | 74 (74.0%) | 14 (13.5%) |
| Total | 1,475 (73.1%) | 498 (24.7%) |
Employment Occupations by Sex in Ford City
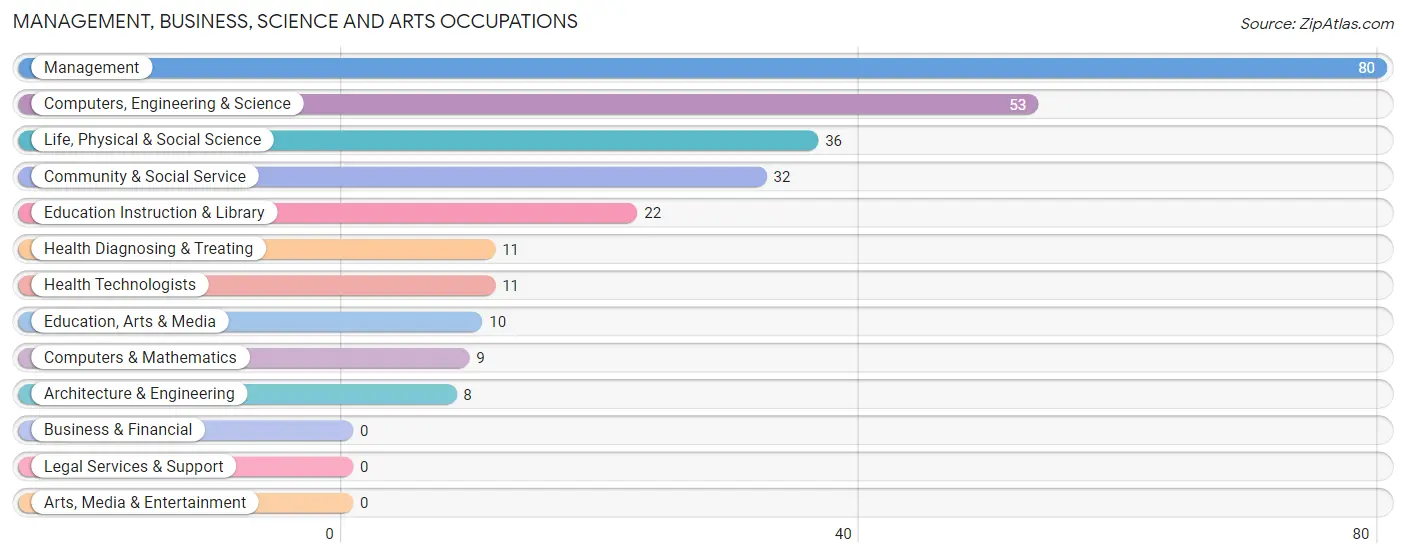
Management, Business, Science and Arts Occupations
The most common Management, Business, Science and Arts occupations in Ford City are Management (80 | 5.3%), Computers, Engineering & Science (53 | 3.5%), Life, Physical & Social Science (36 | 2.4%), Community & Social Service (32 | 2.1%), and Education Instruction & Library (22 | 1.5%).
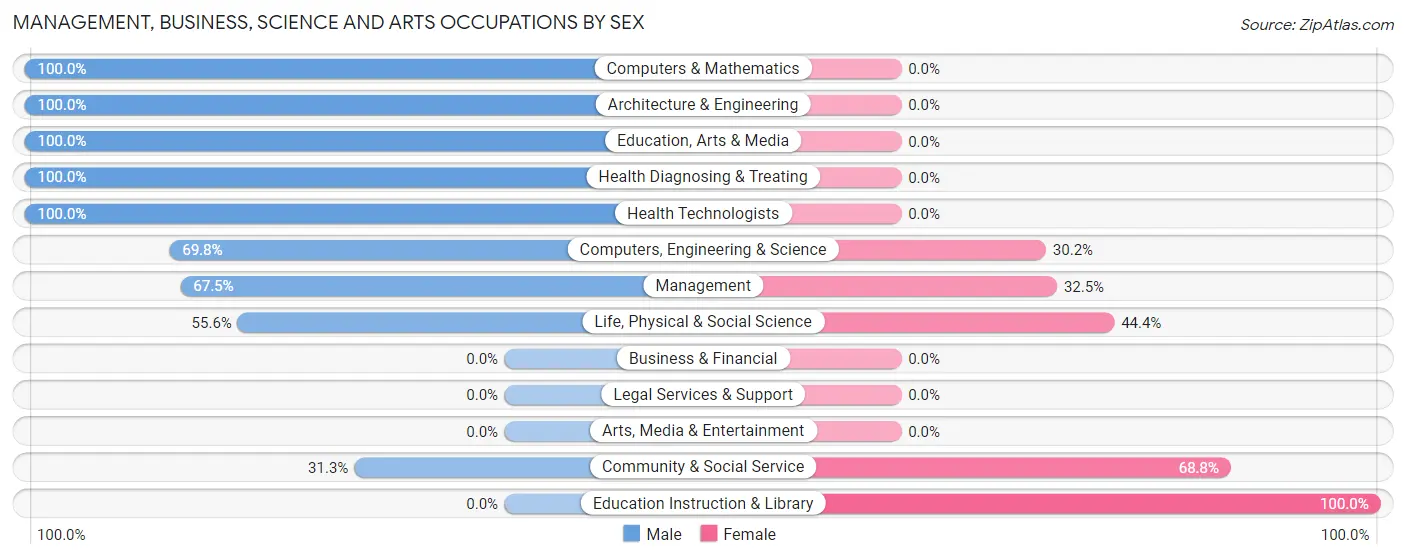
Management, Business, Science and Arts Occupations by Sex
Within the Management, Business, Science and Arts occupations in Ford City, the most male-oriented occupations are Computers & Mathematics (100.0%), Architecture & Engineering (100.0%), and Education, Arts & Media (100.0%), while the most female-oriented occupations are Education Instruction & Library (100.0%), Community & Social Service (68.8%), and Life, Physical & Social Science (44.4%).
| Occupation | Male | Female |
| Management | 54 (67.5%) | 26 (32.5%) |
| Business & Financial | 0 (0.0%) | 0 (0.0%) |
| Computers, Engineering & Science | 37 (69.8%) | 16 (30.2%) |
| Computers & Mathematics | 9 (100.0%) | 0 (0.0%) |
| Architecture & Engineering | 8 (100.0%) | 0 (0.0%) |
| Life, Physical & Social Science | 20 (55.6%) | 16 (44.4%) |
| Community & Social Service | 10 (31.2%) | 22 (68.8%) |
| Education, Arts & Media | 10 (100.0%) | 0 (0.0%) |
| Legal Services & Support | 0 (0.0%) | 0 (0.0%) |
| Education Instruction & Library | 0 (0.0%) | 22 (100.0%) |
| Arts, Media & Entertainment | 0 (0.0%) | 0 (0.0%) |
| Health Diagnosing & Treating | 11 (100.0%) | 0 (0.0%) |
| Health Technologists | 11 (100.0%) | 0 (0.0%) |
| Total (Category) | 112 (63.6%) | 64 (36.4%) |
| Total (Overall) | 936 (61.9%) | 577 (38.1%) |
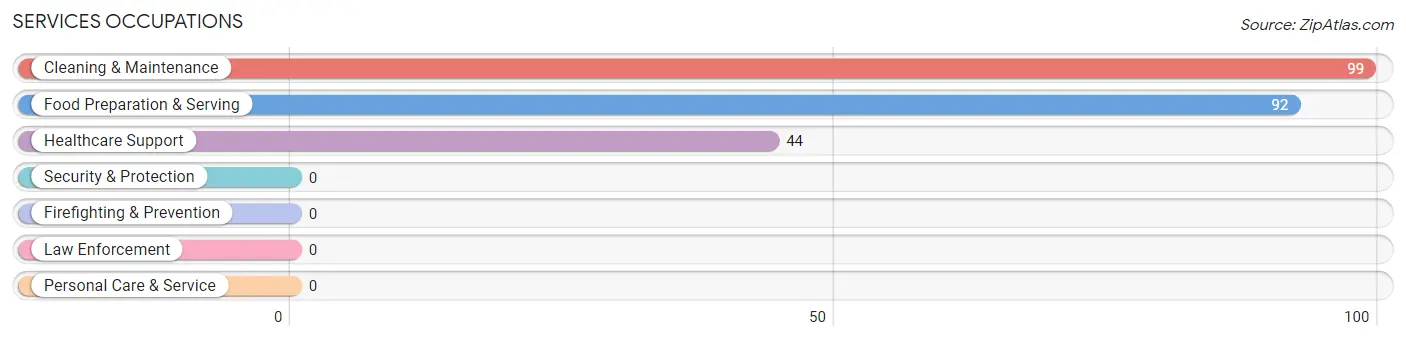
Services Occupations
The most common Services occupations in Ford City are Cleaning & Maintenance (99 | 6.5%), Food Preparation & Serving (92 | 6.1%), and Healthcare Support (44 | 2.9%).
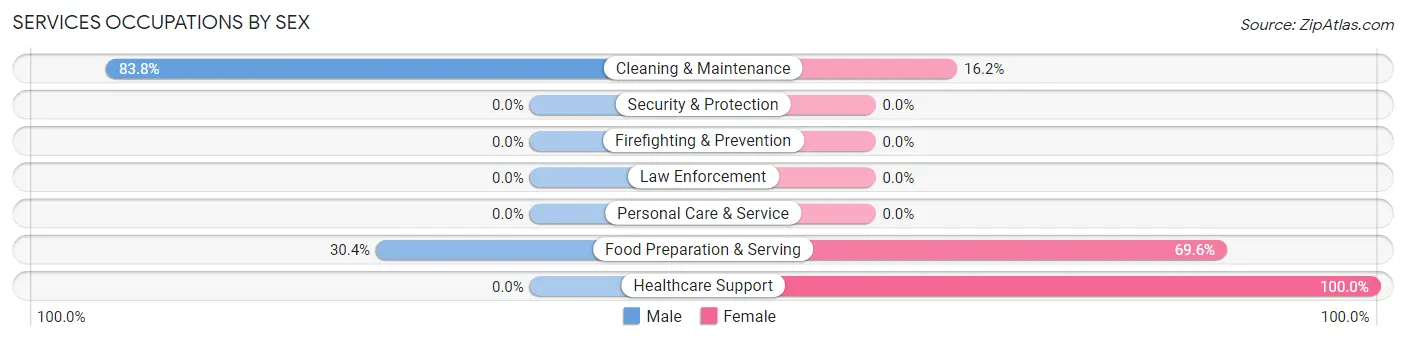
Services Occupations by Sex
Within the Services occupations in Ford City, the most male-oriented occupations are Cleaning & Maintenance (83.8%), and Food Preparation & Serving (30.4%), while the most female-oriented occupations are Healthcare Support (100.0%), Food Preparation & Serving (69.6%), and Cleaning & Maintenance (16.2%).
| Occupation | Male | Female |
| Healthcare Support | 0 (0.0%) | 44 (100.0%) |
| Security & Protection | 0 (0.0%) | 0 (0.0%) |
| Firefighting & Prevention | 0 (0.0%) | 0 (0.0%) |
| Law Enforcement | 0 (0.0%) | 0 (0.0%) |
| Food Preparation & Serving | 28 (30.4%) | 64 (69.6%) |
| Cleaning & Maintenance | 83 (83.8%) | 16 (16.2%) |
| Personal Care & Service | 0 (0.0%) | 0 (0.0%) |
| Total (Category) | 111 (47.2%) | 124 (52.8%) |
| Total (Overall) | 936 (61.9%) | 577 (38.1%) |
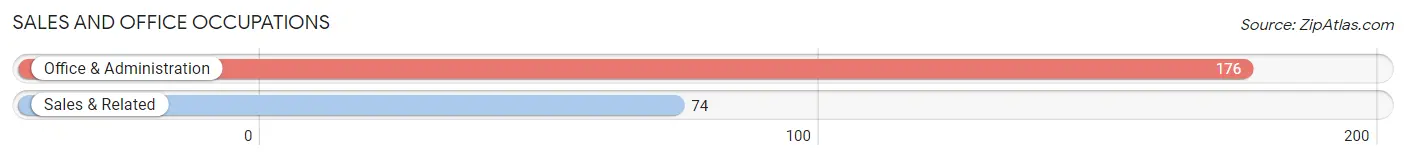
Sales and Office Occupations
The most common Sales and Office occupations in Ford City are Office & Administration (176 | 11.6%), and Sales & Related (74 | 4.9%).
Sales and Office Occupations by Sex
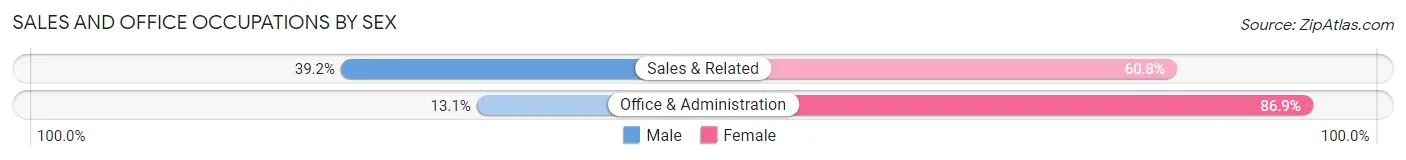
| Occupation | Male | Female |
| Sales & Related | 29 (39.2%) | 45 (60.8%) |
| Office & Administration | 23 (13.1%) | 153 (86.9%) |
| Total (Category) | 52 (20.8%) | 198 (79.2%) |
| Total (Overall) | 936 (61.9%) | 577 (38.1%) |
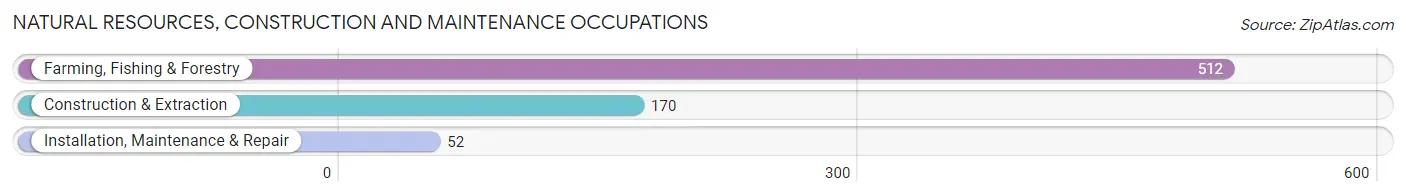
Natural Resources, Construction and Maintenance Occupations
The most common Natural Resources, Construction and Maintenance occupations in Ford City are Farming, Fishing & Forestry (512 | 33.8%), Construction & Extraction (170 | 11.2%), and Installation, Maintenance & Repair (52 | 3.4%).
Natural Resources, Construction and Maintenance Occupations by Sex
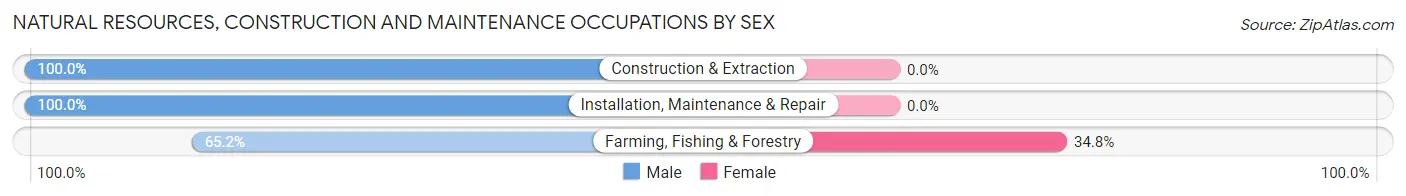
| Occupation | Male | Female |
| Farming, Fishing & Forestry | 334 (65.2%) | 178 (34.8%) |
| Construction & Extraction | 170 (100.0%) | 0 (0.0%) |
| Installation, Maintenance & Repair | 52 (100.0%) | 0 (0.0%) |
| Total (Category) | 556 (75.7%) | 178 (24.2%) |
| Total (Overall) | 936 (61.9%) | 577 (38.1%) |
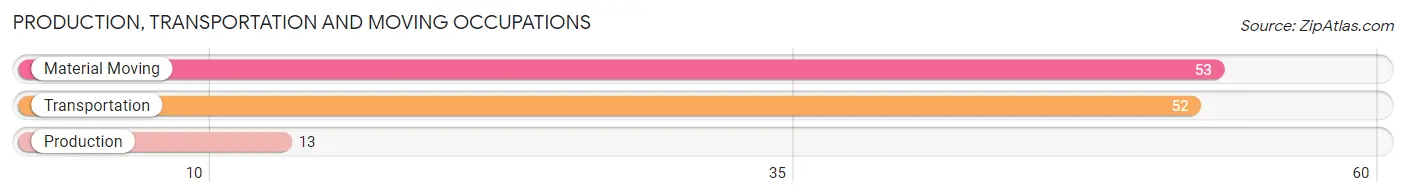
Production, Transportation and Moving Occupations
The most common Production, Transportation and Moving occupations in Ford City are Material Moving (53 | 3.5%), Transportation (52 | 3.4%), and Production (13 | 0.9%).
Production, Transportation and Moving Occupations by Sex
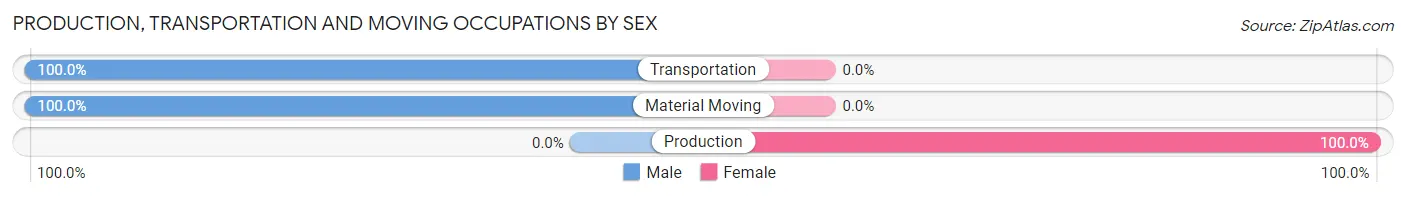
| Occupation | Male | Female |
| Production | 0 (0.0%) | 13 (100.0%) |
| Transportation | 52 (100.0%) | 0 (0.0%) |
| Material Moving | 53 (100.0%) | 0 (0.0%) |
| Total (Category) | 105 (89.0%) | 13 (11.0%) |
| Total (Overall) | 936 (61.9%) | 577 (38.1%) |
Employment Industries by Sex in Ford City
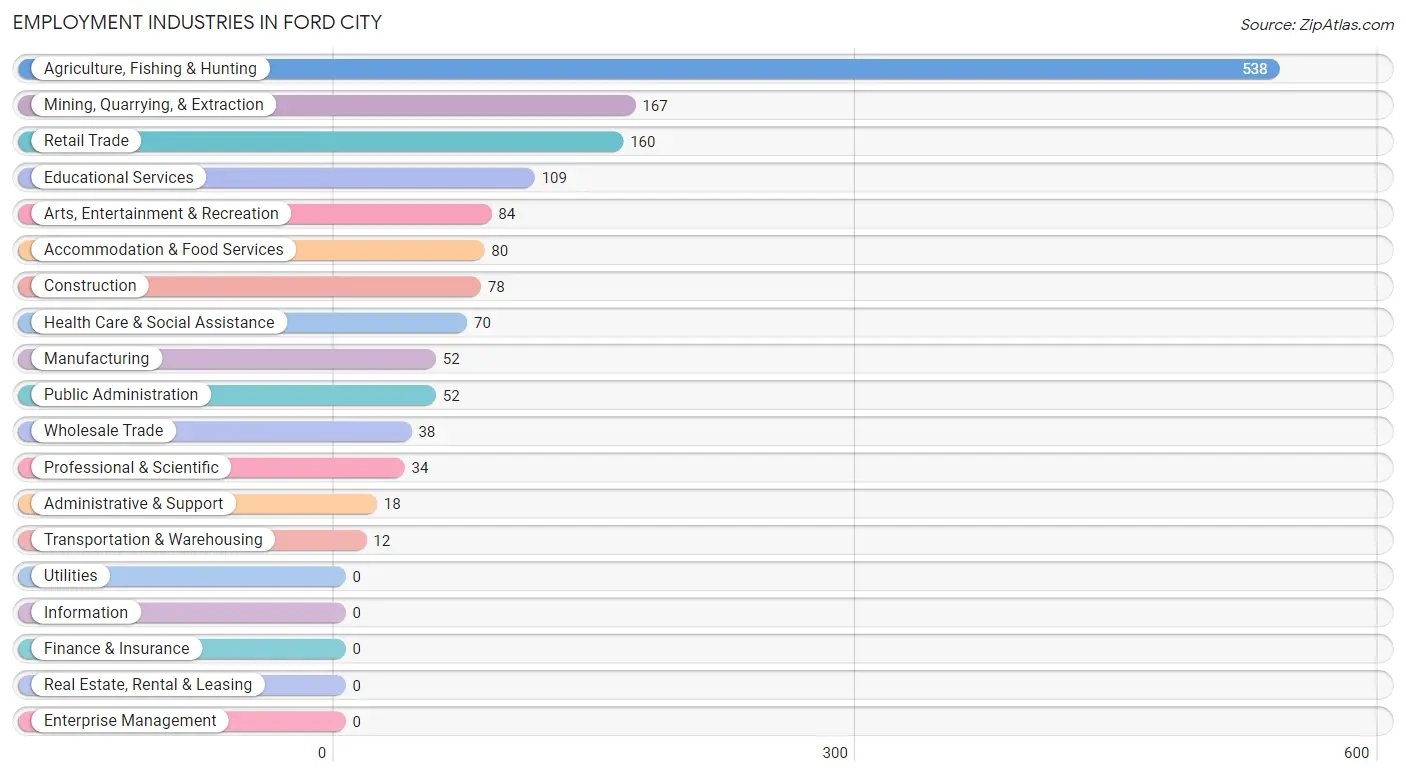
Employment Industries in Ford City
The major employment industries in Ford City include Agriculture, Fishing & Hunting (538 | 35.6%), Mining, Quarrying, & Extraction (167 | 11.0%), Retail Trade (160 | 10.6%), Educational Services (109 | 7.2%), and Arts, Entertainment & Recreation (84 | 5.6%).
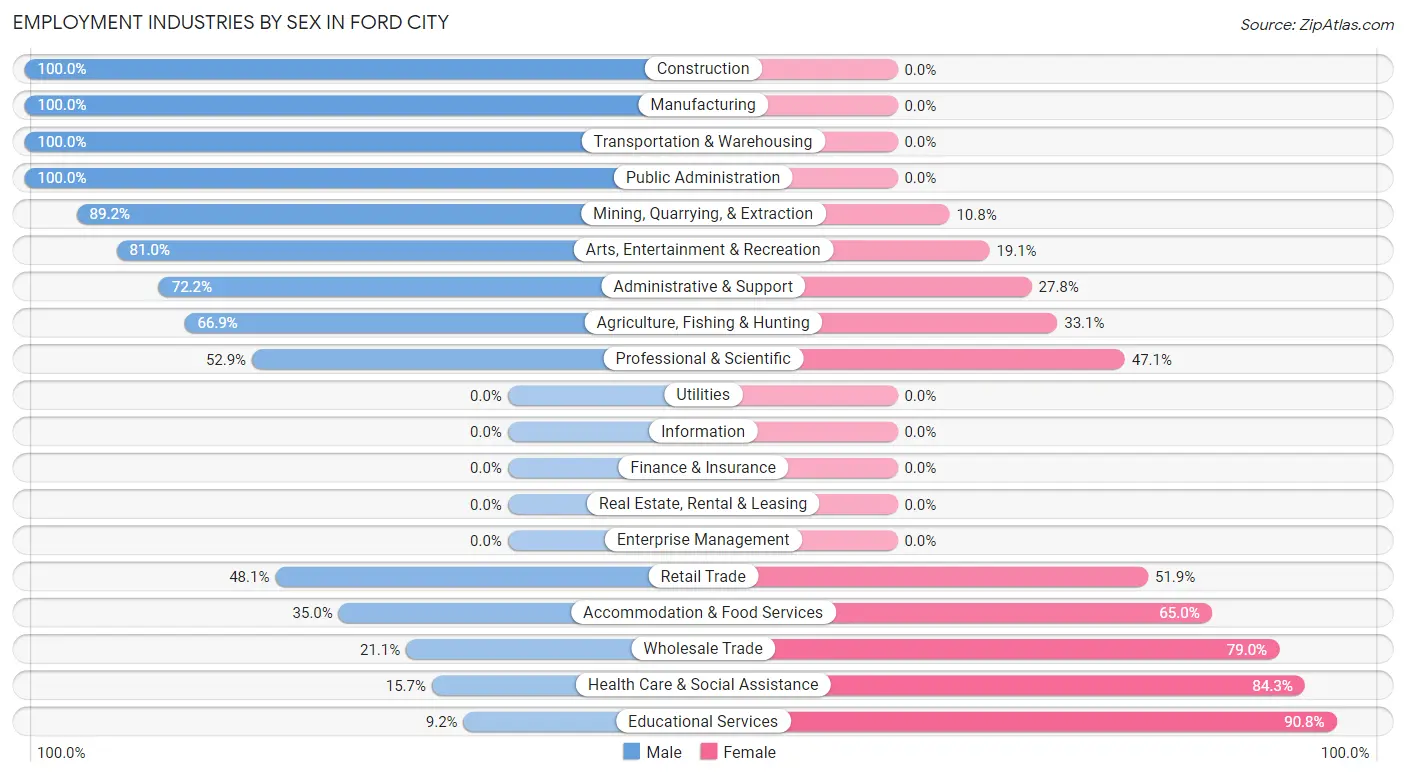
Employment Industries by Sex in Ford City
The Ford City industries that see more men than women are Construction (100.0%), Manufacturing (100.0%), and Transportation & Warehousing (100.0%), whereas the industries that tend to have a higher number of women are Educational Services (90.8%), Health Care & Social Assistance (84.3%), and Wholesale Trade (78.9%).
| Industry | Male | Female |
| Agriculture, Fishing & Hunting | 360 (66.9%) | 178 (33.1%) |
| Mining, Quarrying, & Extraction | 149 (89.2%) | 18 (10.8%) |
| Construction | 78 (100.0%) | 0 (0.0%) |
| Manufacturing | 52 (100.0%) | 0 (0.0%) |
| Wholesale Trade | 8 (21.0%) | 30 (78.9%) |
| Retail Trade | 77 (48.1%) | 83 (51.9%) |
| Transportation & Warehousing | 12 (100.0%) | 0 (0.0%) |
| Utilities | 0 (0.0%) | 0 (0.0%) |
| Information | 0 (0.0%) | 0 (0.0%) |
| Finance & Insurance | 0 (0.0%) | 0 (0.0%) |
| Real Estate, Rental & Leasing | 0 (0.0%) | 0 (0.0%) |
| Professional & Scientific | 18 (52.9%) | 16 (47.1%) |
| Enterprise Management | 0 (0.0%) | 0 (0.0%) |
| Administrative & Support | 13 (72.2%) | 5 (27.8%) |
| Educational Services | 10 (9.2%) | 99 (90.8%) |
| Health Care & Social Assistance | 11 (15.7%) | 59 (84.3%) |
| Arts, Entertainment & Recreation | 68 (80.9%) | 16 (19.1%) |
| Accommodation & Food Services | 28 (35.0%) | 52 (65.0%) |
| Public Administration | 52 (100.0%) | 0 (0.0%) |
| Total | 936 (61.9%) | 577 (38.1%) |
Education in Ford City
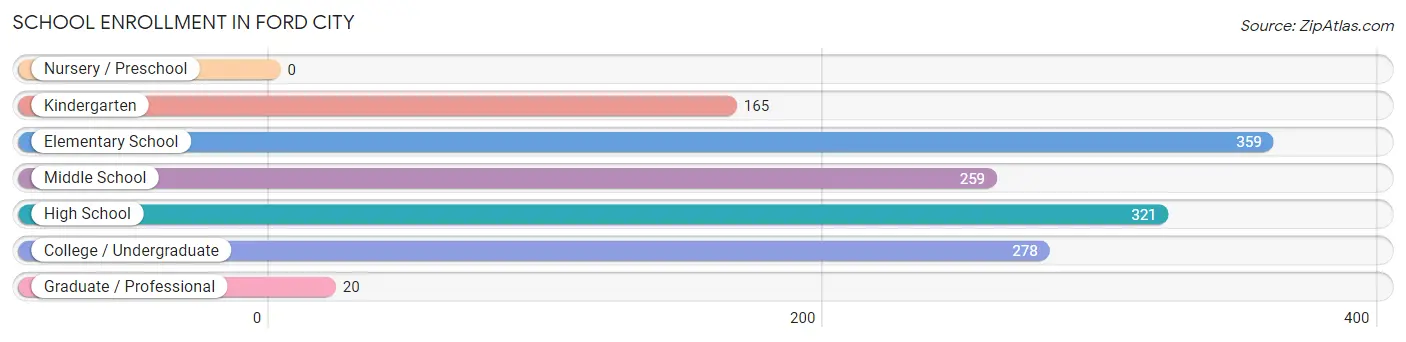
School Enrollment in Ford City
The most common levels of schooling among the 1,402 students in Ford City are elementary school (359 | 25.6%), high school (321 | 22.9%), and college / undergraduate (278 | 19.8%).
| School Level | # Students | % Students |
| Nursery / Preschool | 0 | 0.0% |
| Kindergarten | 165 | 11.8% |
| Elementary School | 359 | 25.6% |
| Middle School | 259 | 18.5% |
| High School | 321 | 22.9% |
| College / Undergraduate | 278 | 19.8% |
| Graduate / Professional | 20 | 1.4% |
| Total | 1,402 | 100.0% |
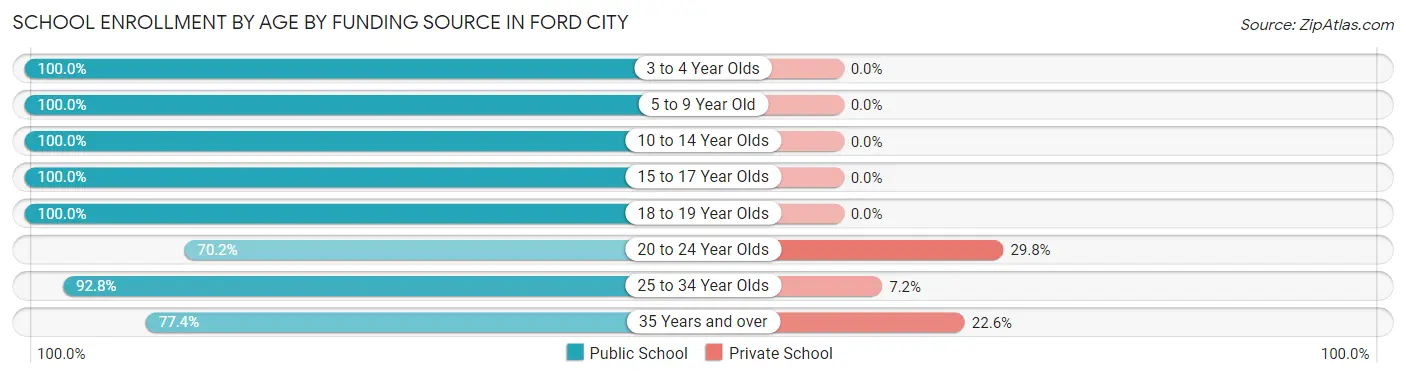
School Enrollment by Age by Funding Source in Ford City
Out of a total of 1,402 students who are enrolled in schools in Ford City, 49 (3.5%) attend a private institution, while the remaining 1,353 (96.5%) are enrolled in public schools. The age group of 20 to 24 year olds has the highest likelihood of being enrolled in private schools, with 25 (29.8% in the age bracket) enrolled. Conversely, the age group of 3 to 4 year olds has the lowest likelihood of being enrolled in a private school, with 8 (100.0% in the age bracket) attending a public institution.
| Age Bracket | Public School | Private School |
| 3 to 4 Year Olds | 8 (100.0%) | 0 (0.0%) |
| 5 to 9 Year Old | 488 (100.0%) | 0 (0.0%) |
| 10 to 14 Year Olds | 322 (100.0%) | 0 (0.0%) |
| 15 to 17 Year Olds | 165 (100.0%) | 0 (0.0%) |
| 18 to 19 Year Olds | 134 (100.0%) | 0 (0.0%) |
| 20 to 24 Year Olds | 59 (70.2%) | 25 (29.8%) |
| 25 to 34 Year Olds | 129 (92.8%) | 10 (7.2%) |
| 35 Years and over | 48 (77.4%) | 14 (22.6%) |
| Total | 1,353 (96.5%) | 49 (3.5%) |
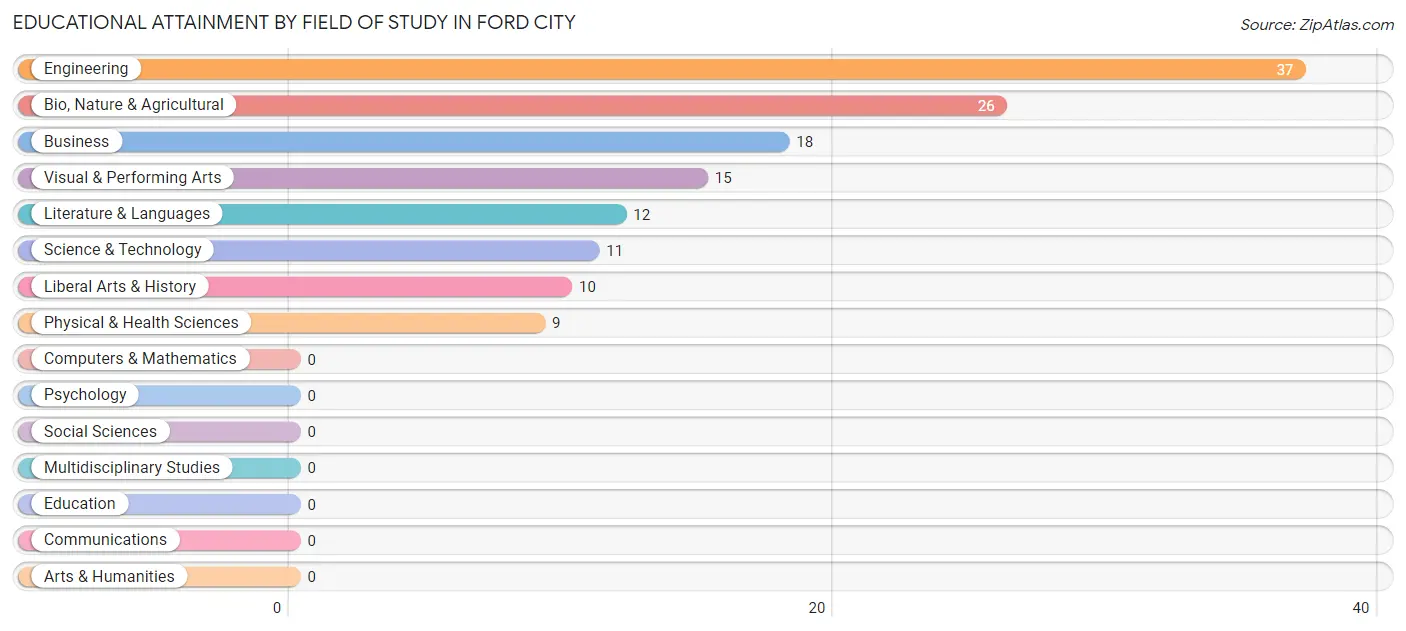
Educational Attainment by Field of Study in Ford City
Engineering (37 | 26.8%), bio, nature & agricultural (26 | 18.8%), business (18 | 13.0%), visual & performing arts (15 | 10.9%), and literature & languages (12 | 8.7%) are the most common fields of study among 138 individuals in Ford City who have obtained a bachelor's degree or higher.
| Field of Study | # Graduates | % Graduates |
| Computers & Mathematics | 0 | 0.0% |
| Bio, Nature & Agricultural | 26 | 18.8% |
| Physical & Health Sciences | 9 | 6.5% |
| Psychology | 0 | 0.0% |
| Social Sciences | 0 | 0.0% |
| Engineering | 37 | 26.8% |
| Multidisciplinary Studies | 0 | 0.0% |
| Science & Technology | 11 | 8.0% |
| Business | 18 | 13.0% |
| Education | 0 | 0.0% |
| Literature & Languages | 12 | 8.7% |
| Liberal Arts & History | 10 | 7.2% |
| Visual & Performing Arts | 15 | 10.9% |
| Communications | 0 | 0.0% |
| Arts & Humanities | 0 | 0.0% |
| Total | 138 | 100.0% |
Transportation & Commute in Ford City
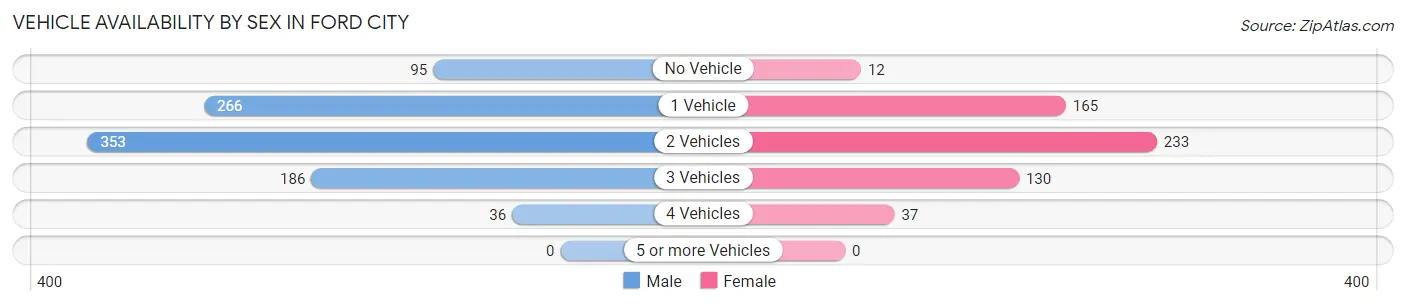
Vehicle Availability by Sex in Ford City
The most prevalent vehicle ownership categories in Ford City are males with 2 vehicles (353, accounting for 37.7%) and females with 2 vehicles (233, making up 61.2%).
| Vehicles Available | Male | Female |
| No Vehicle | 95 (10.2%) | 12 (2.1%) |
| 1 Vehicle | 266 (28.4%) | 165 (28.6%) |
| 2 Vehicles | 353 (37.7%) | 233 (40.4%) |
| 3 Vehicles | 186 (19.9%) | 130 (22.5%) |
| 4 Vehicles | 36 (3.8%) | 37 (6.4%) |
| 5 or more Vehicles | 0 (0.0%) | 0 (0.0%) |
| Total | 936 (100.0%) | 577 (100.0%) |
Commute Time in Ford City
The most frequently occuring commute durations in Ford City are 30 to 34 minutes (287 commuters, 19.0%), 5 to 9 minutes (271 commuters, 17.9%), and 15 to 19 minutes (219 commuters, 14.5%).
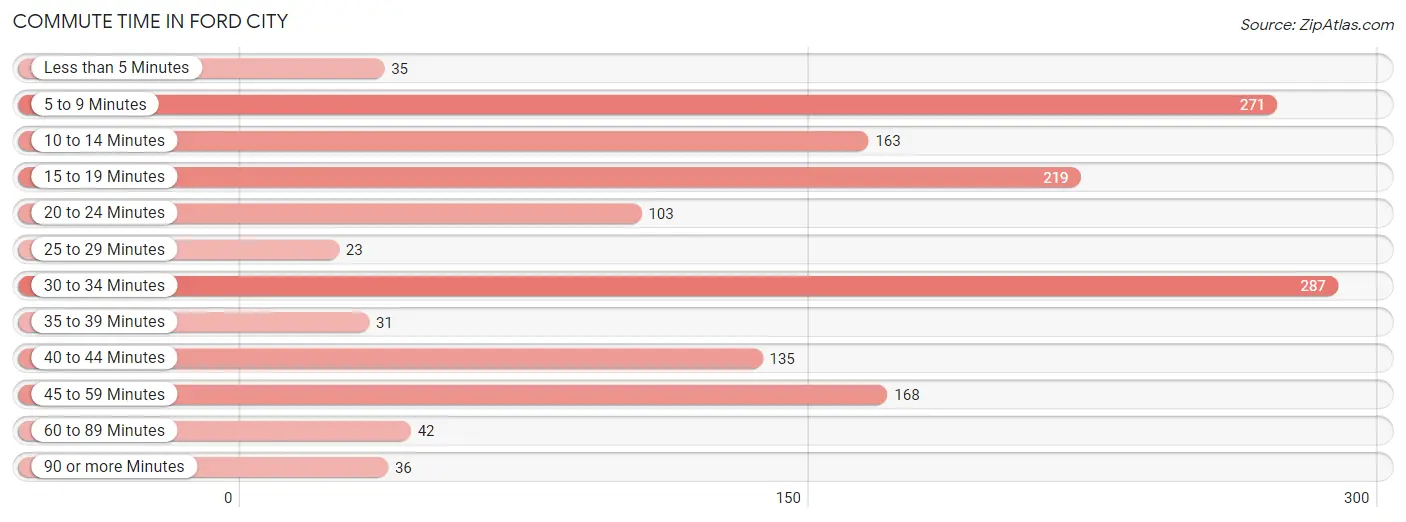
| Commute Time | # Commuters | % Commuters |
| Less than 5 Minutes | 35 | 2.3% |
| 5 to 9 Minutes | 271 | 17.9% |
| 10 to 14 Minutes | 163 | 10.8% |
| 15 to 19 Minutes | 219 | 14.5% |
| 20 to 24 Minutes | 103 | 6.8% |
| 25 to 29 Minutes | 23 | 1.5% |
| 30 to 34 Minutes | 287 | 19.0% |
| 35 to 39 Minutes | 31 | 2.1% |
| 40 to 44 Minutes | 135 | 8.9% |
| 45 to 59 Minutes | 168 | 11.1% |
| 60 to 89 Minutes | 42 | 2.8% |
| 90 or more Minutes | 36 | 2.4% |
Commute Time by Sex in Ford City
The most common commute times in Ford City are 15 to 19 minutes (193 commuters, 20.6%) for males and 5 to 9 minutes (115 commuters, 19.9%) for females.
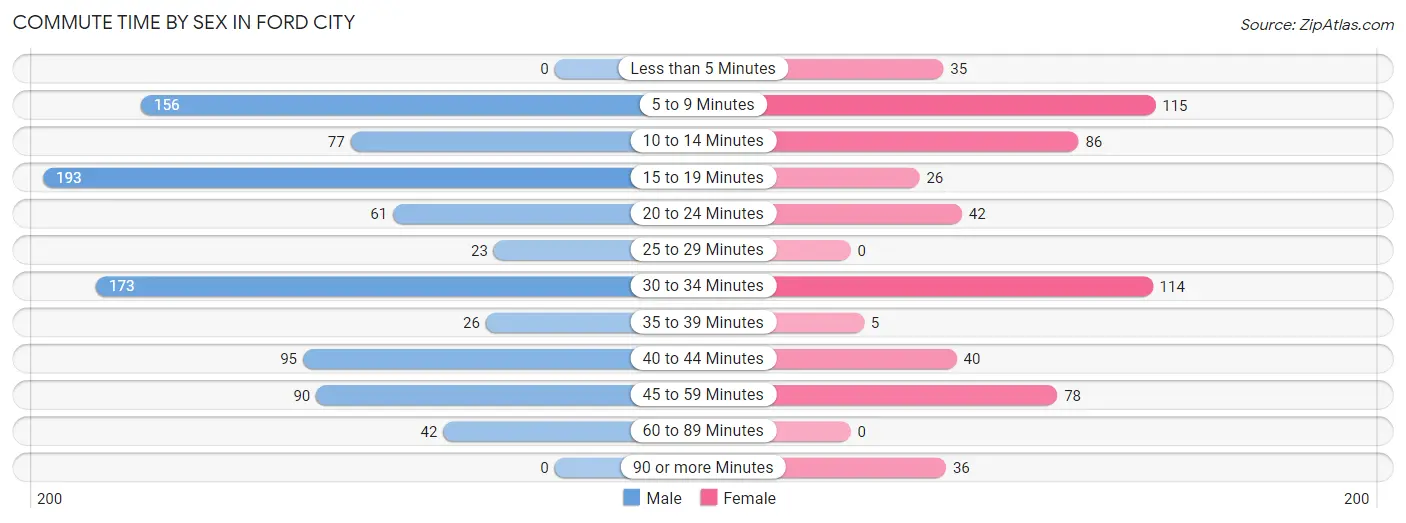
| Commute Time | Male | Female |
| Less than 5 Minutes | 0 (0.0%) | 35 (6.1%) |
| 5 to 9 Minutes | 156 (16.7%) | 115 (19.9%) |
| 10 to 14 Minutes | 77 (8.2%) | 86 (14.9%) |
| 15 to 19 Minutes | 193 (20.6%) | 26 (4.5%) |
| 20 to 24 Minutes | 61 (6.5%) | 42 (7.3%) |
| 25 to 29 Minutes | 23 (2.5%) | 0 (0.0%) |
| 30 to 34 Minutes | 173 (18.5%) | 114 (19.8%) |
| 35 to 39 Minutes | 26 (2.8%) | 5 (0.9%) |
| 40 to 44 Minutes | 95 (10.2%) | 40 (6.9%) |
| 45 to 59 Minutes | 90 (9.6%) | 78 (13.5%) |
| 60 to 89 Minutes | 42 (4.5%) | 0 (0.0%) |
| 90 or more Minutes | 0 (0.0%) | 36 (6.2%) |
Time of Departure to Work by Sex in Ford City
The most frequent times of departure to work in Ford City are 12:00 AM to 4:59 AM (266, 28.4%) for males and 7:00 AM to 7:29 AM (194, 33.6%) for females.
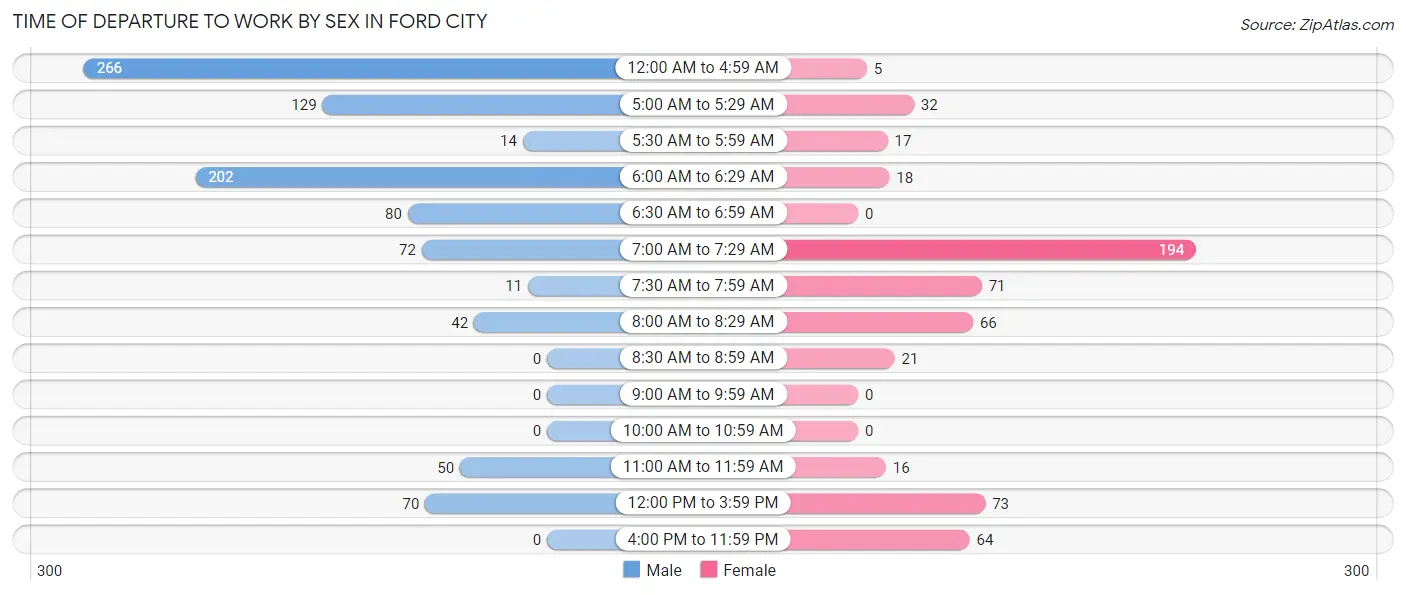
| Time of Departure | Male | Female |
| 12:00 AM to 4:59 AM | 266 (28.4%) | 5 (0.9%) |
| 5:00 AM to 5:29 AM | 129 (13.8%) | 32 (5.6%) |
| 5:30 AM to 5:59 AM | 14 (1.5%) | 17 (2.9%) |
| 6:00 AM to 6:29 AM | 202 (21.6%) | 18 (3.1%) |
| 6:30 AM to 6:59 AM | 80 (8.6%) | 0 (0.0%) |
| 7:00 AM to 7:29 AM | 72 (7.7%) | 194 (33.6%) |
| 7:30 AM to 7:59 AM | 11 (1.2%) | 71 (12.3%) |
| 8:00 AM to 8:29 AM | 42 (4.5%) | 66 (11.4%) |
| 8:30 AM to 8:59 AM | 0 (0.0%) | 21 (3.6%) |
| 9:00 AM to 9:59 AM | 0 (0.0%) | 0 (0.0%) |
| 10:00 AM to 10:59 AM | 0 (0.0%) | 0 (0.0%) |
| 11:00 AM to 11:59 AM | 50 (5.3%) | 16 (2.8%) |
| 12:00 PM to 3:59 PM | 70 (7.5%) | 73 (12.7%) |
| 4:00 PM to 11:59 PM | 0 (0.0%) | 64 (11.1%) |
| Total | 936 (100.0%) | 577 (100.0%) |
Housing Occupancy in Ford City
Occupancy by Ownership in Ford City
Of the total 1,258 dwellings in Ford City, owner-occupied units account for 463 (36.8%), while renter-occupied units make up 795 (63.2%).
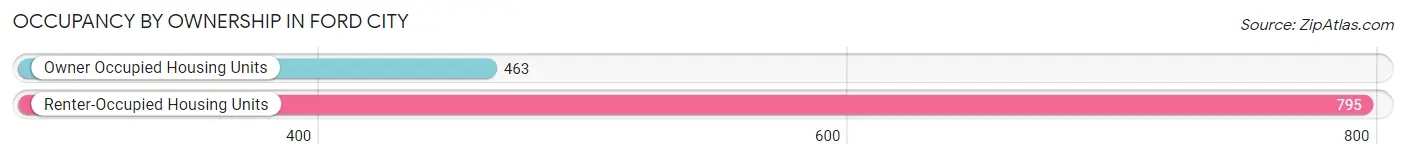
| Occupancy | # Housing Units | % Housing Units |
| Owner Occupied Housing Units | 463 | 36.8% |
| Renter-Occupied Housing Units | 795 | 63.2% |
| Total Occupied Housing Units | 1,258 | 100.0% |
Occupancy by Household Size in Ford City
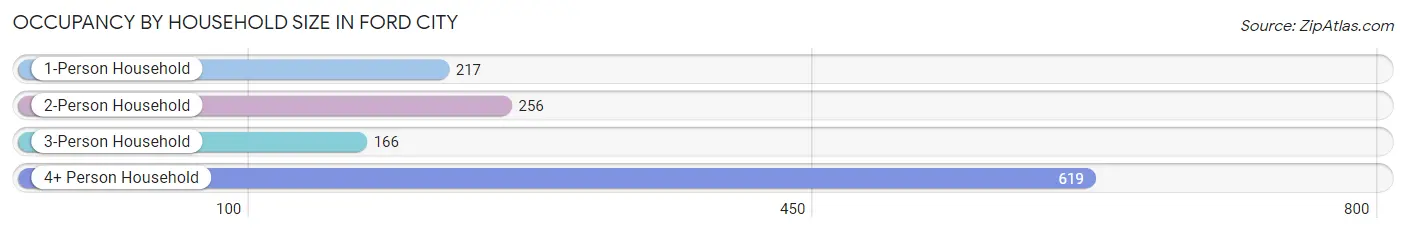
| Household Size | # Housing Units | % Housing Units |
| 1-Person Household | 217 | 17.2% |
| 2-Person Household | 256 | 20.3% |
| 3-Person Household | 166 | 13.2% |
| 4+ Person Household | 619 | 49.2% |
| Total Housing Units | 1,258 | 100.0% |
Occupancy by Ownership by Household Size in Ford City
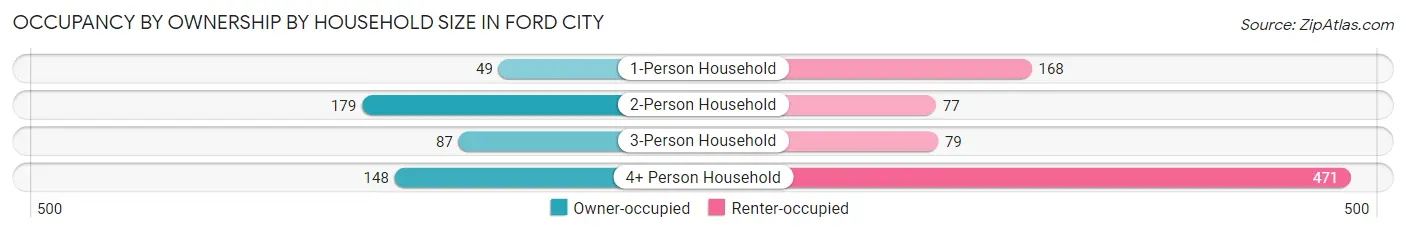
| Household Size | Owner-occupied | Renter-occupied |
| 1-Person Household | 49 (22.6%) | 168 (77.4%) |
| 2-Person Household | 179 (69.9%) | 77 (30.1%) |
| 3-Person Household | 87 (52.4%) | 79 (47.6%) |
| 4+ Person Household | 148 (23.9%) | 471 (76.1%) |
| Total Housing Units | 463 (36.8%) | 795 (63.2%) |
Occupancy by Educational Attainment in Ford City
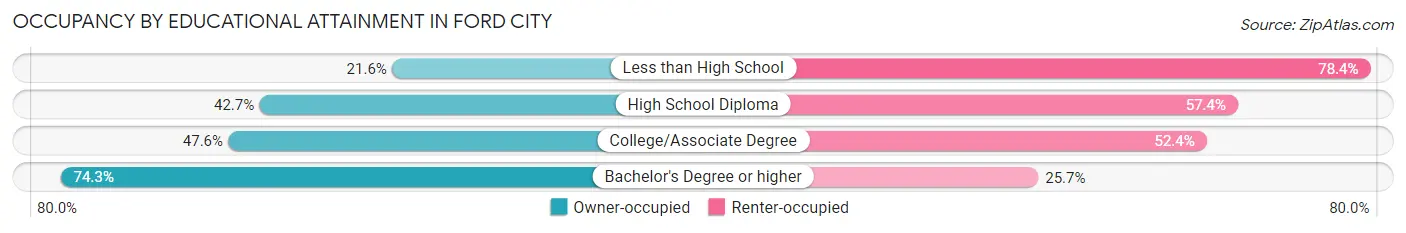
| Household Size | Owner-occupied | Renter-occupied |
| Less than High School | 104 (21.6%) | 377 (78.4%) |
| High School Diploma | 174 (42.6%) | 234 (57.4%) |
| College/Associate Degree | 159 (47.6%) | 175 (52.4%) |
| Bachelor's Degree or higher | 26 (74.3%) | 9 (25.7%) |
Occupancy by Age of Householder in Ford City
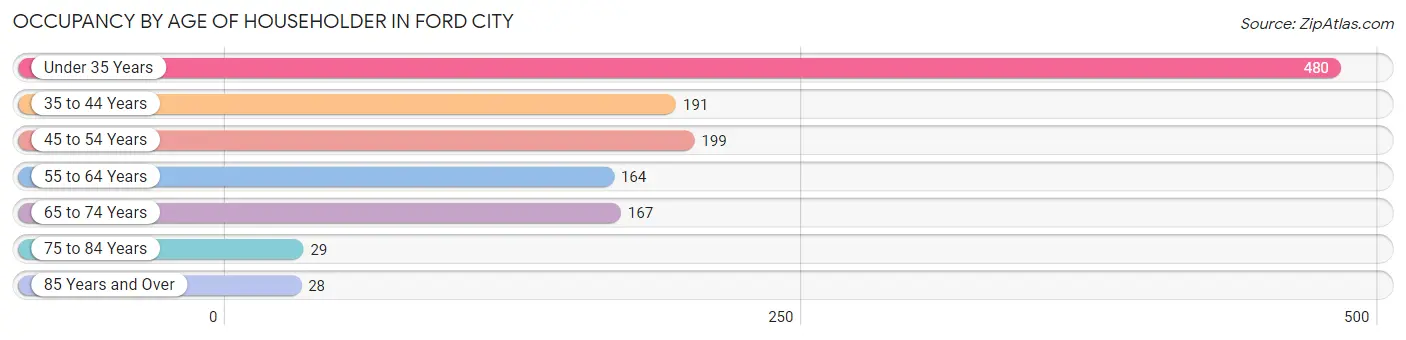
| Age Bracket | # Households | % Households |
| Under 35 Years | 480 | 38.2% |
| 35 to 44 Years | 191 | 15.2% |
| 45 to 54 Years | 199 | 15.8% |
| 55 to 64 Years | 164 | 13.0% |
| 65 to 74 Years | 167 | 13.3% |
| 75 to 84 Years | 29 | 2.3% |
| 85 Years and Over | 28 | 2.2% |
| Total | 1,258 | 100.0% |
Housing Finances in Ford City
Median Income by Occupancy in Ford City
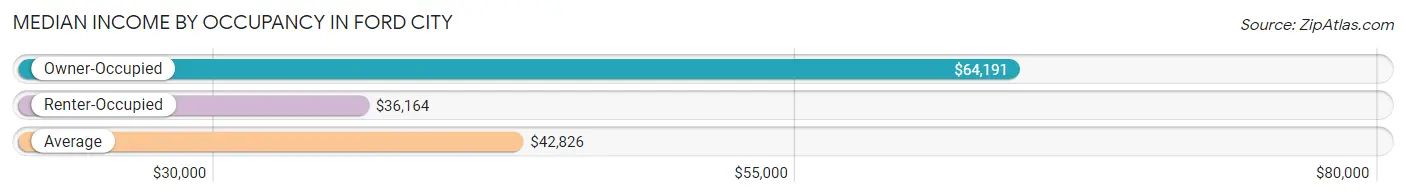
| Occupancy Type | # Households | Median Income |
| Owner-Occupied | 463 (36.8%) | $64,191 |
| Renter-Occupied | 795 (63.2%) | $36,164 |
| Average | 1,258 (100.0%) | $42,826 |
Occupancy by Householder Income Bracket in Ford City
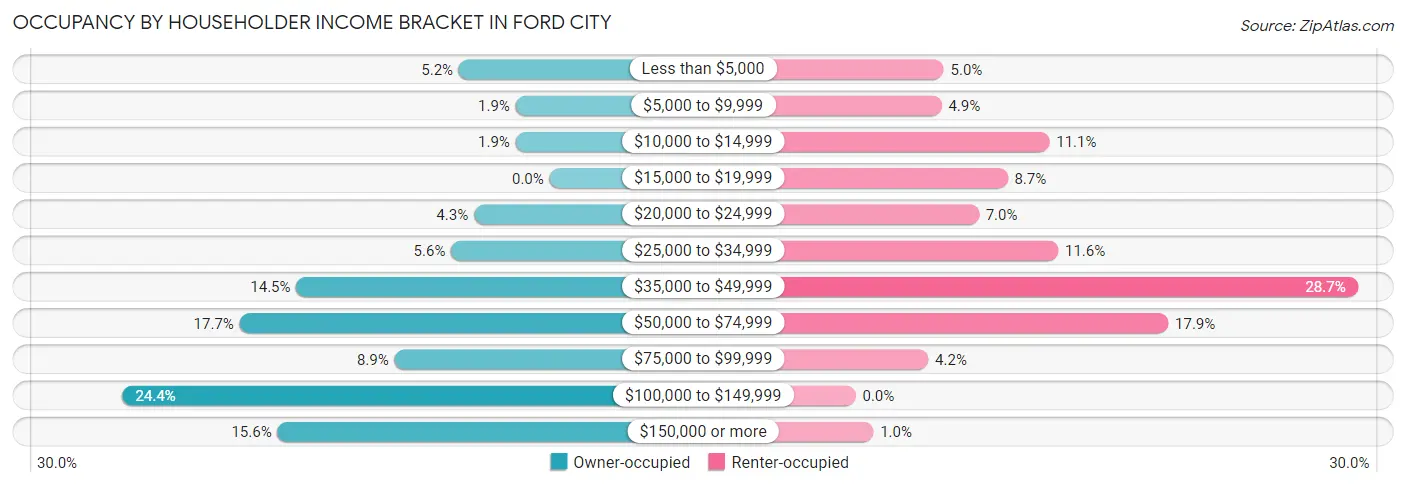
| Income Bracket | Owner-occupied | Renter-occupied |
| Less than $5,000 | 24 (5.2%) | 40 (5.0%) |
| $5,000 to $9,999 | 9 (1.9%) | 39 (4.9%) |
| $10,000 to $14,999 | 9 (1.9%) | 88 (11.1%) |
| $15,000 to $19,999 | 0 (0.0%) | 69 (8.7%) |
| $20,000 to $24,999 | 20 (4.3%) | 56 (7.0%) |
| $25,000 to $34,999 | 26 (5.6%) | 92 (11.6%) |
| $35,000 to $49,999 | 67 (14.5%) | 228 (28.7%) |
| $50,000 to $74,999 | 82 (17.7%) | 142 (17.9%) |
| $75,000 to $99,999 | 41 (8.9%) | 33 (4.2%) |
| $100,000 to $149,999 | 113 (24.4%) | 0 (0.0%) |
| $150,000 or more | 72 (15.5%) | 8 (1.0%) |
| Total | 463 (100.0%) | 795 (100.0%) |
Monthly Housing Cost Tiers in Ford City
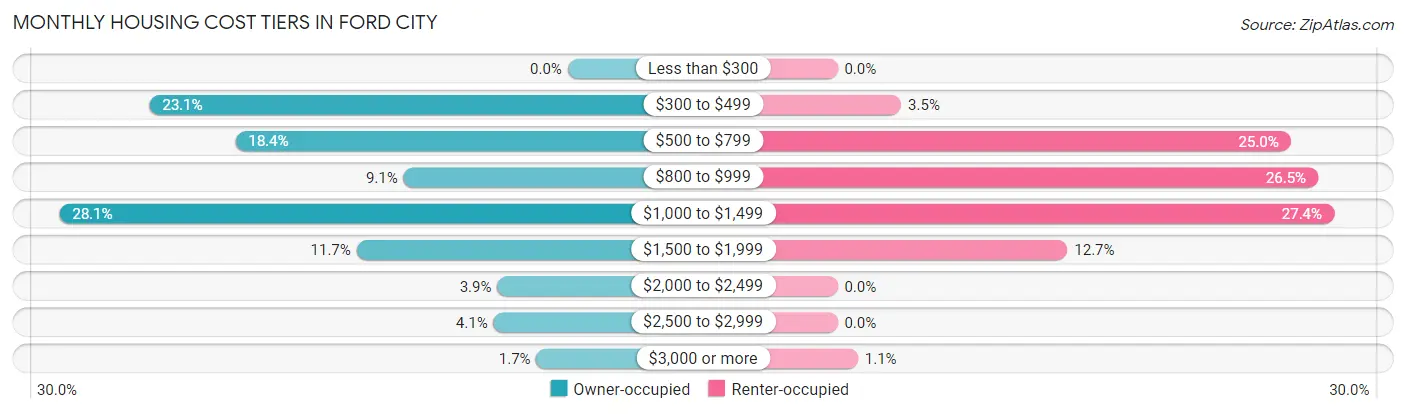
| Monthly Cost | Owner-occupied | Renter-occupied |
| Less than $300 | 0 (0.0%) | 0 (0.0%) |
| $300 to $499 | 107 (23.1%) | 28 (3.5%) |
| $500 to $799 | 85 (18.4%) | 199 (25.0%) |
| $800 to $999 | 42 (9.1%) | 211 (26.5%) |
| $1,000 to $1,499 | 130 (28.1%) | 218 (27.4%) |
| $1,500 to $1,999 | 54 (11.7%) | 101 (12.7%) |
| $2,000 to $2,499 | 18 (3.9%) | 0 (0.0%) |
| $2,500 to $2,999 | 19 (4.1%) | 0 (0.0%) |
| $3,000 or more | 8 (1.7%) | 9 (1.1%) |
| Total | 463 (100.0%) | 795 (100.0%) |
Physical Housing Characteristics in Ford City
Housing Structures in Ford City
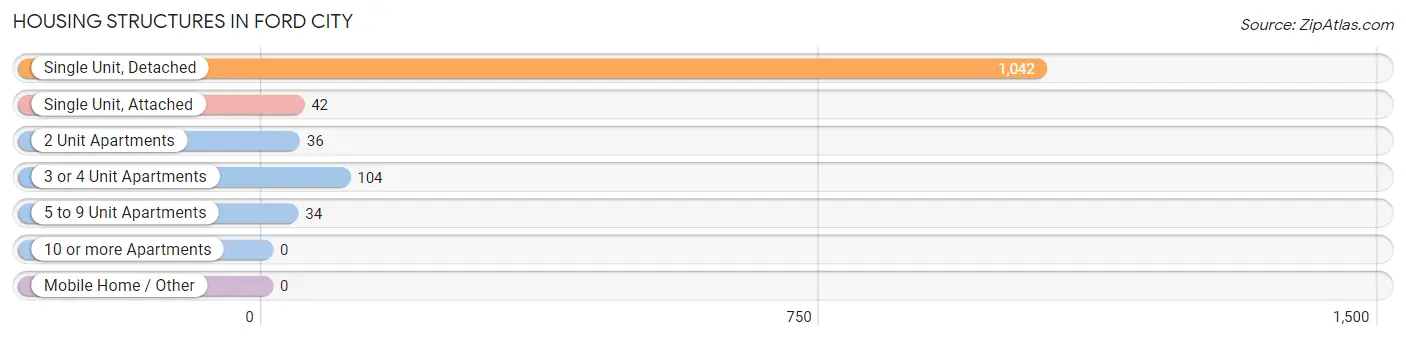
| Structure Type | # Housing Units | % Housing Units |
| Single Unit, Detached | 1,042 | 82.8% |
| Single Unit, Attached | 42 | 3.3% |
| 2 Unit Apartments | 36 | 2.9% |
| 3 or 4 Unit Apartments | 104 | 8.3% |
| 5 to 9 Unit Apartments | 34 | 2.7% |
| 10 or more Apartments | 0 | 0.0% |
| Mobile Home / Other | 0 | 0.0% |
| Total | 1,258 | 100.0% |
Housing Structures by Occupancy in Ford City
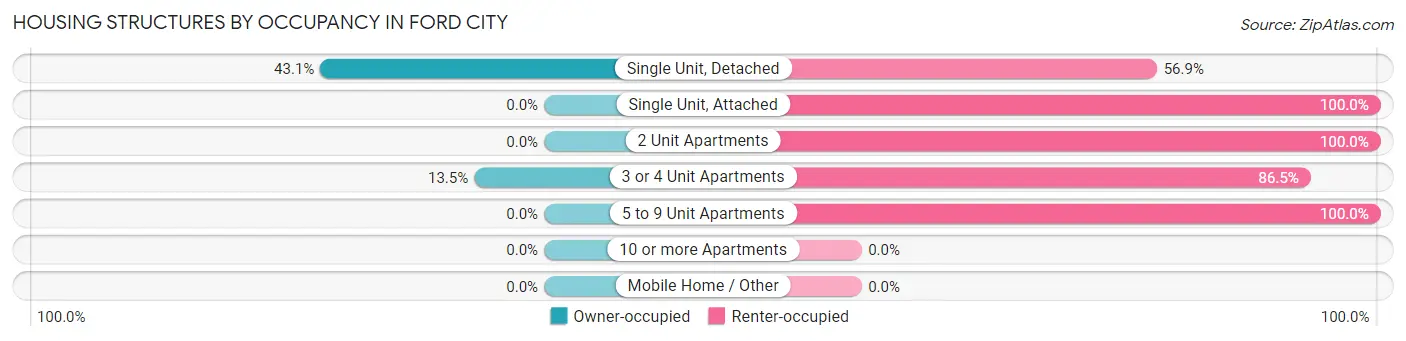
| Structure Type | Owner-occupied | Renter-occupied |
| Single Unit, Detached | 449 (43.1%) | 593 (56.9%) |
| Single Unit, Attached | 0 (0.0%) | 42 (100.0%) |
| 2 Unit Apartments | 0 (0.0%) | 36 (100.0%) |
| 3 or 4 Unit Apartments | 14 (13.5%) | 90 (86.5%) |
| 5 to 9 Unit Apartments | 0 (0.0%) | 34 (100.0%) |
| 10 or more Apartments | 0 (0.0%) | 0 (0.0%) |
| Mobile Home / Other | 0 (0.0%) | 0 (0.0%) |
| Total | 463 (36.8%) | 795 (63.2%) |
Housing Structures by Number of Rooms in Ford City
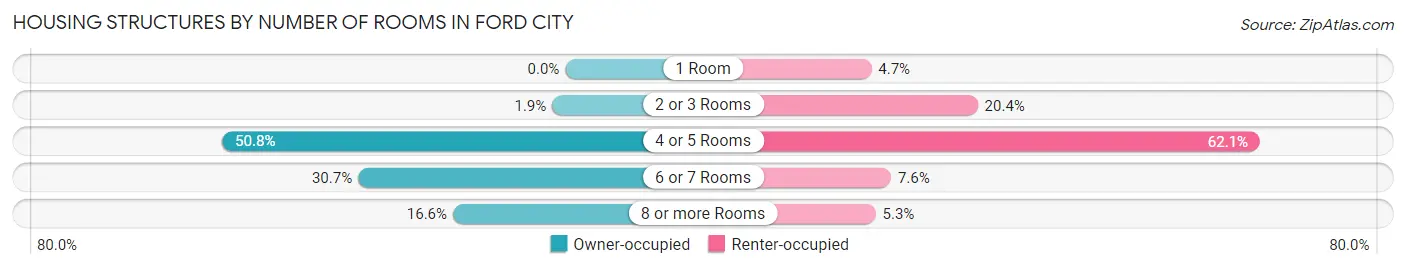
| Number of Rooms | Owner-occupied | Renter-occupied |
| 1 Room | 0 (0.0%) | 37 (4.6%) |
| 2 or 3 Rooms | 9 (1.9%) | 162 (20.4%) |
| 4 or 5 Rooms | 235 (50.8%) | 494 (62.1%) |
| 6 or 7 Rooms | 142 (30.7%) | 60 (7.5%) |
| 8 or more Rooms | 77 (16.6%) | 42 (5.3%) |
| Total | 463 (100.0%) | 795 (100.0%) |
Housing Structure by Heating Type in Ford City
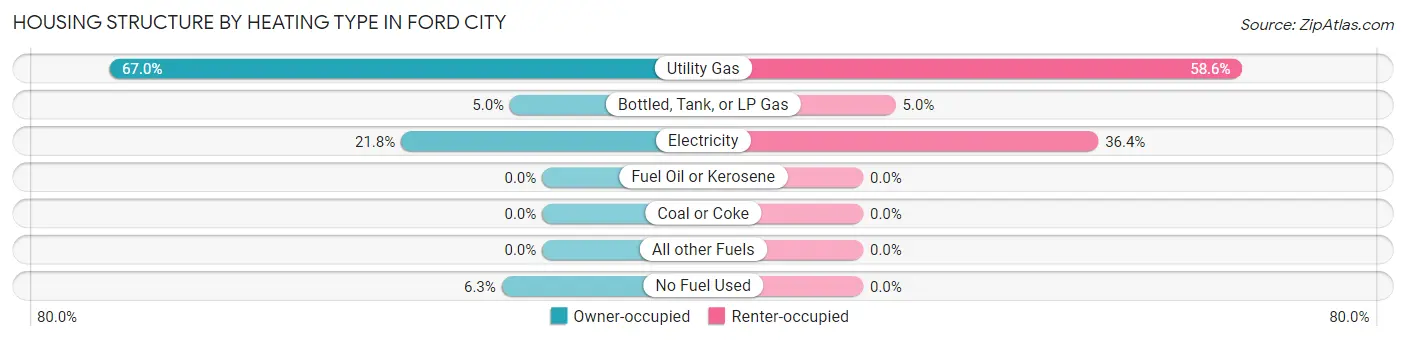
| Heating Type | Owner-occupied | Renter-occupied |
| Utility Gas | 310 (66.9%) | 466 (58.6%) |
| Bottled, Tank, or LP Gas | 23 (5.0%) | 40 (5.0%) |
| Electricity | 101 (21.8%) | 289 (36.3%) |
| Fuel Oil or Kerosene | 0 (0.0%) | 0 (0.0%) |
| Coal or Coke | 0 (0.0%) | 0 (0.0%) |
| All other Fuels | 0 (0.0%) | 0 (0.0%) |
| No Fuel Used | 29 (6.3%) | 0 (0.0%) |
| Total | 463 (100.0%) | 795 (100.0%) |
Household Vehicle Usage in Ford City
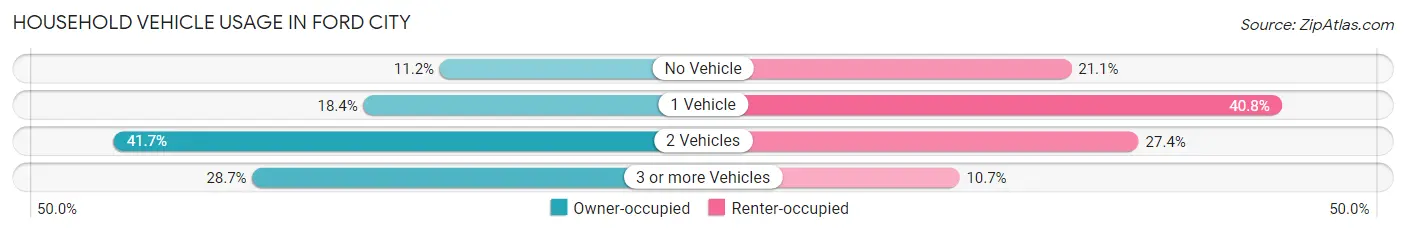
| Vehicles per Household | Owner-occupied | Renter-occupied |
| No Vehicle | 52 (11.2%) | 168 (21.1%) |
| 1 Vehicle | 85 (18.4%) | 324 (40.7%) |
| 2 Vehicles | 193 (41.7%) | 218 (27.4%) |
| 3 or more Vehicles | 133 (28.7%) | 85 (10.7%) |
| Total | 463 (100.0%) | 795 (100.0%) |
Real Estate & Mortgages in Ford City
Real Estate and Mortgage Overview in Ford City
| Characteristic | Without Mortgage | With Mortgage |
| Housing Units | 191 | 272 |
| Median Property Value | - | - |
| Median Household Income | $57,303 | $72 |
| Monthly Housing Costs | $475 | $8 |
| Real Estate Taxes | $1,923 | $0 |
Property Value by Mortgage Status in Ford City
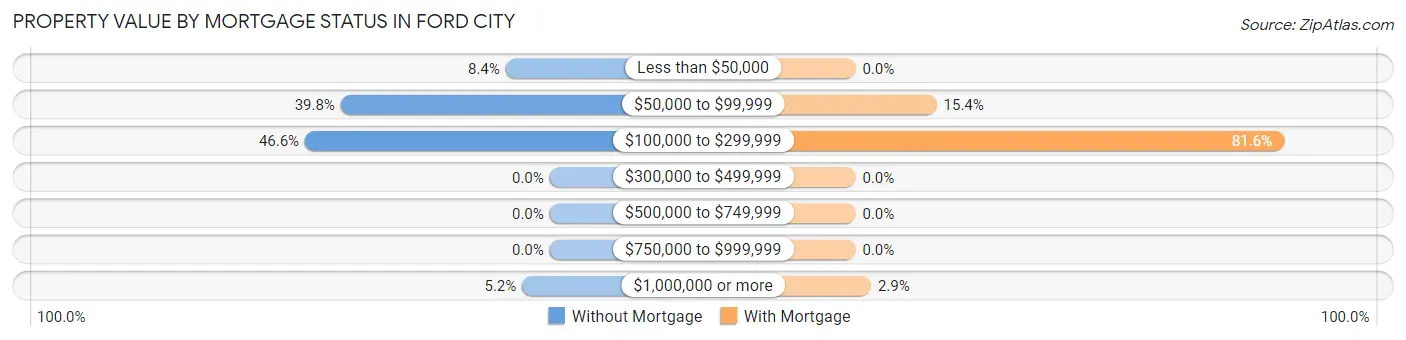
| Property Value | Without Mortgage | With Mortgage |
| Less than $50,000 | 16 (8.4%) | 0 (0.0%) |
| $50,000 to $99,999 | 76 (39.8%) | 42 (15.4%) |
| $100,000 to $299,999 | 89 (46.6%) | 222 (81.6%) |
| $300,000 to $499,999 | 0 (0.0%) | 0 (0.0%) |
| $500,000 to $749,999 | 0 (0.0%) | 0 (0.0%) |
| $750,000 to $999,999 | 0 (0.0%) | 0 (0.0%) |
| $1,000,000 or more | 10 (5.2%) | 8 (2.9%) |
| Total | 191 (100.0%) | 272 (100.0%) |
Household Income by Mortgage Status in Ford City
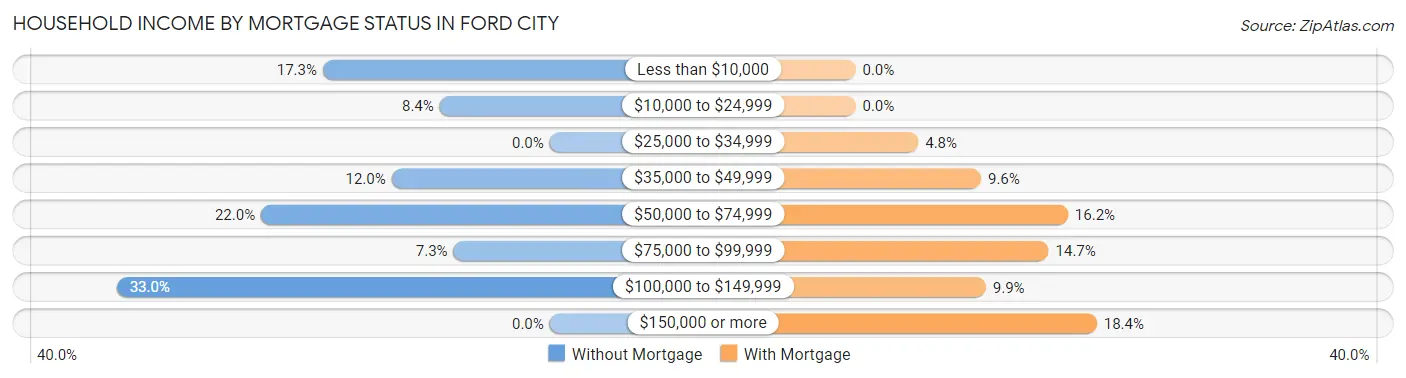
| Household Income | Without Mortgage | With Mortgage |
| Less than $10,000 | 33 (17.3%) | 0 (0.0%) |
| $10,000 to $24,999 | 16 (8.4%) | 0 (0.0%) |
| $25,000 to $34,999 | 0 (0.0%) | 13 (4.8%) |
| $35,000 to $49,999 | 23 (12.0%) | 26 (9.6%) |
| $50,000 to $74,999 | 42 (22.0%) | 44 (16.2%) |
| $75,000 to $99,999 | 14 (7.3%) | 40 (14.7%) |
| $100,000 to $149,999 | 63 (33.0%) | 27 (9.9%) |
| $150,000 or more | 0 (0.0%) | 50 (18.4%) |
| Total | 191 (100.0%) | 272 (100.0%) |
Property Value to Household Income Ratio in Ford City
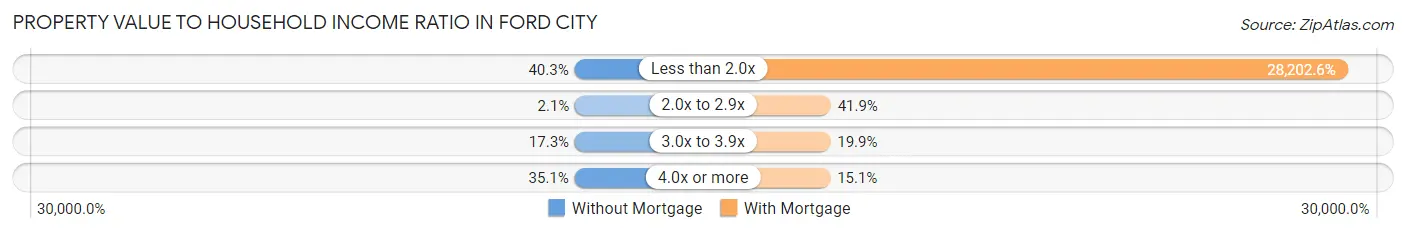
| Value-to-Income Ratio | Without Mortgage | With Mortgage |
| Less than 2.0x | 77 (40.3%) | 76,711 (28,202.6%) |
| 2.0x to 2.9x | 4 (2.1%) | 114 (41.9%) |
| 3.0x to 3.9x | 33 (17.3%) | 54 (19.9%) |
| 4.0x or more | 67 (35.1%) | 41 (15.1%) |
| Total | 191 (100.0%) | 272 (100.0%) |
Real Estate Taxes by Mortgage Status in Ford City
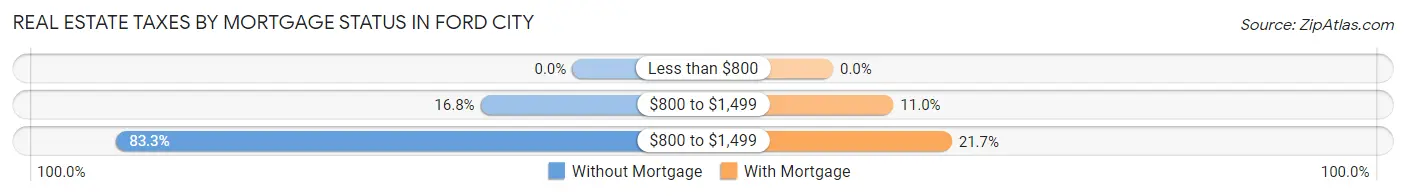
| Property Taxes | Without Mortgage | With Mortgage |
| Less than $800 | 0 (0.0%) | 0 (0.0%) |
| $800 to $1,499 | 32 (16.8%) | 30 (11.0%) |
| $800 to $1,499 | 159 (83.3%) | 59 (21.7%) |
| Total | 191 (100.0%) | 272 (100.0%) |
Health & Disability in Ford City
Health Insurance Coverage by Age in Ford City
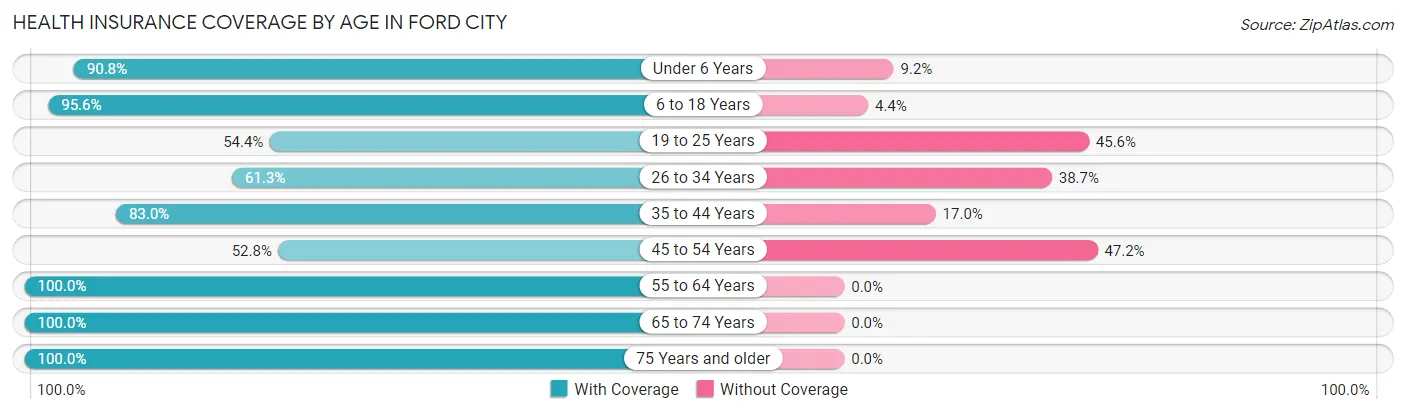
| Age Bracket | With Coverage | Without Coverage |
| Under 6 Years | 425 (90.8%) | 43 (9.2%) |
| 6 to 18 Years | 949 (95.6%) | 44 (4.4%) |
| 19 to 25 Years | 427 (54.4%) | 358 (45.6%) |
| 26 to 34 Years | 347 (61.3%) | 219 (38.7%) |
| 35 to 44 Years | 370 (83.0%) | 76 (17.0%) |
| 45 to 54 Years | 274 (52.8%) | 245 (47.2%) |
| 55 to 64 Years | 264 (100.0%) | 0 (0.0%) |
| 65 to 74 Years | 241 (100.0%) | 0 (0.0%) |
| 75 Years and older | 75 (100.0%) | 0 (0.0%) |
| Total | 3,372 (77.4%) | 985 (22.6%) |
Health Insurance Coverage by Citizenship Status in Ford City
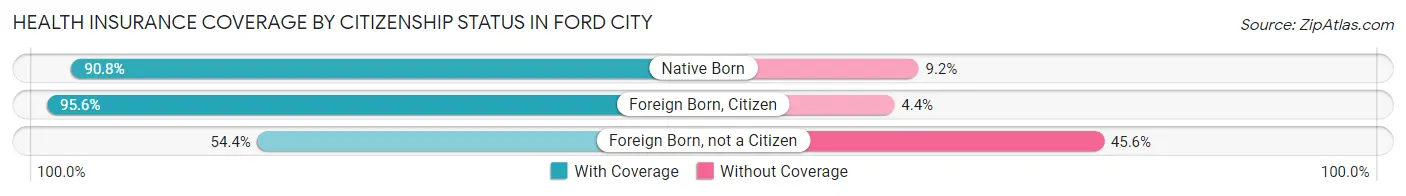
| Citizenship Status | With Coverage | Without Coverage |
| Native Born | 425 (90.8%) | 43 (9.2%) |
| Foreign Born, Citizen | 949 (95.6%) | 44 (4.4%) |
| Foreign Born, not a Citizen | 427 (54.4%) | 358 (45.6%) |
Health Insurance Coverage by Household Income in Ford City
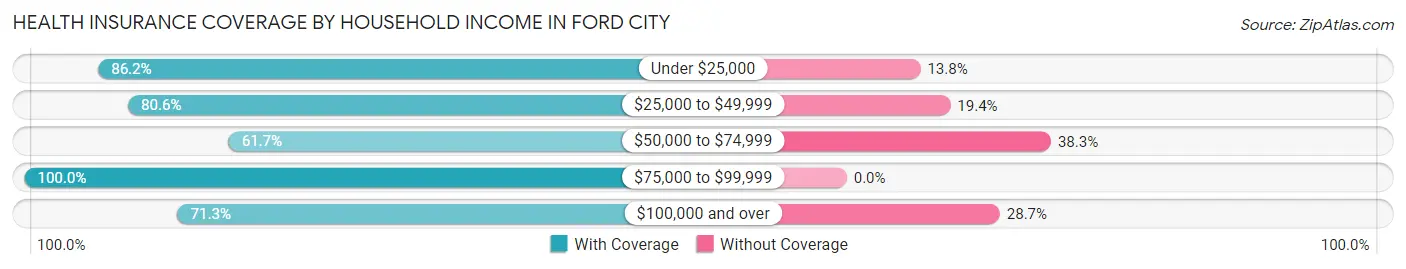
| Household Income | With Coverage | Without Coverage |
| Under $25,000 | 961 (86.2%) | 154 (13.8%) |
| $25,000 to $49,999 | 1,117 (80.6%) | 269 (19.4%) |
| $50,000 to $74,999 | 602 (61.7%) | 373 (38.3%) |
| $75,000 to $99,999 | 222 (100.0%) | 0 (0.0%) |
| $100,000 and over | 470 (71.3%) | 189 (28.7%) |
Public vs Private Health Insurance Coverage by Age in Ford City
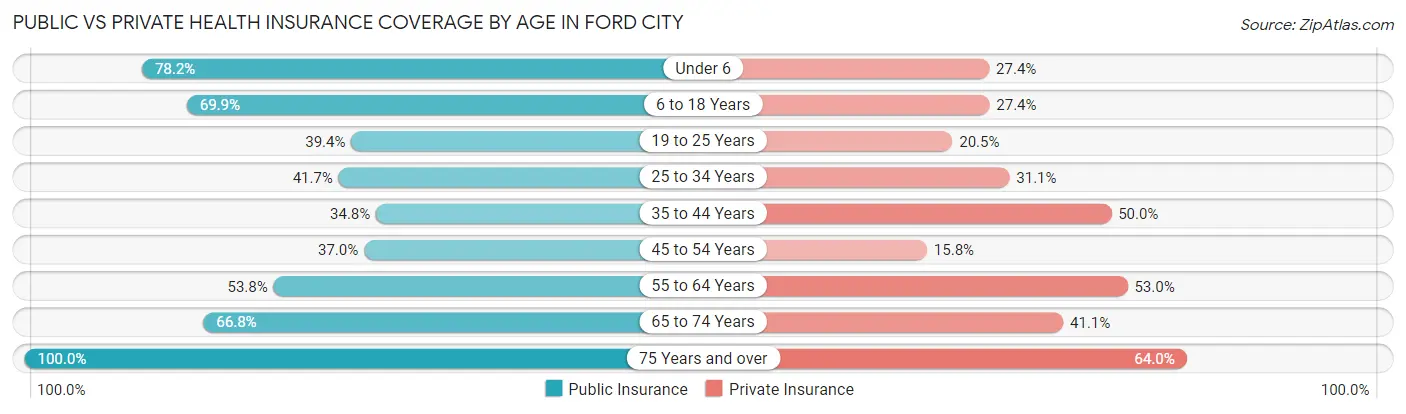
| Age Bracket | Public Insurance | Private Insurance |
| Under 6 | 366 (78.2%) | 128 (27.4%) |
| 6 to 18 Years | 694 (69.9%) | 272 (27.4%) |
| 19 to 25 Years | 309 (39.4%) | 161 (20.5%) |
| 25 to 34 Years | 236 (41.7%) | 176 (31.1%) |
| 35 to 44 Years | 155 (34.7%) | 223 (50.0%) |
| 45 to 54 Years | 192 (37.0%) | 82 (15.8%) |
| 55 to 64 Years | 142 (53.8%) | 140 (53.0%) |
| 65 to 74 Years | 161 (66.8%) | 99 (41.1%) |
| 75 Years and over | 75 (100.0%) | 48 (64.0%) |
| Total | 2,330 (53.5%) | 1,329 (30.5%) |
Disability Status by Sex by Age in Ford City
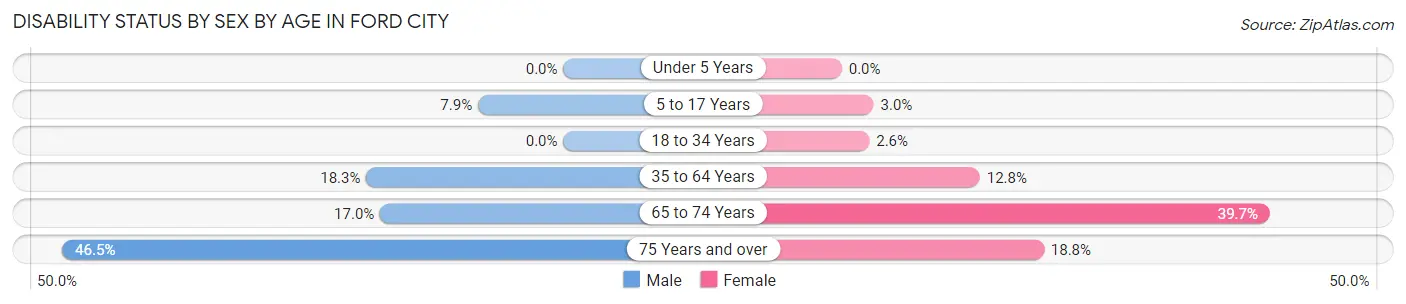
| Age Bracket | Male | Female |
| Under 5 Years | 0 (0.0%) | 0 (0.0%) |
| 5 to 17 Years | 45 (7.9%) | 12 (2.9%) |
| 18 to 34 Years | 0 (0.0%) | 20 (2.5%) |
| 35 to 64 Years | 122 (18.3%) | 72 (12.8%) |
| 65 to 74 Years | 17 (17.0%) | 56 (39.7%) |
| 75 Years and over | 20 (46.5%) | 6 (18.8%) |
Disability Class by Sex by Age in Ford City
Disability Class: Hearing Difficulty
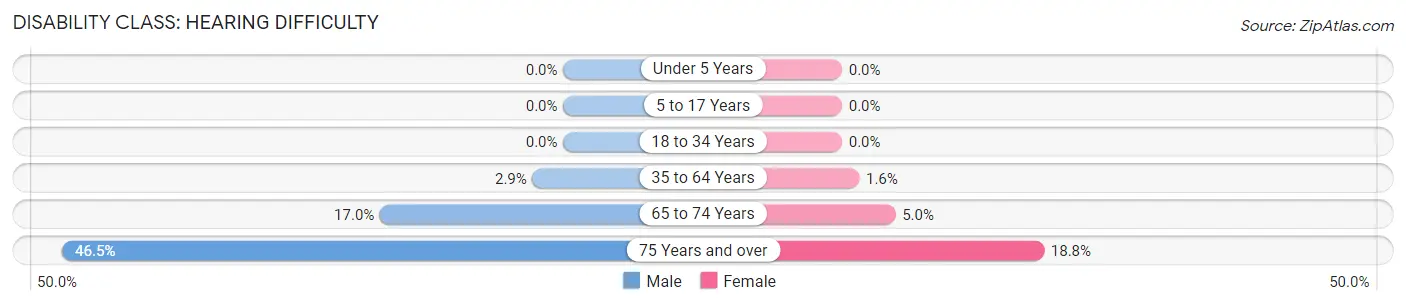
| Age Bracket | Male | Female |
| Under 5 Years | 0 (0.0%) | 0 (0.0%) |
| 5 to 17 Years | 0 (0.0%) | 0 (0.0%) |
| 18 to 34 Years | 0 (0.0%) | 0 (0.0%) |
| 35 to 64 Years | 19 (2.9%) | 9 (1.6%) |
| 65 to 74 Years | 17 (17.0%) | 7 (5.0%) |
| 75 Years and over | 20 (46.5%) | 6 (18.8%) |
Disability Class: Vision Difficulty
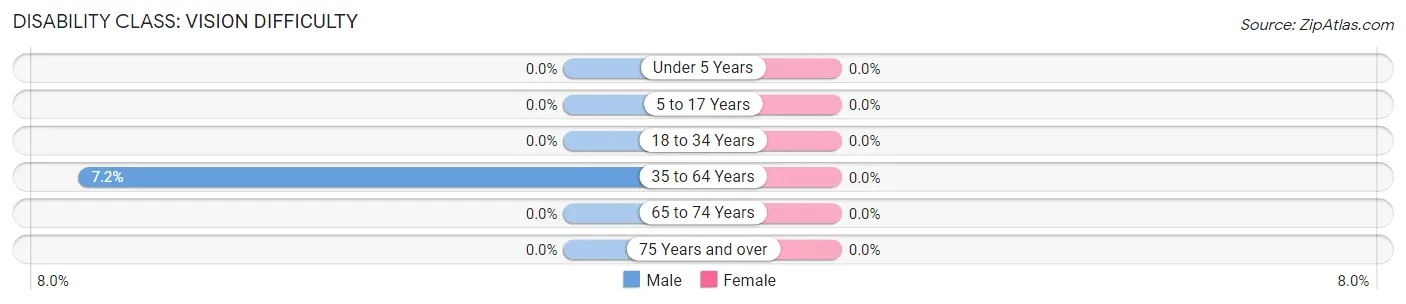
| Age Bracket | Male | Female |
| Under 5 Years | 0 (0.0%) | 0 (0.0%) |
| 5 to 17 Years | 0 (0.0%) | 0 (0.0%) |
| 18 to 34 Years | 0 (0.0%) | 0 (0.0%) |
| 35 to 64 Years | 48 (7.2%) | 0 (0.0%) |
| 65 to 74 Years | 0 (0.0%) | 0 (0.0%) |
| 75 Years and over | 0 (0.0%) | 0 (0.0%) |
Disability Class: Cognitive Difficulty
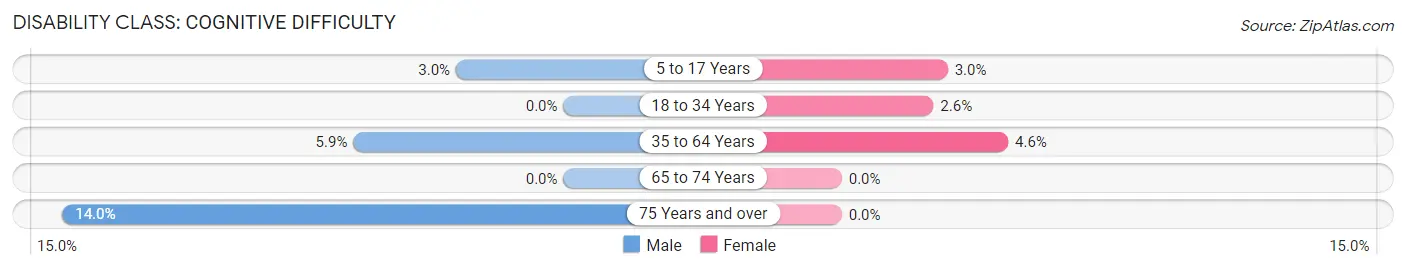
| Age Bracket | Male | Female |
| 5 to 17 Years | 17 (3.0%) | 12 (2.9%) |
| 18 to 34 Years | 0 (0.0%) | 20 (2.5%) |
| 35 to 64 Years | 39 (5.9%) | 26 (4.6%) |
| 65 to 74 Years | 0 (0.0%) | 0 (0.0%) |
| 75 Years and over | 6 (14.0%) | 0 (0.0%) |
Disability Class: Ambulatory Difficulty
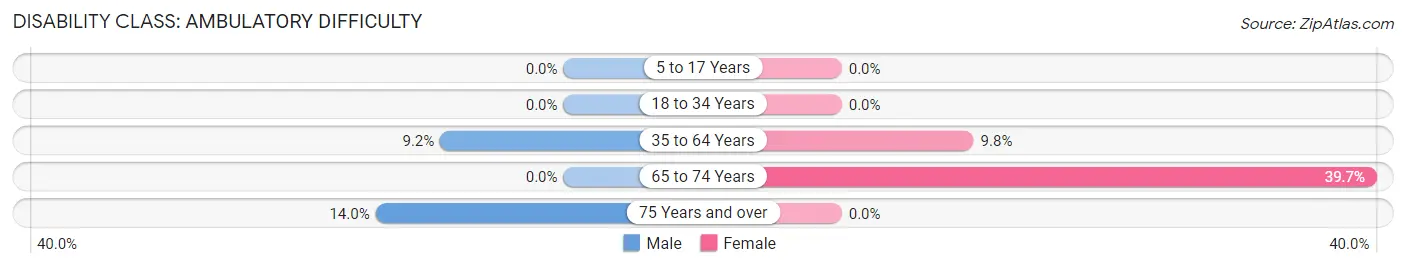
| Age Bracket | Male | Female |
| 5 to 17 Years | 0 (0.0%) | 0 (0.0%) |
| 18 to 34 Years | 0 (0.0%) | 0 (0.0%) |
| 35 to 64 Years | 61 (9.1%) | 55 (9.8%) |
| 65 to 74 Years | 0 (0.0%) | 56 (39.7%) |
| 75 Years and over | 6 (14.0%) | 0 (0.0%) |
Disability Class: Self-Care Difficulty
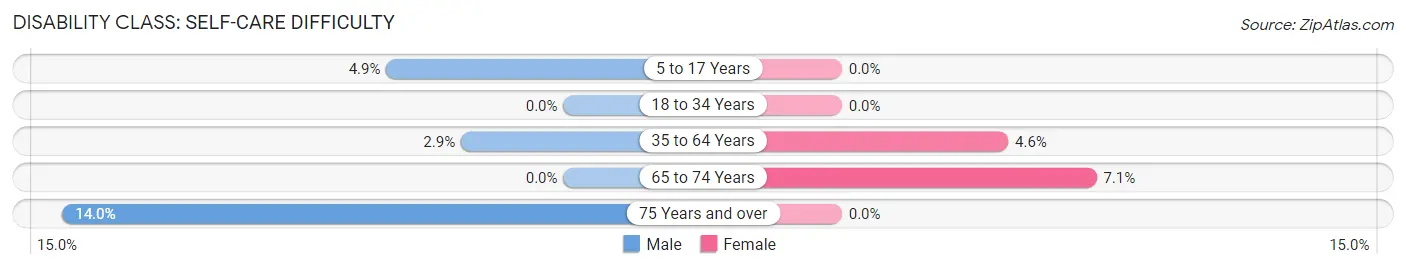
| Age Bracket | Male | Female |
| 5 to 17 Years | 28 (4.9%) | 0 (0.0%) |
| 18 to 34 Years | 0 (0.0%) | 0 (0.0%) |
| 35 to 64 Years | 19 (2.9%) | 26 (4.6%) |
| 65 to 74 Years | 0 (0.0%) | 10 (7.1%) |
| 75 Years and over | 6 (14.0%) | 0 (0.0%) |
Technology Access in Ford City
Computing Device Access in Ford City
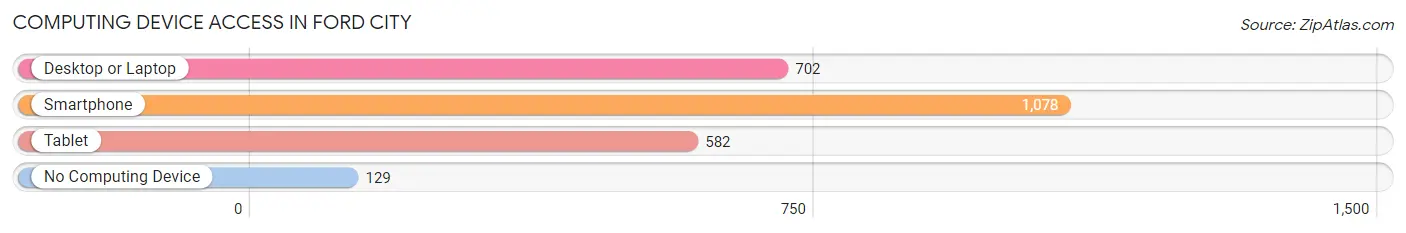
| Device Type | # Households | % Households |
| Desktop or Laptop | 702 | 55.8% |
| Smartphone | 1,078 | 85.7% |
| Tablet | 582 | 46.3% |
| No Computing Device | 129 | 10.2% |
| Total | 1,258 | 100.0% |
Internet Access in Ford City
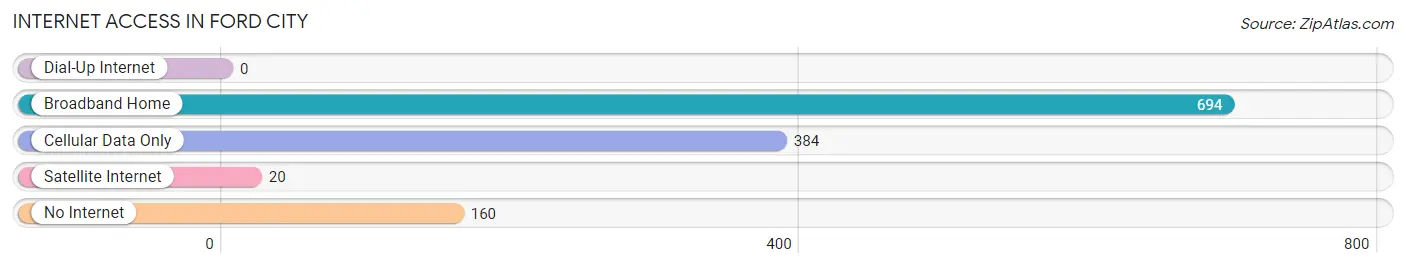
| Internet Type | # Households | % Households |
| Dial-Up Internet | 0 | 0.0% |
| Broadband Home | 694 | 55.2% |
| Cellular Data Only | 384 | 30.5% |
| Satellite Internet | 20 | 1.6% |
| No Internet | 160 | 12.7% |
| Total | 1,258 | 100.0% |
Ford City Summary
Ford City is a small unincorporated community located in Kern County, California. It is situated in the San Joaquin Valley, approximately 10 miles south of Bakersfield. The population of Ford City was estimated to be 1,845 in 2019.
History
Ford City was founded in the early 1900s by the Ford Motor Company. The company purchased land in the area to build a factory to produce Model T cars. The factory was completed in 1910 and the first Model T rolled off the assembly line in 1911. The factory was in operation until the early 1920s when it was closed due to a lack of demand for the Model T.
The town of Ford City was established in the early 1920s and was named after the Ford Motor Company. The town was a small farming community and was home to a few hundred people. The town was home to a post office, a general store, a school, and a few other businesses.
In the 1950s, the town began to grow as more people moved to the area. The population of Ford City increased to over 1,000 by the 1960s. The town was home to a variety of businesses, including a grocery store, a gas station, a hardware store, and a few restaurants.
Geography
Ford City is located in the San Joaquin Valley of California. It is situated in the southern part of Kern County, approximately 10 miles south of Bakersfield. The town is located at an elevation of approximately 1,000 feet above sea level.
The climate in Ford City is hot and dry in the summer months and mild in the winter months. The average high temperature in the summer is around 95 degrees Fahrenheit and the average low temperature in the winter is around 40 degrees Fahrenheit.
Economy
The economy of Ford City is largely based on agriculture. The town is home to a variety of farms that produce a variety of crops, including grapes, almonds, and cotton. The town is also home to a few small businesses, including a grocery store, a gas station, and a hardware store.
Demographics
The population of Ford City was estimated to be 1,845 in 2019. The town is predominantly Hispanic, with approximately 75% of the population identifying as Hispanic or Latino. The median household income in Ford City is $41,000, which is lower than the national average. The poverty rate in Ford City is approximately 20%, which is higher than the national average.
Conclusion
Ford City is a small unincorporated community located in Kern County, California. It was founded in the early 1900s by the Ford Motor Company and was home to a few hundred people in the early 1920s. The population of Ford City has grown to over 1,800 in 2019 and the town is predominantly Hispanic. The economy of Ford City is largely based on agriculture and the town is home to a variety of small businesses.
Common Questions
What is Per Capita Income in Ford City?
Per Capita income in Ford City is $15,888.
What is the Median Family Income in Ford City?
Median Family Income in Ford City is $43,162.
What is the Median Household income in Ford City?
Median Household Income in Ford City is $42,826.
What is Income or Wage Gap in Ford City?
Income or Wage Gap in Ford City is 20.1%.
Women in Ford City earn 79.9 cents for every dollar earned by a man.
What is Inequality or Gini Index in Ford City?
Inequality or Gini Index in Ford City is 0.44.
What is the Total Population of Ford City?
Total Population of Ford City is 4,357.
What is the Total Male Population of Ford City?
Total Male Population of Ford City is 2,233.
What is the Total Female Population of Ford City?
Total Female Population of Ford City is 2,124.
What is the Ratio of Males per 100 Females in Ford City?
There are 105.13 Males per 100 Females in Ford City.
What is the Ratio of Females per 100 Males in Ford City?
There are 95.12 Females per 100 Males in Ford City.
What is the Median Population Age in Ford City?
Median Population Age in Ford City is 25.7 Years.
What is the Average Family Size in Ford City
Average Family Size in Ford City is 3.7 People.
What is the Average Household Size in Ford City
Average Household Size in Ford City is 3.5 People.
How Large is the Labor Force in Ford City?
There are 1,911 People in the Labor Forcein in Ford City.
What is the Percentage of People in the Labor Force in Ford City?
61.4% of People are in the Labor Force in Ford City.
What is the Unemployment Rate in Ford City?
Unemployment Rate in Ford City is 20.8%.