Fields Landing, CA Map & Demographics
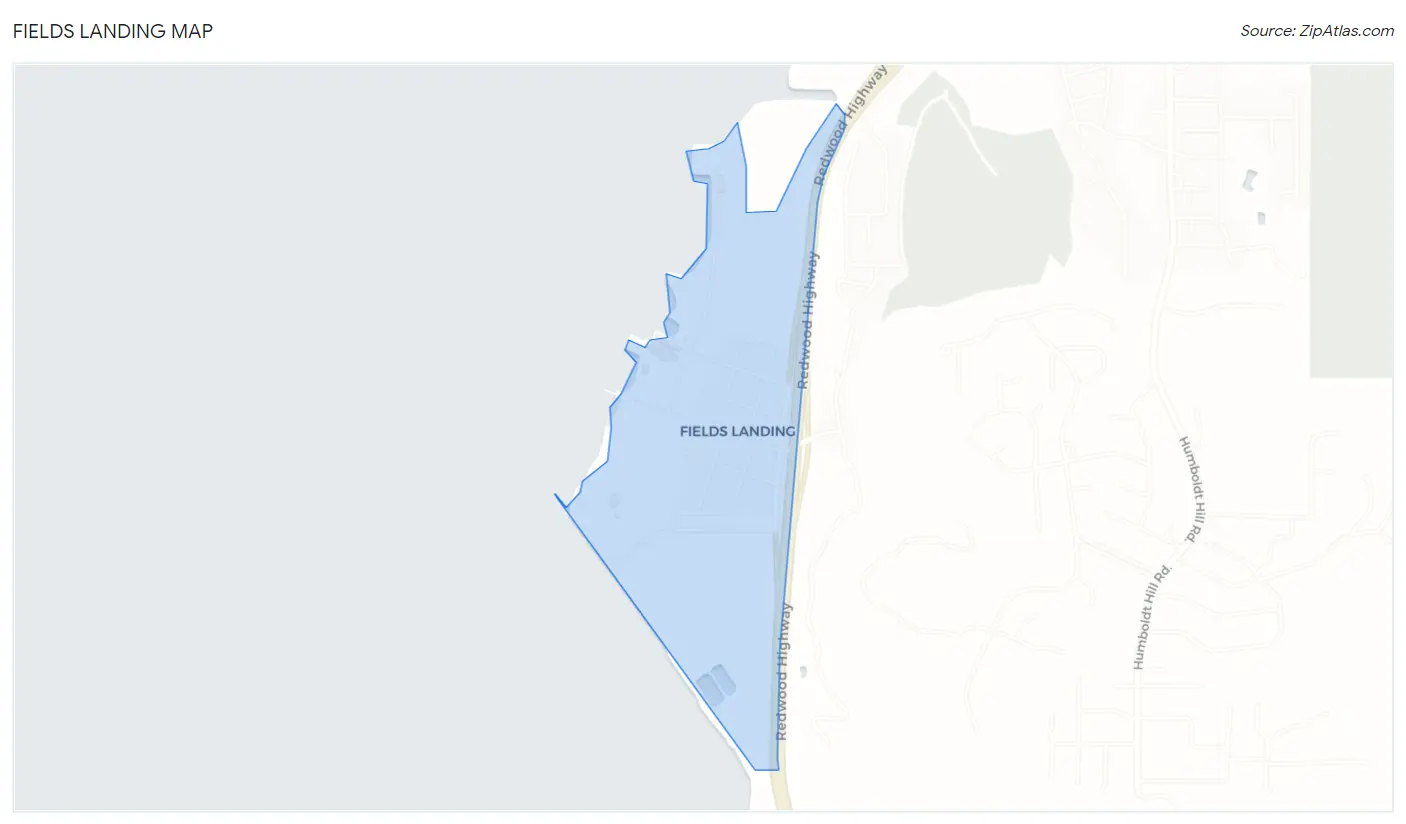
Fields Landing Map
Fields Landing Overview
$20,091
PER CAPITA INCOME
$71,310
AVG HOUSEHOLD INCOME
0.04
INEQUALITY / GINI INDEX
629
TOTAL POPULATION
231
MALE POPULATION
398
FEMALE POPULATION
58.04
MALES / 100 FEMALES
172.29
FEMALES / 100 MALES
27.4
MEDIAN AGE
2.2
AVG FAMILY SIZE
4.2
AVG HOUSEHOLD SIZE
411
LABOR FORCE [ PEOPLE ]
65.3%
PERCENT IN LABOR FORCE
20.7%
UNEMPLOYMENT RATE
Fields Landing Zip Codes
Income in Fields Landing
Income Overview in Fields Landing
| Characteristic | Number | Measure |
| Per Capita Income | 629 | $20,091 |
| Median Family Income | 57 | $0 |
| Mean Family Income | 57 | $0 |
| Median Household Income | 148 | $71,310 |
| Mean Household Income | 148 | $69,393 |
| Income Deficit | 57 | $0 |
| Wage / Income Gap (%) | 629 | 0.00% |
| Wage / Income Gap ($) | 629 | 100.00¢ per $1 |
| Gini / Inequality Index | 629 | 0.04 |
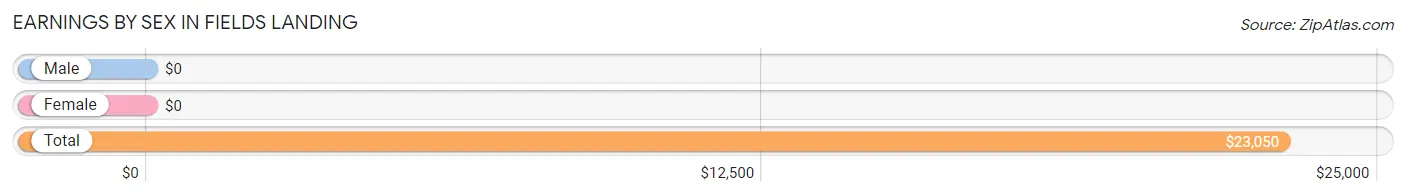
Earnings by Sex in Fields Landing
| Sex | Number | Average Earnings |
| Male | 162 (34.1%) | $0 |
| Female | 313 (65.9%) | $0 |
| Total | 475 (100.0%) | $23,050 |
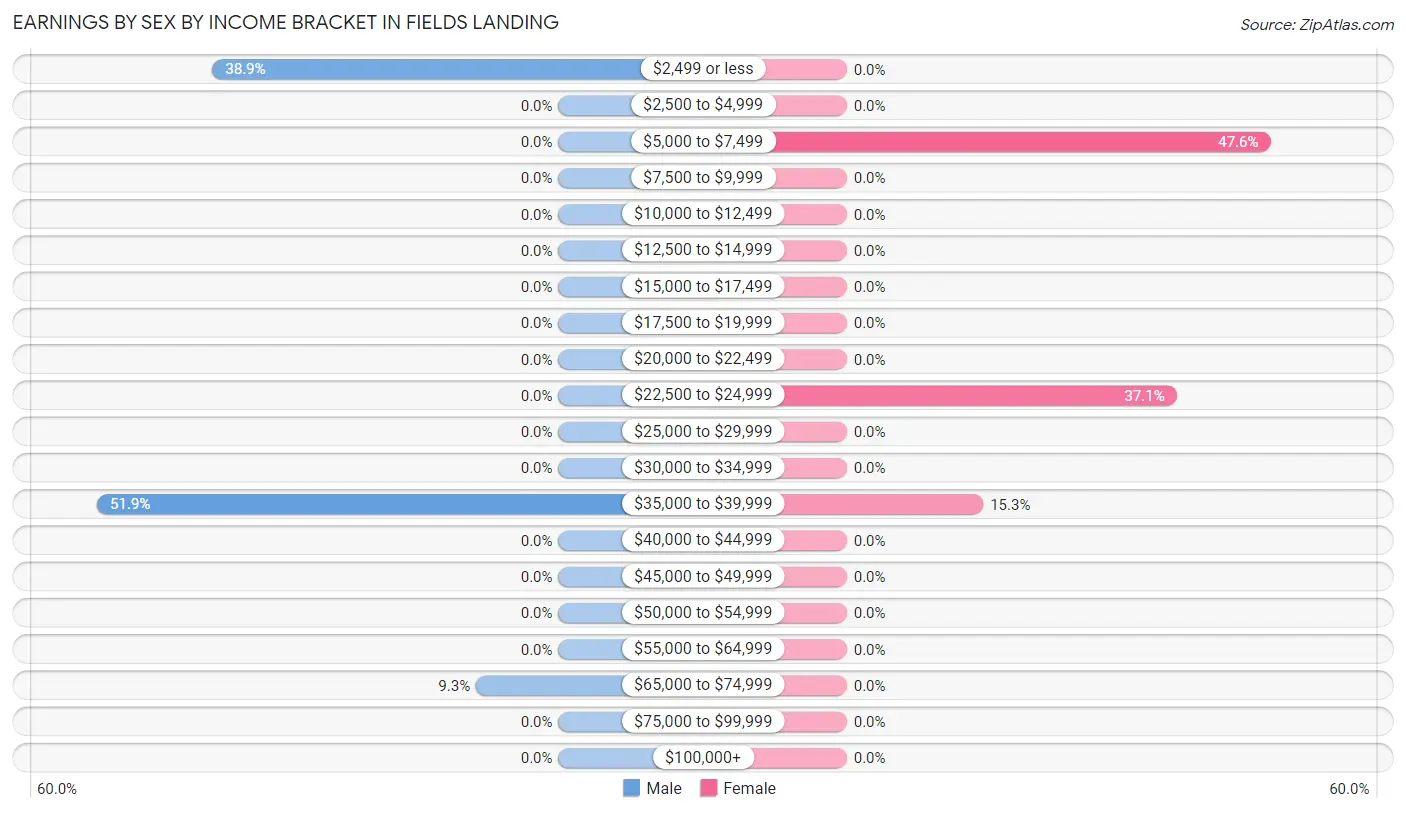
Earnings by Sex by Income Bracket in Fields Landing
The most common earnings brackets in Fields Landing are $35,000 to $39,999 for men (84 | 51.8%) and $5,000 to $7,499 for women (149 | 47.6%).
| Income | Male | Female |
| $2,499 or less | 63 (38.9%) | 0 (0.0%) |
| $2,500 to $4,999 | 0 (0.0%) | 0 (0.0%) |
| $5,000 to $7,499 | 0 (0.0%) | 149 (47.6%) |
| $7,500 to $9,999 | 0 (0.0%) | 0 (0.0%) |
| $10,000 to $12,499 | 0 (0.0%) | 0 (0.0%) |
| $12,500 to $14,999 | 0 (0.0%) | 0 (0.0%) |
| $15,000 to $17,499 | 0 (0.0%) | 0 (0.0%) |
| $17,500 to $19,999 | 0 (0.0%) | 0 (0.0%) |
| $20,000 to $22,499 | 0 (0.0%) | 0 (0.0%) |
| $22,500 to $24,999 | 0 (0.0%) | 116 (37.1%) |
| $25,000 to $29,999 | 0 (0.0%) | 0 (0.0%) |
| $30,000 to $34,999 | 0 (0.0%) | 0 (0.0%) |
| $35,000 to $39,999 | 84 (51.8%) | 48 (15.3%) |
| $40,000 to $44,999 | 0 (0.0%) | 0 (0.0%) |
| $45,000 to $49,999 | 0 (0.0%) | 0 (0.0%) |
| $50,000 to $54,999 | 0 (0.0%) | 0 (0.0%) |
| $55,000 to $64,999 | 0 (0.0%) | 0 (0.0%) |
| $65,000 to $74,999 | 15 (9.3%) | 0 (0.0%) |
| $75,000 to $99,999 | 0 (0.0%) | 0 (0.0%) |
| $100,000+ | 0 (0.0%) | 0 (0.0%) |
| Total | 162 (100.0%) | 313 (100.0%) |
Earnings by Sex by Educational Attainment in Fields Landing
| Educational Attainment | Male Income | Female Income |
| Less than High School | - | - |
| High School Diploma | - | - |
| College or Associate's Degree | - | - |
| Bachelor's Degree | - | - |
| Graduate Degree | - | - |
| Total | - | - |
Family Income in Fields Landing
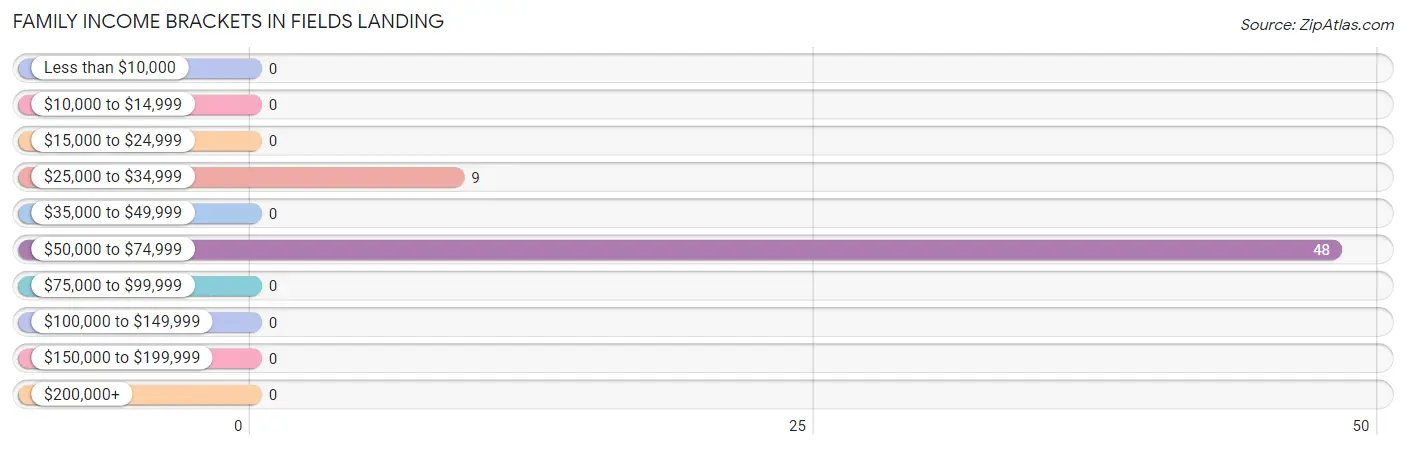
Family Income Brackets in Fields Landing
According to the Fields Landing family income data, there are 48 families falling into the $50,000 to $74,999 income range, which is the most common income bracket and makes up 84.2% of all families.
| Income Bracket | # Families | % Families |
| Less than $10,000 | 0 | 0.0% |
| $10,000 to $14,999 | 0 | 0.0% |
| $15,000 to $24,999 | 0 | 0.0% |
| $25,000 to $34,999 | 9 | 15.8% |
| $35,000 to $49,999 | 0 | 0.0% |
| $50,000 to $74,999 | 48 | 84.2% |
| $75,000 to $99,999 | 0 | 0.0% |
| $100,000 to $149,999 | 0 | 0.0% |
| $150,000 to $199,999 | 0 | 0.0% |
| $200,000+ | 0 | 0.0% |
Family Income by Famaliy Size in Fields Landing
| Income Bracket | # Families | Median Income |
| 2-Person Families | 57 (100.0%) | $0 |
| 3-Person Families | 0 (0.0%) | $0 |
| 4-Person Families | 0 (0.0%) | $0 |
| 5-Person Families | 0 (0.0%) | $0 |
| 6-Person Families | 0 (0.0%) | $0 |
| 7+ Person Families | 0 (0.0%) | $0 |
| Total | 57 (100.0%) | $0 |
Family Income by Number of Earners in Fields Landing
| Number of Earners | # Families | Median Income |
| No Earners | 9 (15.8%) | $0 |
| 1 Earner | 0 (0.0%) | $0 |
| 2 Earners | 48 (84.2%) | $0 |
| 3+ Earners | 0 (0.0%) | $0 |
| Total | 57 (100.0%) | $0 |
Household Income in Fields Landing
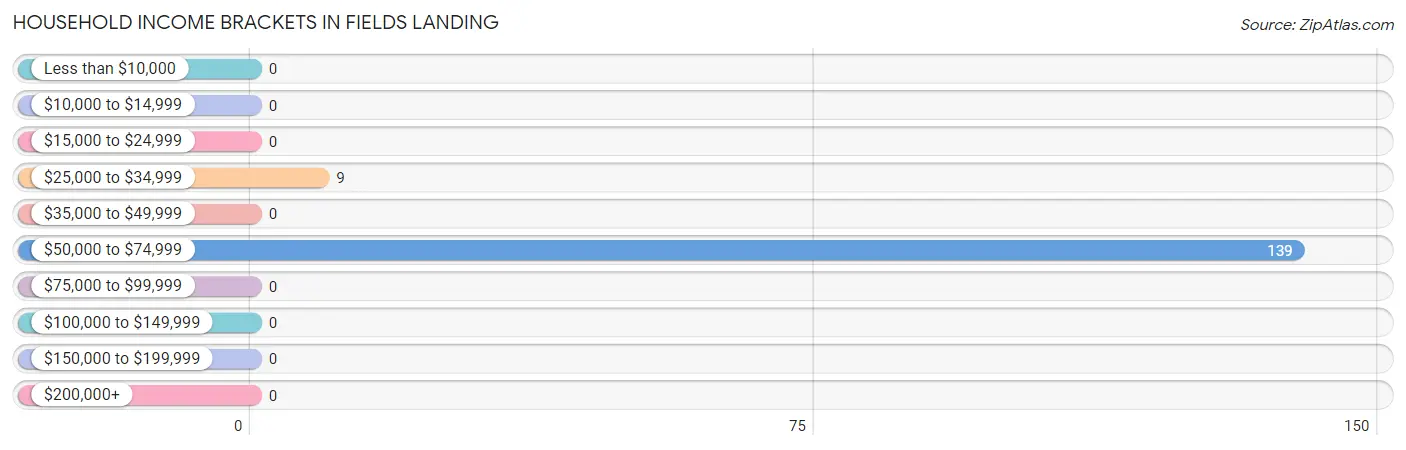
Household Income Brackets in Fields Landing
With 139 households falling in the category, the $50,000 to $74,999 income range is the most frequent in Fields Landing, accounting for 93.9% of all households.
| Income Bracket | # Households | % Households |
| Less than $10,000 | 0 | 0.0% |
| $10,000 to $14,999 | 0 | 0.0% |
| $15,000 to $24,999 | 0 | 0.0% |
| $25,000 to $34,999 | 9 | 6.1% |
| $35,000 to $49,999 | 0 | 0.0% |
| $50,000 to $74,999 | 139 | 93.9% |
| $75,000 to $99,999 | 0 | 0.0% |
| $100,000 to $149,999 | 0 | 0.0% |
| $150,000 to $199,999 | 0 | 0.0% |
| $200,000+ | 0 | 0.0% |
Household Income by Householder Age in Fields Landing
| Income Bracket | # Households | Median Income |
| 15 to 24 Years | 0 (0.0%) | $0 |
| 25 to 44 Years | 91 (61.5%) | $0 |
| 45 to 64 Years | 9 (6.1%) | $0 |
| 65+ Years | 48 (32.4%) | $0 |
| Total | 148 (100.0%) | $71,310 |
Poverty in Fields Landing
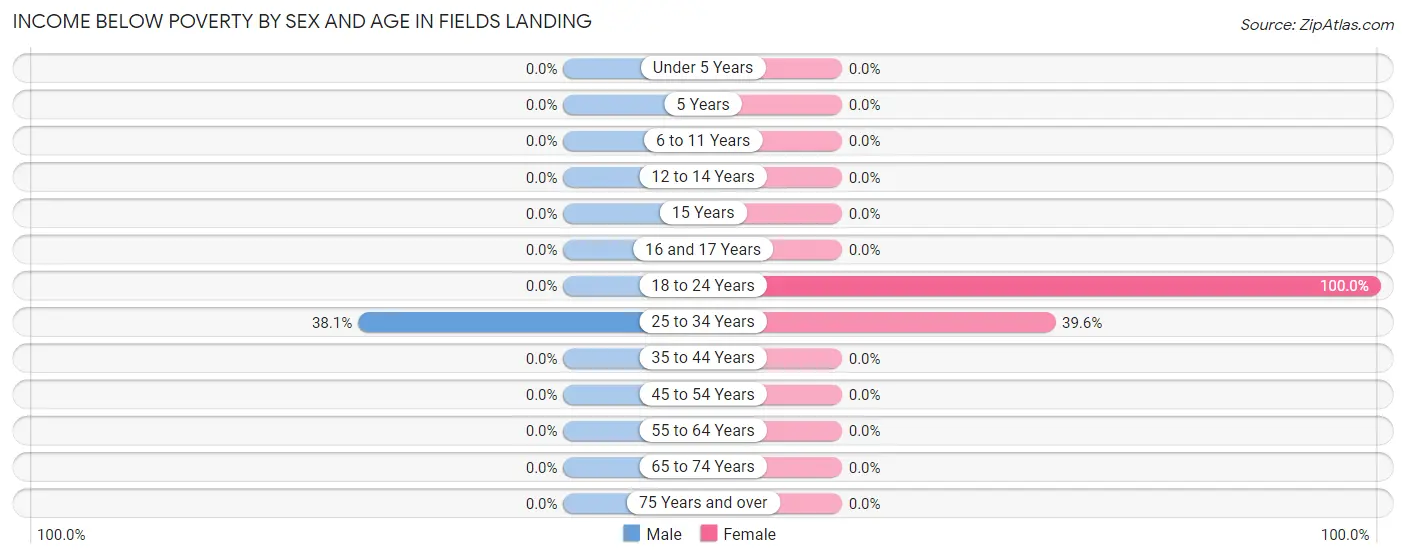
Income Below Poverty by Sex and Age in Fields Landing
With 26.4% poverty level for males and 56.5% for females among the residents of Fields Landing, 25 to 34 year old males and 18 to 24 year old females are the most vulnerable to poverty, with 61 males (38.1%) and 149 females (100.0%) in their respective age groups living below the poverty level.
| Age Bracket | Male | Female |
| Under 5 Years | 0 (0.0%) | 0 (0.0%) |
| 5 Years | 0 (0.0%) | 0 (0.0%) |
| 6 to 11 Years | 0 (0.0%) | 0 (0.0%) |
| 12 to 14 Years | 0 (0.0%) | 0 (0.0%) |
| 15 Years | 0 (0.0%) | 0 (0.0%) |
| 16 and 17 Years | 0 (0.0%) | 0 (0.0%) |
| 18 to 24 Years | 0 (0.0%) | 149 (100.0%) |
| 25 to 34 Years | 61 (38.1%) | 76 (39.6%) |
| 35 to 44 Years | 0 (0.0%) | 0 (0.0%) |
| 45 to 54 Years | 0 (0.0%) | 0 (0.0%) |
| 55 to 64 Years | 0 (0.0%) | 0 (0.0%) |
| 65 to 74 Years | 0 (0.0%) | 0 (0.0%) |
| 75 Years and over | 0 (0.0%) | 0 (0.0%) |
| Total | 61 (26.4%) | 225 (56.5%) |
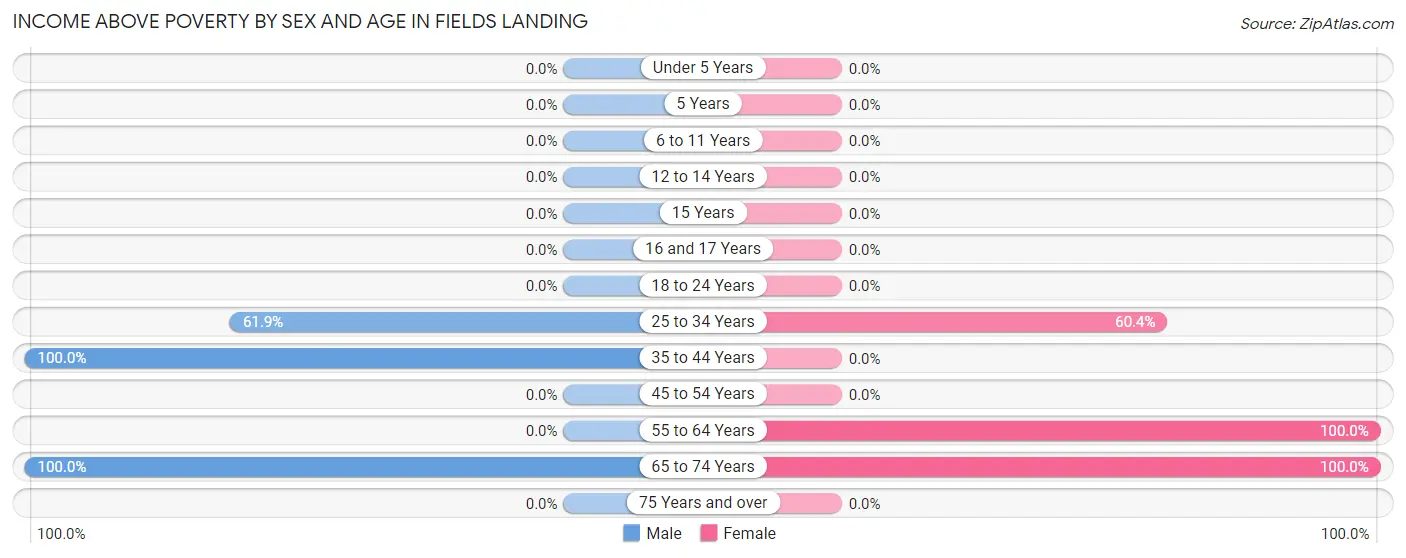
Income Above Poverty by Sex and Age in Fields Landing
According to the poverty statistics in Fields Landing, males aged 35 to 44 years and females aged 55 to 64 years are the age groups that are most secure financially, with 100.0% of males and 100.0% of females in these age groups living above the poverty line.
| Age Bracket | Male | Female |
| Under 5 Years | 0 (0.0%) | 0 (0.0%) |
| 5 Years | 0 (0.0%) | 0 (0.0%) |
| 6 to 11 Years | 0 (0.0%) | 0 (0.0%) |
| 12 to 14 Years | 0 (0.0%) | 0 (0.0%) |
| 15 Years | 0 (0.0%) | 0 (0.0%) |
| 16 and 17 Years | 0 (0.0%) | 0 (0.0%) |
| 18 to 24 Years | 0 (0.0%) | 0 (0.0%) |
| 25 to 34 Years | 99 (61.9%) | 116 (60.4%) |
| 35 to 44 Years | 63 (100.0%) | 0 (0.0%) |
| 45 to 54 Years | 0 (0.0%) | 0 (0.0%) |
| 55 to 64 Years | 0 (0.0%) | 9 (100.0%) |
| 65 to 74 Years | 8 (100.0%) | 48 (100.0%) |
| 75 Years and over | 0 (0.0%) | 0 (0.0%) |
| Total | 170 (73.6%) | 173 (43.5%) |
Income Below Poverty Among Married-Couple Families in Fields Landing
| Children | Above Poverty | Below Poverty |
| No Children | 9 (100.0%) | 0 (0.0%) |
| 1 or 2 Children | 0 (0.0%) | 0 (0.0%) |
| 3 or 4 Children | 0 (0.0%) | 0 (0.0%) |
| 5 or more Children | 0 (0.0%) | 0 (0.0%) |
| Total | 9 (100.0%) | 0 (0.0%) |
Income Below Poverty Among Single-Parent Households in Fields Landing
| Children | Single Father | Single Mother |
| No Children | 0 (0.0%) | 0 (0.0%) |
| 1 or 2 Children | 0 (0.0%) | 0 (0.0%) |
| 3 or 4 Children | 0 (0.0%) | 0 (0.0%) |
| 5 or more Children | 0 (0.0%) | 0 (0.0%) |
| Total | 0 (0.0%) | 0 (0.0%) |
Income Below Poverty Among Married-Couple vs Single-Parent Households in Fields Landing
| Children | Married-Couple Families | Single-Parent Households |
| No Children | 0 (0.0%) | 0 (0.0%) |
| 1 or 2 Children | 0 (0.0%) | 0 (0.0%) |
| 3 or 4 Children | 0 (0.0%) | 0 (0.0%) |
| 5 or more Children | 0 (0.0%) | 0 (0.0%) |
| Total | 0 (0.0%) | 0 (0.0%) |
Race in Fields Landing
The most populous races in Fields Landing are White / Caucasian (553 | 87.9%), and Black / African American (76 | 12.1%).
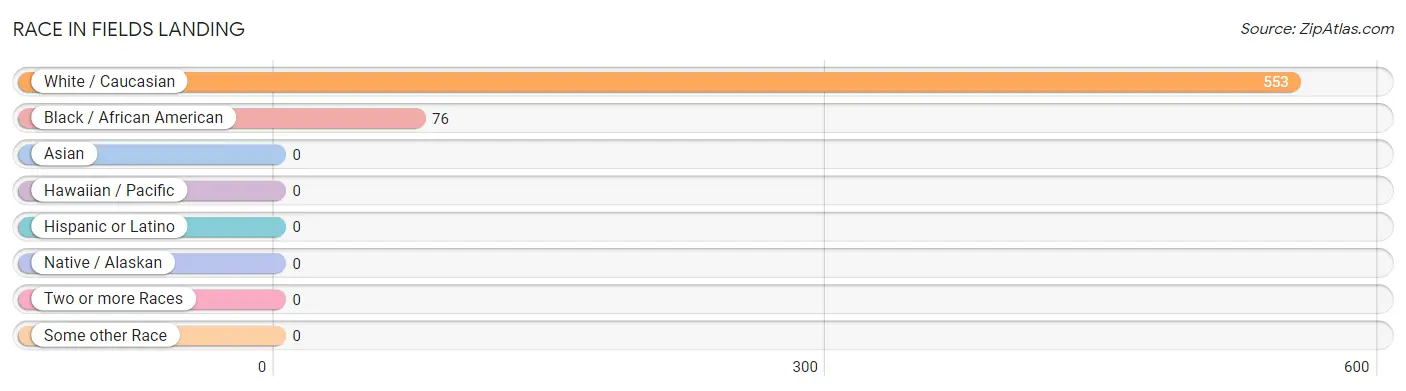
| Race | # Population | % Population |
| Asian | 0 | 0.0% |
| Black / African American | 76 | 12.1% |
| Hawaiian / Pacific | 0 | 0.0% |
| Hispanic or Latino | 0 | 0.0% |
| Native / Alaskan | 0 | 0.0% |
| White / Caucasian | 553 | 87.9% |
| Two or more Races | 0 | 0.0% |
| Some other Race | 0 | 0.0% |
| Total | 629 | 100.0% |
Ancestry in Fields Landing
The most populous ancestries reported in Fields Landing are English (111 | 17.6%), Polish (84 | 13.4%), Scottish (71 | 11.3%), Danish (15 | 2.4%), and Norwegian (15 | 2.4%), together accounting for 47.0% of all Fields Landing residents.
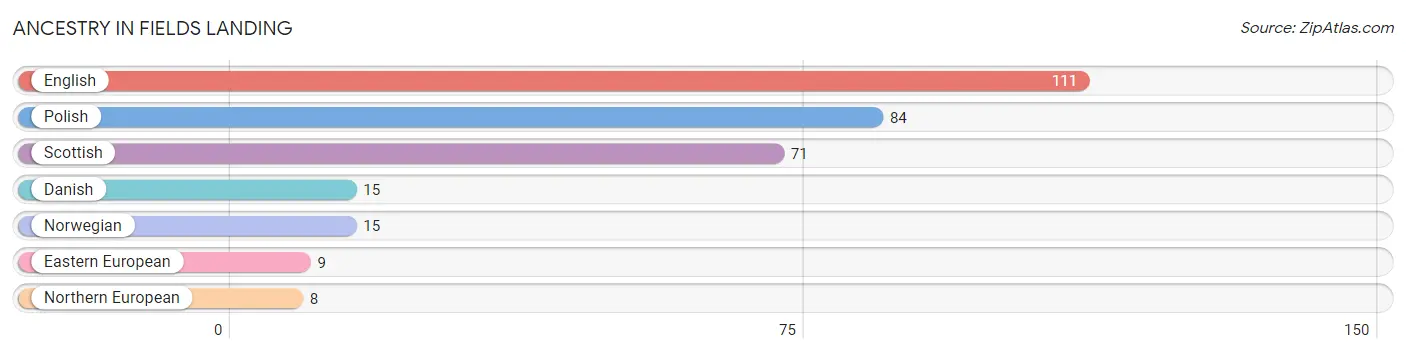
| Ancestry | # Population | % Population |
| Danish | 15 | 2.4% |
| Eastern European | 9 | 1.4% |
| English | 111 | 17.6% |
| Northern European | 8 | 1.3% |
| Norwegian | 15 | 2.4% |
| Polish | 84 | 13.4% |
| Scottish | 71 | 11.3% | View All 7 Rows |
Immigrants in Fields Landing

| Immigration Origin | # Population | % Population | View All 0 Rows |
Sex and Age in Fields Landing
Sex and Age in Fields Landing
The most populous age groups in Fields Landing are 25 to 29 Years (99 | 42.9%) for men and 25 to 29 Years (192 | 48.2%) for women.
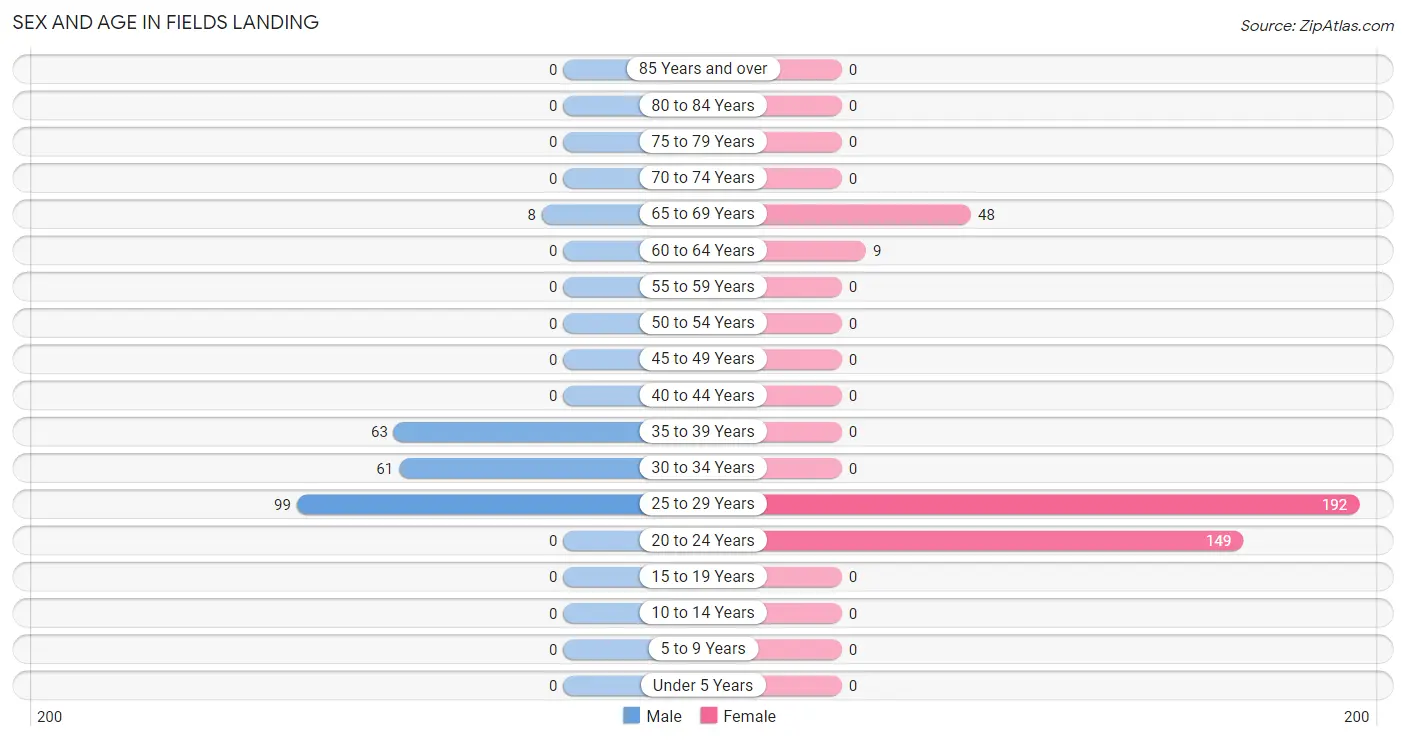
| Age Bracket | Male | Female |
| Under 5 Years | 0 (0.0%) | 0 (0.0%) |
| 5 to 9 Years | 0 (0.0%) | 0 (0.0%) |
| 10 to 14 Years | 0 (0.0%) | 0 (0.0%) |
| 15 to 19 Years | 0 (0.0%) | 0 (0.0%) |
| 20 to 24 Years | 0 (0.0%) | 149 (37.4%) |
| 25 to 29 Years | 99 (42.9%) | 192 (48.2%) |
| 30 to 34 Years | 61 (26.4%) | 0 (0.0%) |
| 35 to 39 Years | 63 (27.3%) | 0 (0.0%) |
| 40 to 44 Years | 0 (0.0%) | 0 (0.0%) |
| 45 to 49 Years | 0 (0.0%) | 0 (0.0%) |
| 50 to 54 Years | 0 (0.0%) | 0 (0.0%) |
| 55 to 59 Years | 0 (0.0%) | 0 (0.0%) |
| 60 to 64 Years | 0 (0.0%) | 9 (2.3%) |
| 65 to 69 Years | 8 (3.5%) | 48 (12.1%) |
| 70 to 74 Years | 0 (0.0%) | 0 (0.0%) |
| 75 to 79 Years | 0 (0.0%) | 0 (0.0%) |
| 80 to 84 Years | 0 (0.0%) | 0 (0.0%) |
| 85 Years and over | 0 (0.0%) | 0 (0.0%) |
| Total | 231 (100.0%) | 398 (100.0%) |
Families and Households in Fields Landing
Median Family Size in Fields Landing
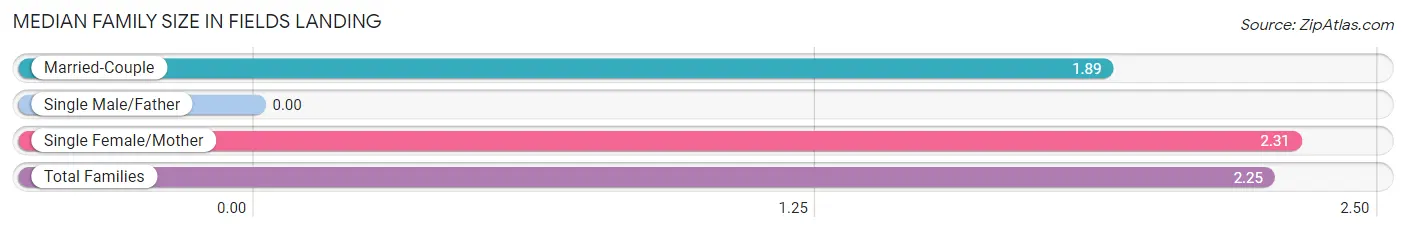
| Family Type | # Families | Family Size |
| Married-Couple | 9 (15.8%) | 1.89 |
| Single Male/Father | 0 (0.0%) | - |
| Single Female/Mother | 48 (84.2%) | 2.31 |
| Total Families | 57 (100.0%) | 2.25 |
Median Household Size in Fields Landing
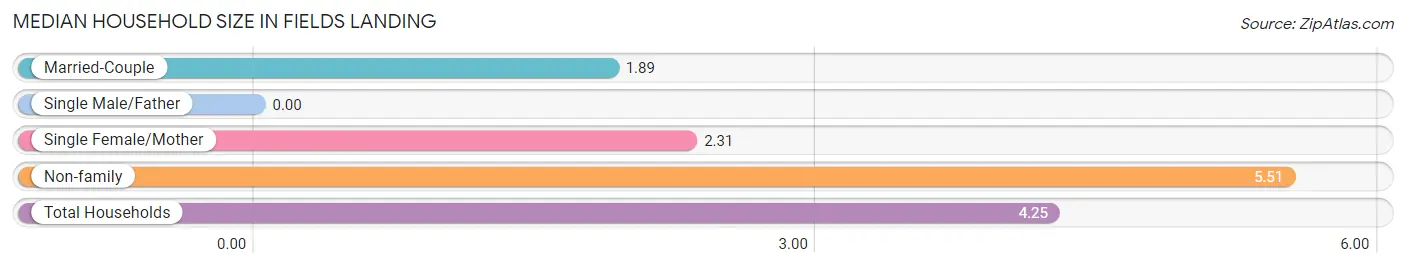
| Household Type | # Households | Household Size |
| Married-Couple | 9 (6.1%) | 1.89 |
| Single Male/Father | 0 (0.0%) | - |
| Single Female/Mother | 48 (32.4%) | 2.31 |
| Non-family | 91 (61.5%) | 5.51 |
| Total Households | 148 (100.0%) | 4.25 |
Household Size by Marriage Status in Fields Landing
Out of a total of 148 households in Fields Landing, 57 (38.5%) are family households, while 91 (61.5%) are nonfamily households. The most numerous type of family households are 2-person households, comprising 57, and the most common type of nonfamily households are 5-person households, comprising 76.
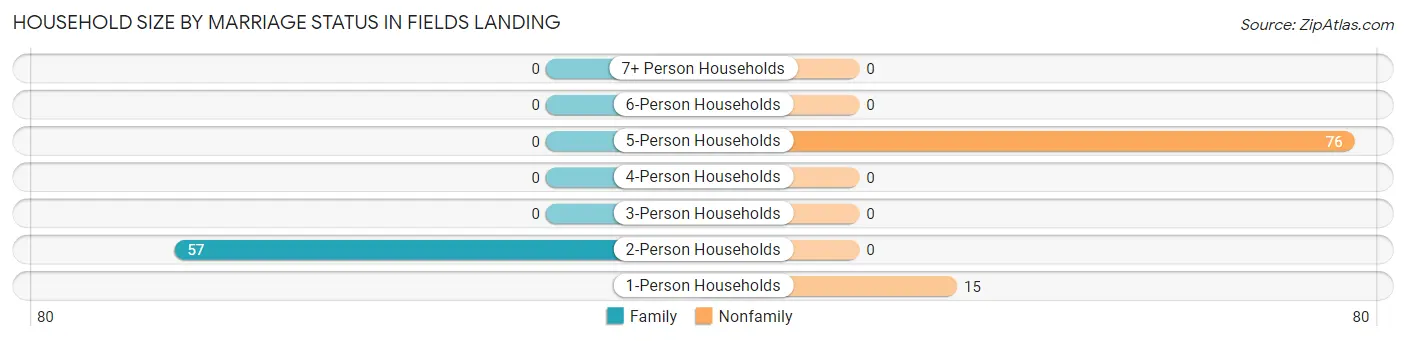
| Household Size | Family Households | Nonfamily Households |
| 1-Person Households | - | 15 (10.1%) |
| 2-Person Households | 57 (38.5%) | 0 (0.0%) |
| 3-Person Households | 0 (0.0%) | 0 (0.0%) |
| 4-Person Households | 0 (0.0%) | 0 (0.0%) |
| 5-Person Households | 0 (0.0%) | 76 (51.3%) |
| 6-Person Households | 0 (0.0%) | 0 (0.0%) |
| 7+ Person Households | 0 (0.0%) | 0 (0.0%) |
| Total | 57 (38.5%) | 91 (61.5%) |
Female Fertility in Fields Landing
Fertility by Age in Fields Landing
| Age Bracket | Women with Births | Births / 1,000 Women |
| 15 to 19 years | 0 (0.0%) | 0.0 |
| 20 to 34 years | 0 (0.0%) | 0.0 |
| 35 to 50 years | 0 (0.0%) | 0.0 |
| Total | 0 (0.0%) | 0.0 |
Fertility by Age by Marriage Status in Fields Landing
| Age Bracket | Married | Unmarried |
| 15 to 19 years | 0 (0.0%) | 0 (0.0%) |
| 20 to 34 years | 0 (0.0%) | 0 (0.0%) |
| 35 to 50 years | 0 (0.0%) | 0 (0.0%) |
| Total | 0 (0.0%) | 0 (0.0%) |
Fertility by Education in Fields Landing
| Educational Attainment | Women with Births | Births / 1,000 Women |
| Less than High School | 0 (0.0%) | 0.0 |
| High School Diploma | 0 (0.0%) | 0.0 |
| College or Associate's Degree | 0 (0.0%) | 0.0 |
| Bachelor's Degree | 0 (0.0%) | 0.0 |
| Graduate Degree | 0 (0.0%) | 0.0 |
| Total | 0 (0.0%) | 0.0 |
Fertility by Education by Marriage Status in Fields Landing
| Educational Attainment | Married | Unmarried |
| Less than High School | 0 (0.0%) | 0 (0.0%) |
| High School Diploma | 0 (0.0%) | 0 (0.0%) |
| College or Associate's Degree | 0 (0.0%) | 0 (0.0%) |
| Bachelor's Degree | 0 (0.0%) | 0 (0.0%) |
| Graduate Degree | 0 (0.0%) | 0 (0.0%) |
| Total | 0 (0.0%) | 0 (0.0%) |
Employment Characteristics in Fields Landing
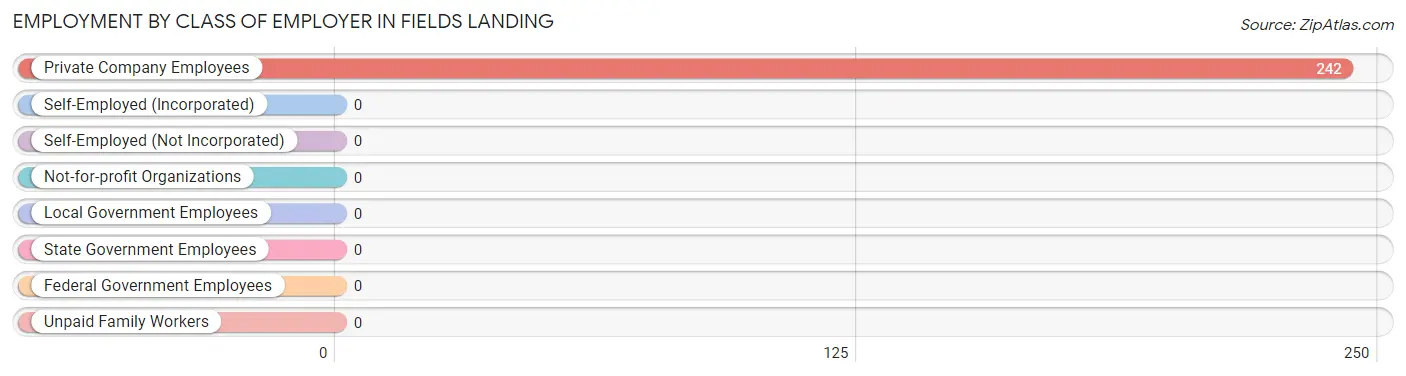
Employment by Class of Employer in Fields Landing
Among the 242 employed individuals in Fields Landing, , and private company employees (242 | 100.0%) make up the most common classes of employment.
| Employer Class | # Employees | % Employees |
| Private Company Employees | 242 | 100.0% |
| Self-Employed (Incorporated) | 0 | 0.0% |
| Self-Employed (Not Incorporated) | 0 | 0.0% |
| Not-for-profit Organizations | 0 | 0.0% |
| Local Government Employees | 0 | 0.0% |
| State Government Employees | 0 | 0.0% |
| Federal Government Employees | 0 | 0.0% |
| Unpaid Family Workers | 0 | 0.0% |
| Total | 242 | 100.0% |
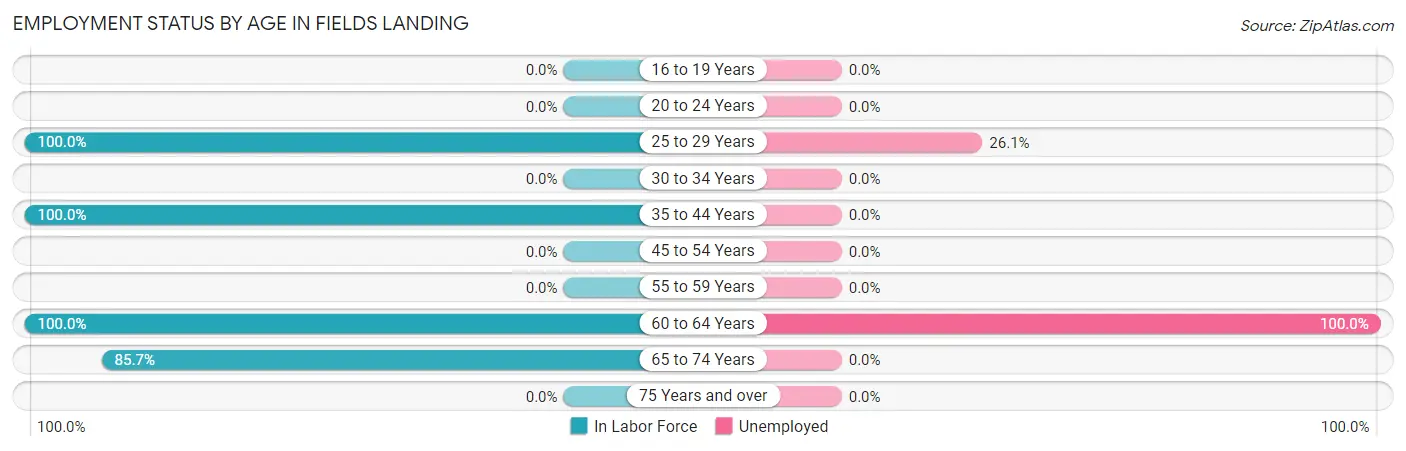
Employment Status by Age in Fields Landing
According to the labor force statistics for Fields Landing, out of the total population over 16 years of age (629), 65.3% or 411 individuals are in the labor force, with 20.7% or 85 of them unemployed. The age group with the highest labor force participation rate is 25 to 29 years, with 100.0% or 291 individuals in the labor force. Within the labor force, the 60 to 64 years age range has the highest percentage of unemployed individuals, with 100.0% or 9 of them being unemployed.
| Age Bracket | In Labor Force | Unemployed |
| 16 to 19 Years | 0 (0.0%) | 0 (0.0%) |
| 20 to 24 Years | 0 (0.0%) | 0 (0.0%) |
| 25 to 29 Years | 291 (100.0%) | 76 (26.1%) |
| 30 to 34 Years | 0 (0.0%) | 0 (0.0%) |
| 35 to 44 Years | 63 (100.0%) | 0 (0.0%) |
| 45 to 54 Years | 0 (0.0%) | 0 (0.0%) |
| 55 to 59 Years | 0 (0.0%) | 0 (0.0%) |
| 60 to 64 Years | 9 (100.0%) | 9 (100.0%) |
| 65 to 74 Years | 48 (85.7%) | 0 (0.0%) |
| 75 Years and over | 0 (0.0%) | 0 (0.0%) |
| Total | 411 (65.3%) | 85 (20.7%) |
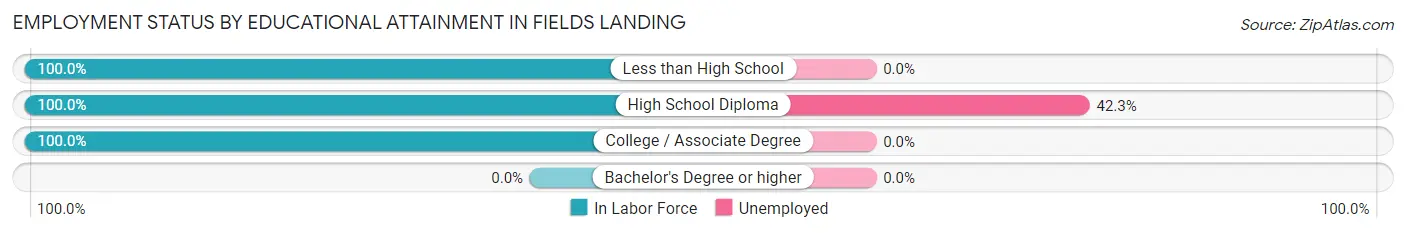
Employment Status by Educational Attainment in Fields Landing
According to labor force statistics for Fields Landing, 85.6% of individuals (363) out of the total population between 25 and 64 years of age (424) are in the labor force, with 23.4% or 85 of them being unemployed. The group with the highest labor force participation rate are those with the educational attainment of less than high school, with 100.0% or 63 individuals in the labor force. Within the labor force, individuals with high school diploma education have the highest percentage of unemployment, with 42.3% or 85 of them being unemployed.
| Educational Attainment | In Labor Force | Unemployed |
| Less than High School | 63 (100.0%) | 0 (0.0%) |
| High School Diploma | 201 (100.0%) | 85 (42.3%) |
| College / Associate Degree | 99 (100.0%) | 0 (0.0%) |
| Bachelor's Degree or higher | 0 (0.0%) | 0 (0.0%) |
| Total | 363 (85.6%) | 99 (23.4%) |
Employment Occupations by Sex in Fields Landing
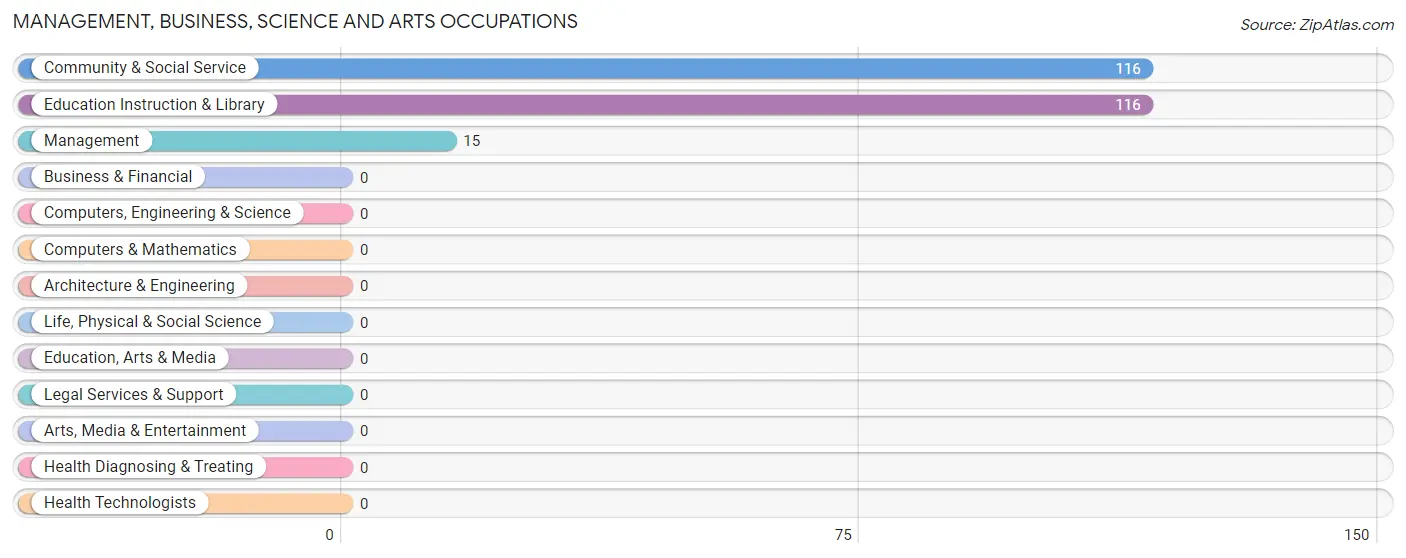
Management, Business, Science and Arts Occupations
The most common Management, Business, Science and Arts occupations in Fields Landing are Community & Social Service (116 | 35.6%), Education Instruction & Library (116 | 35.6%), and Management (15 | 4.6%).
Management, Business, Science and Arts Occupations by Sex
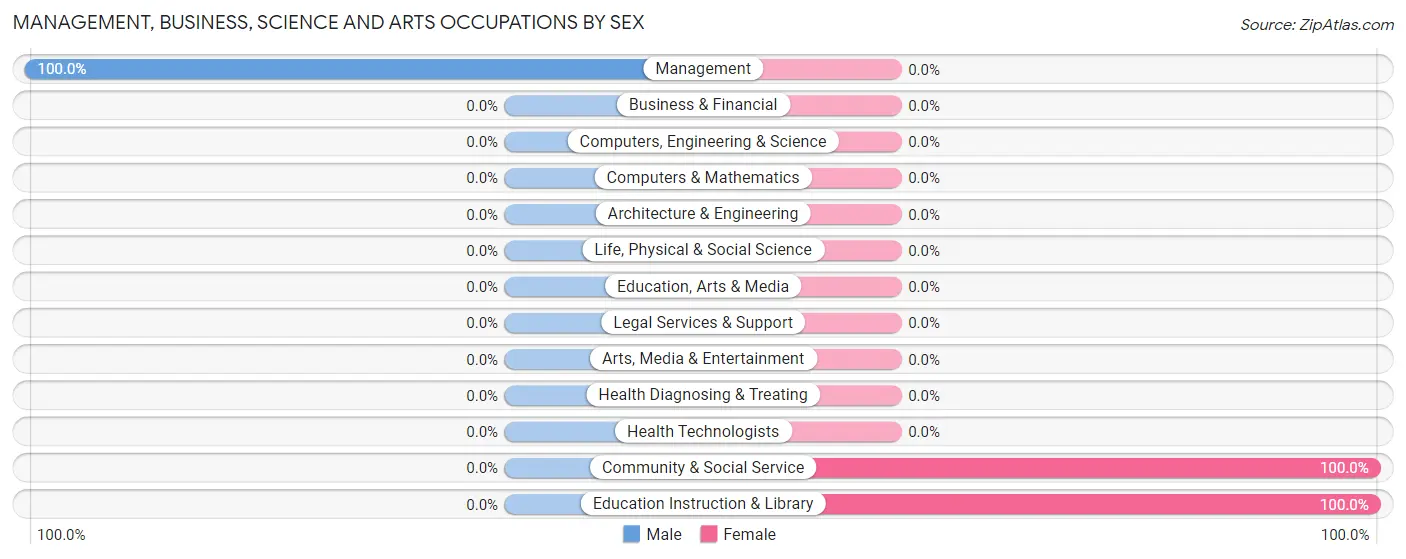
| Occupation | Male | Female |
| Management | 15 (100.0%) | 0 (0.0%) |
| Business & Financial | 0 (0.0%) | 0 (0.0%) |
| Computers, Engineering & Science | 0 (0.0%) | 0 (0.0%) |
| Computers & Mathematics | 0 (0.0%) | 0 (0.0%) |
| Architecture & Engineering | 0 (0.0%) | 0 (0.0%) |
| Life, Physical & Social Science | 0 (0.0%) | 0 (0.0%) |
| Community & Social Service | 0 (0.0%) | 116 (100.0%) |
| Education, Arts & Media | 0 (0.0%) | 0 (0.0%) |
| Legal Services & Support | 0 (0.0%) | 0 (0.0%) |
| Education Instruction & Library | 0 (0.0%) | 116 (100.0%) |
| Arts, Media & Entertainment | 0 (0.0%) | 0 (0.0%) |
| Health Diagnosing & Treating | 0 (0.0%) | 0 (0.0%) |
| Health Technologists | 0 (0.0%) | 0 (0.0%) |
| Total (Category) | 15 (11.5%) | 116 (88.5%) |
| Total (Overall) | 162 (49.7%) | 164 (50.3%) |
Services Occupations
The most common Services occupations in Fields Landing are , and Healthcare Support (84 | 25.8%).
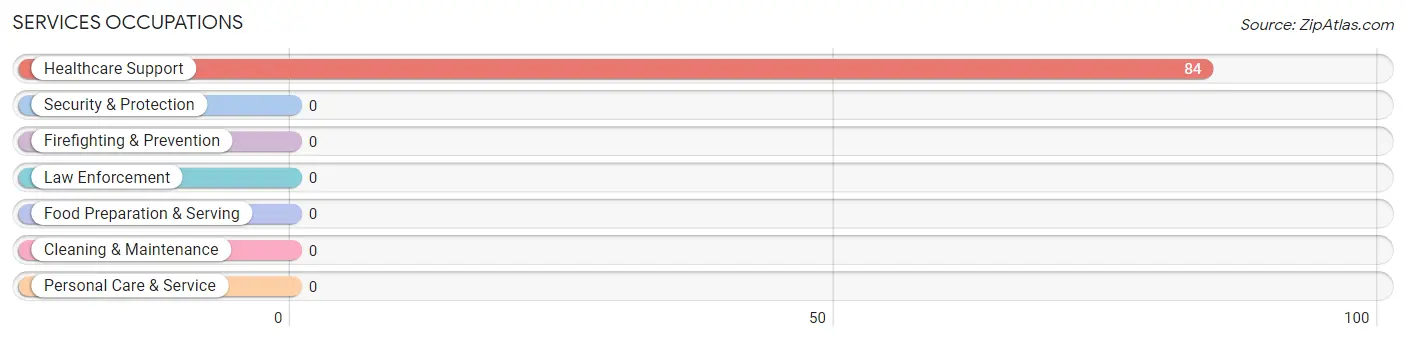
Services Occupations by Sex
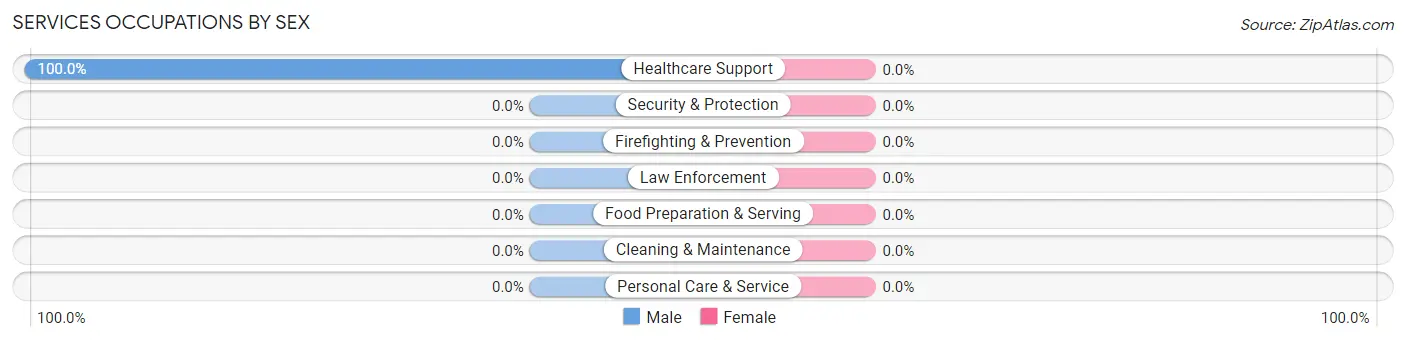
| Occupation | Male | Female |
| Healthcare Support | 84 (100.0%) | 0 (0.0%) |
| Security & Protection | 0 (0.0%) | 0 (0.0%) |
| Firefighting & Prevention | 0 (0.0%) | 0 (0.0%) |
| Law Enforcement | 0 (0.0%) | 0 (0.0%) |
| Food Preparation & Serving | 0 (0.0%) | 0 (0.0%) |
| Cleaning & Maintenance | 0 (0.0%) | 0 (0.0%) |
| Personal Care & Service | 0 (0.0%) | 0 (0.0%) |
| Total (Category) | 84 (100.0%) | 0 (0.0%) |
| Total (Overall) | 162 (49.7%) | 164 (50.3%) |
Sales and Office Occupations
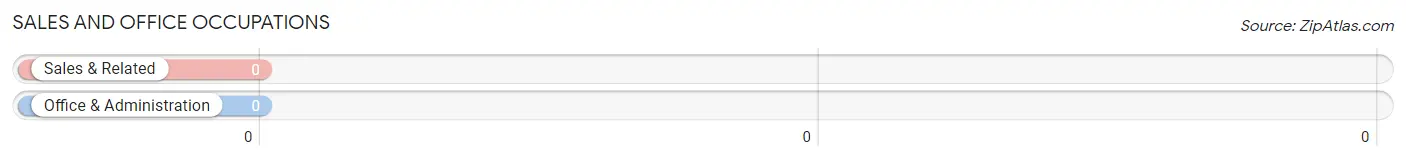
Sales and Office Occupations by Sex
| Occupation | Male | Female |
| Sales & Related | 0 (0.0%) | 0 (0.0%) |
| Office & Administration | 0 (0.0%) | 0 (0.0%) |
| Total (Category) | 0 (0.0%) | 0 (0.0%) |
| Total (Overall) | 162 (49.7%) | 164 (50.3%) |
Natural Resources, Construction and Maintenance Occupations
The most common Natural Resources, Construction and Maintenance occupations in Fields Landing are , and Farming, Fishing & Forestry (63 | 19.3%).
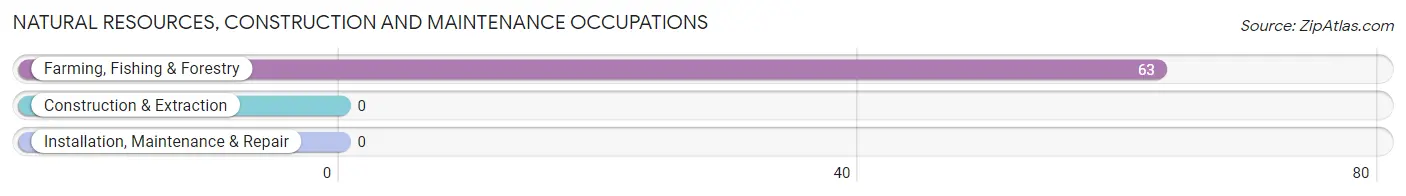
Natural Resources, Construction and Maintenance Occupations by Sex
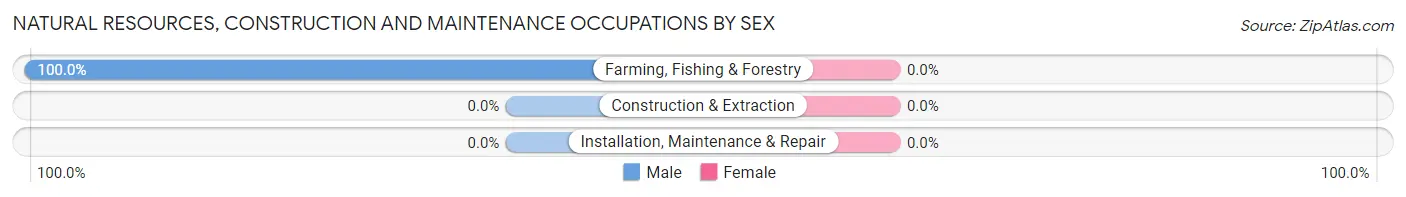
| Occupation | Male | Female |
| Farming, Fishing & Forestry | 63 (100.0%) | 0 (0.0%) |
| Construction & Extraction | 0 (0.0%) | 0 (0.0%) |
| Installation, Maintenance & Repair | 0 (0.0%) | 0 (0.0%) |
| Total (Category) | 63 (100.0%) | 0 (0.0%) |
| Total (Overall) | 162 (49.7%) | 164 (50.3%) |
Production, Transportation and Moving Occupations
The most common Production, Transportation and Moving occupations in Fields Landing are , and Production (48 | 14.7%).
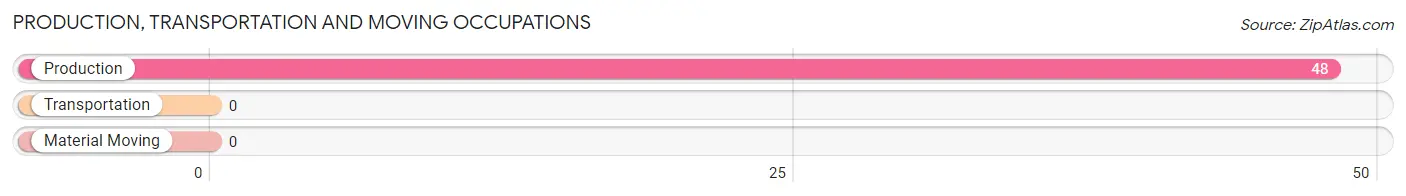
Production, Transportation and Moving Occupations by Sex
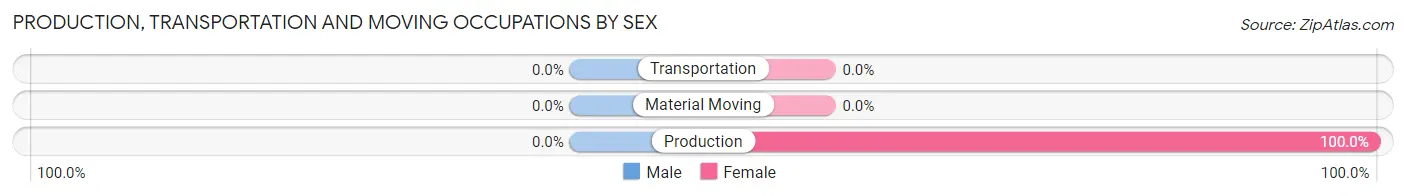
| Occupation | Male | Female |
| Production | 0 (0.0%) | 48 (100.0%) |
| Transportation | 0 (0.0%) | 0 (0.0%) |
| Material Moving | 0 (0.0%) | 0 (0.0%) |
| Total (Category) | 0 (0.0%) | 48 (100.0%) |
| Total (Overall) | 162 (49.7%) | 164 (50.3%) |
Employment Industries by Sex in Fields Landing
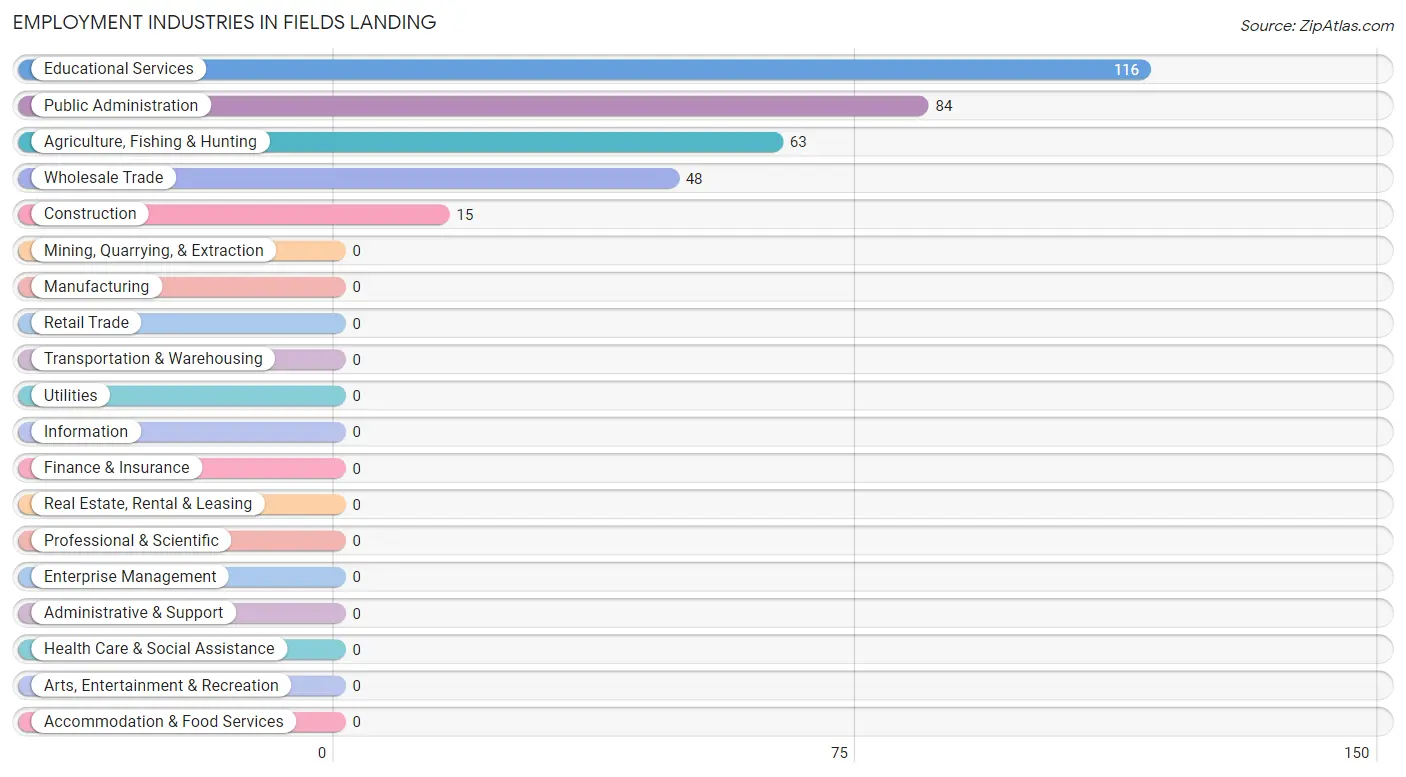
Employment Industries in Fields Landing
The major employment industries in Fields Landing include Educational Services (116 | 35.6%), Public Administration (84 | 25.8%), Agriculture, Fishing & Hunting (63 | 19.3%), Wholesale Trade (48 | 14.7%), and Construction (15 | 4.6%).
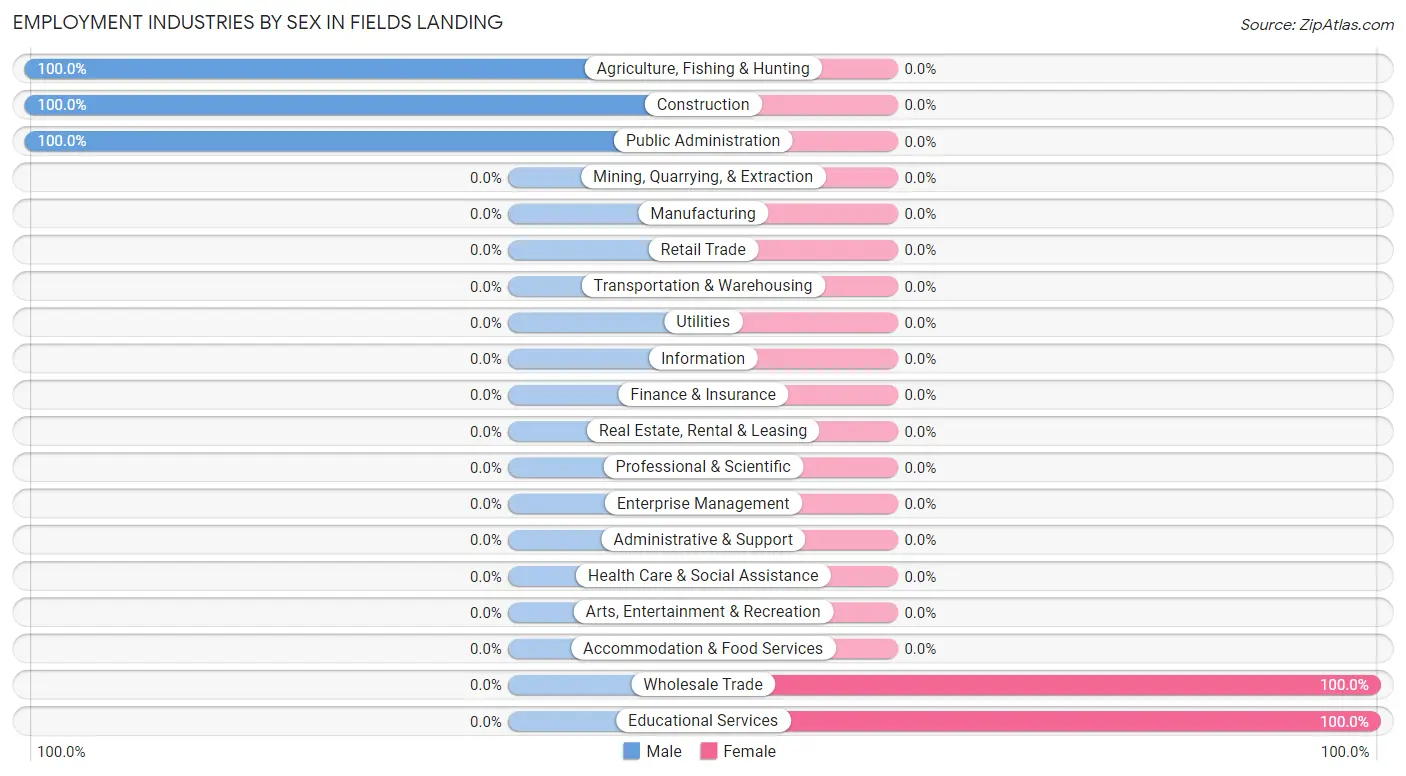
Employment Industries by Sex in Fields Landing
The Fields Landing industries that see more men than women are Agriculture, Fishing & Hunting (100.0%), Construction (100.0%), and Public Administration (100.0%), whereas the industries that tend to have a higher number of women are Wholesale Trade (100.0%), and Educational Services (100.0%).
| Industry | Male | Female |
| Agriculture, Fishing & Hunting | 63 (100.0%) | 0 (0.0%) |
| Mining, Quarrying, & Extraction | 0 (0.0%) | 0 (0.0%) |
| Construction | 15 (100.0%) | 0 (0.0%) |
| Manufacturing | 0 (0.0%) | 0 (0.0%) |
| Wholesale Trade | 0 (0.0%) | 48 (100.0%) |
| Retail Trade | 0 (0.0%) | 0 (0.0%) |
| Transportation & Warehousing | 0 (0.0%) | 0 (0.0%) |
| Utilities | 0 (0.0%) | 0 (0.0%) |
| Information | 0 (0.0%) | 0 (0.0%) |
| Finance & Insurance | 0 (0.0%) | 0 (0.0%) |
| Real Estate, Rental & Leasing | 0 (0.0%) | 0 (0.0%) |
| Professional & Scientific | 0 (0.0%) | 0 (0.0%) |
| Enterprise Management | 0 (0.0%) | 0 (0.0%) |
| Administrative & Support | 0 (0.0%) | 0 (0.0%) |
| Educational Services | 0 (0.0%) | 116 (100.0%) |
| Health Care & Social Assistance | 0 (0.0%) | 0 (0.0%) |
| Arts, Entertainment & Recreation | 0 (0.0%) | 0 (0.0%) |
| Accommodation & Food Services | 0 (0.0%) | 0 (0.0%) |
| Public Administration | 84 (100.0%) | 0 (0.0%) |
| Total | 162 (49.7%) | 164 (50.3%) |
Education in Fields Landing
School Enrollment in Fields Landing
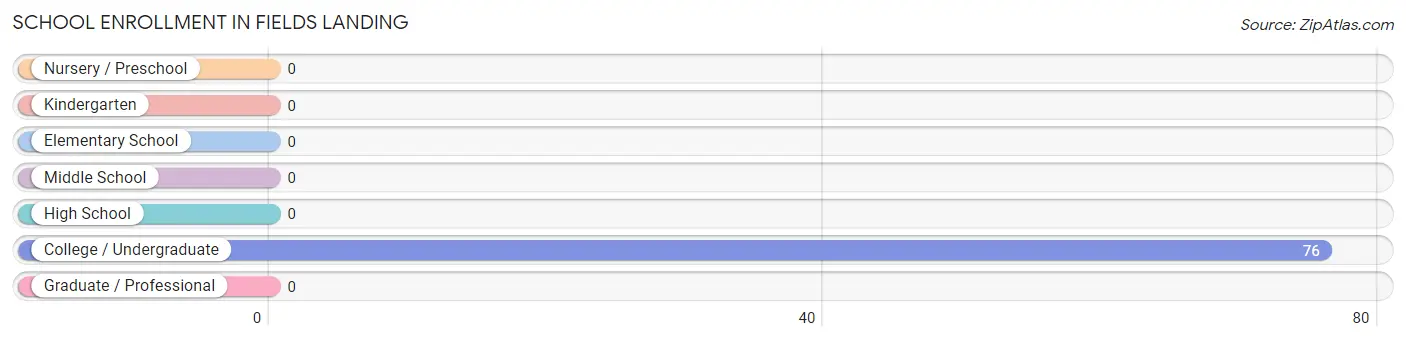
| School Level | # Students | % Students |
| Nursery / Preschool | 0 | 0.0% |
| Kindergarten | 0 | 0.0% |
| Elementary School | 0 | 0.0% |
| Middle School | 0 | 0.0% |
| High School | 0 | 0.0% |
| College / Undergraduate | 76 | 100.0% |
| Graduate / Professional | 0 | 0.0% |
| Total | 76 | 100.0% |
School Enrollment by Age by Funding Source in Fields Landing
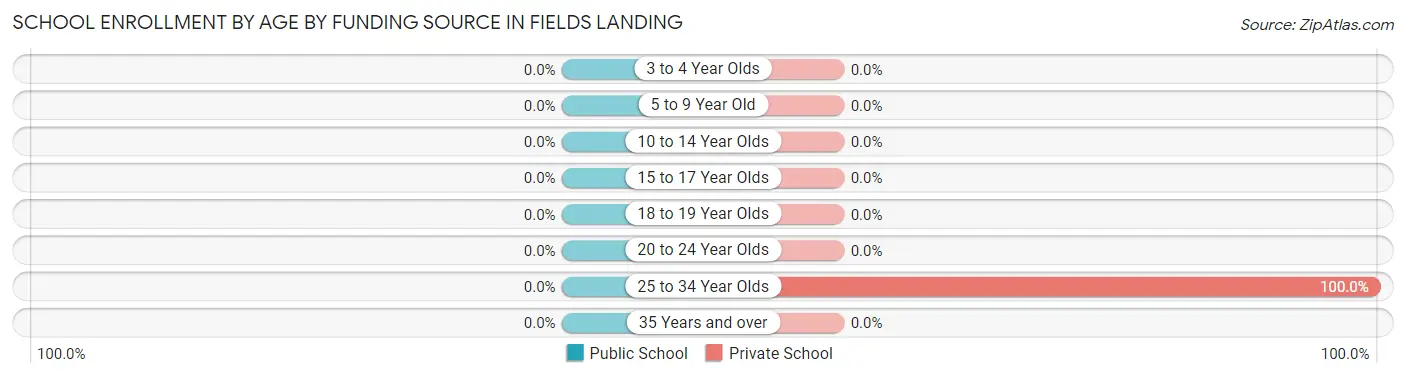
| Age Bracket | Public School | Private School |
| 3 to 4 Year Olds | 0 (0.0%) | 0 (0.0%) |
| 5 to 9 Year Old | 0 (0.0%) | 0 (0.0%) |
| 10 to 14 Year Olds | 0 (0.0%) | 0 (0.0%) |
| 15 to 17 Year Olds | 0 (0.0%) | 0 (0.0%) |
| 18 to 19 Year Olds | 0 (0.0%) | 0 (0.0%) |
| 20 to 24 Year Olds | 0 (0.0%) | 0 (0.0%) |
| 25 to 34 Year Olds | 0 (0.0%) | 76 (100.0%) |
| 35 Years and over | 0 (0.0%) | 0 (0.0%) |
| Total | 0 (0.0%) | 76 (100.0%) |
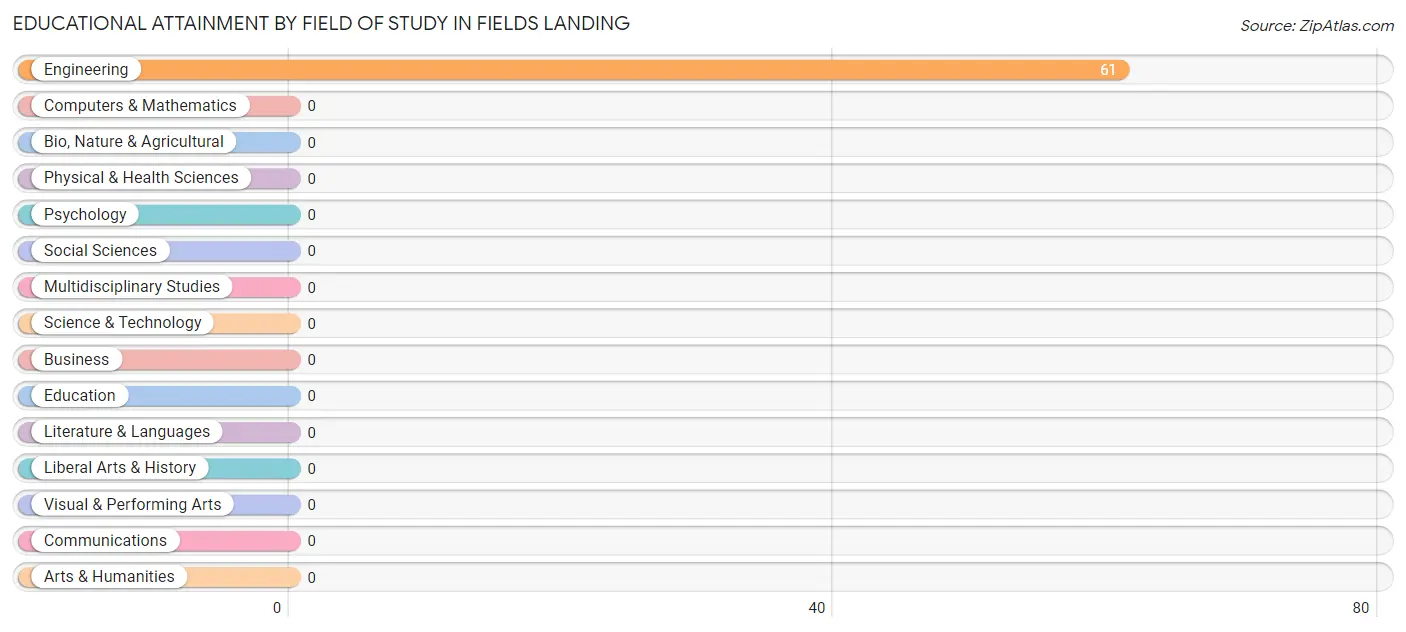
Educational Attainment by Field of Study in Fields Landing
, and engineering (61 | 100.0%) are the most common fields of study among 61 individuals in Fields Landing who have obtained a bachelor's degree or higher.
| Field of Study | # Graduates | % Graduates |
| Computers & Mathematics | 0 | 0.0% |
| Bio, Nature & Agricultural | 0 | 0.0% |
| Physical & Health Sciences | 0 | 0.0% |
| Psychology | 0 | 0.0% |
| Social Sciences | 0 | 0.0% |
| Engineering | 61 | 100.0% |
| Multidisciplinary Studies | 0 | 0.0% |
| Science & Technology | 0 | 0.0% |
| Business | 0 | 0.0% |
| Education | 0 | 0.0% |
| Literature & Languages | 0 | 0.0% |
| Liberal Arts & History | 0 | 0.0% |
| Visual & Performing Arts | 0 | 0.0% |
| Communications | 0 | 0.0% |
| Arts & Humanities | 0 | 0.0% |
| Total | 61 | 100.0% |
Transportation & Commute in Fields Landing
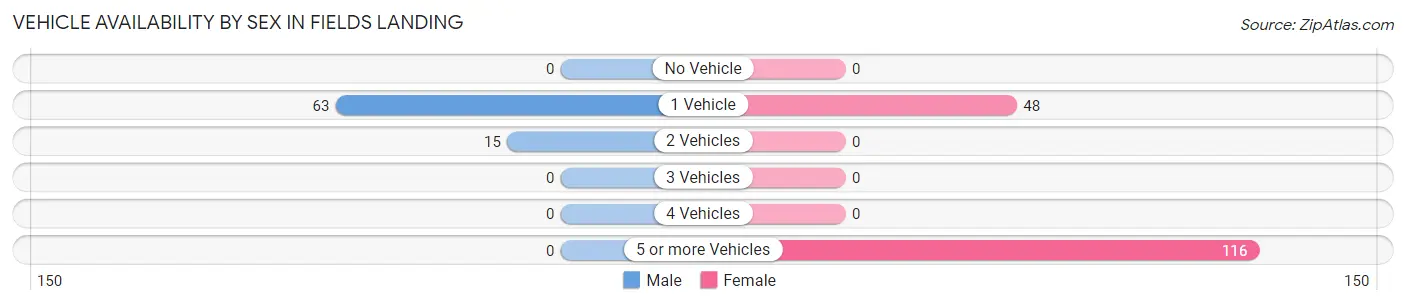
Vehicle Availability by Sex in Fields Landing
The most prevalent vehicle ownership categories in Fields Landing are males with 1 vehicle (63, accounting for 80.8%) and females with 1 vehicle (48, making up 38.4%).
| Vehicles Available | Male | Female |
| No Vehicle | 0 (0.0%) | 0 (0.0%) |
| 1 Vehicle | 63 (80.8%) | 48 (29.3%) |
| 2 Vehicles | 15 (19.2%) | 0 (0.0%) |
| 3 Vehicles | 0 (0.0%) | 0 (0.0%) |
| 4 Vehicles | 0 (0.0%) | 0 (0.0%) |
| 5 or more Vehicles | 0 (0.0%) | 116 (70.7%) |
| Total | 78 (100.0%) | 164 (100.0%) |
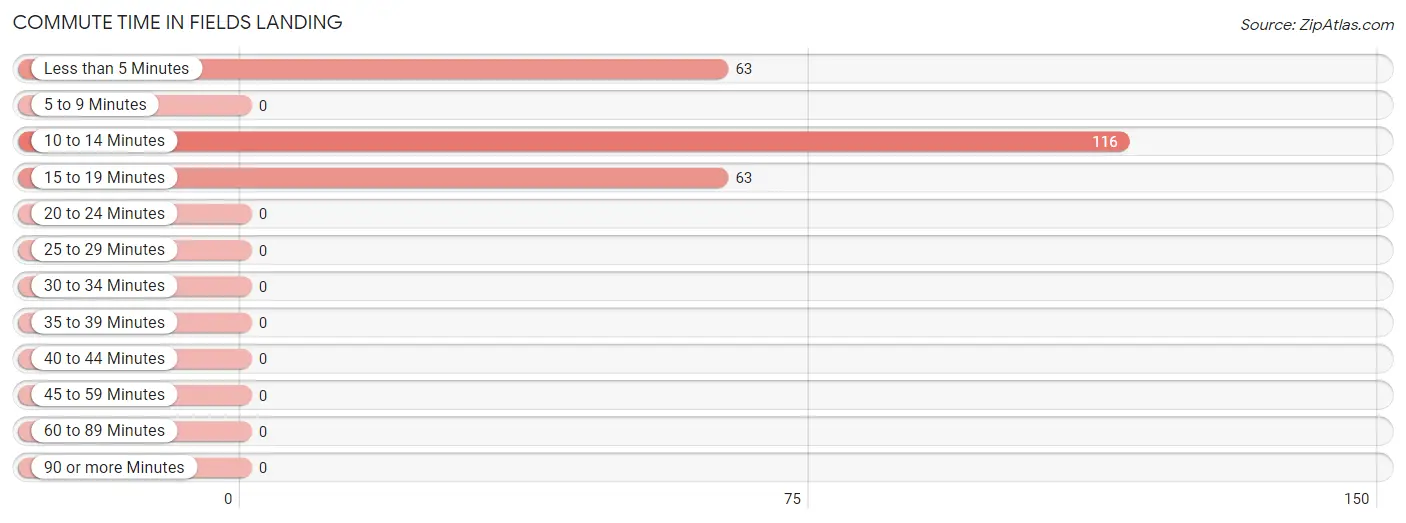
Commute Time in Fields Landing
The most frequently occuring commute durations in Fields Landing are 10 to 14 minutes (116 commuters, 47.9%), less than 5 minutes (63 commuters, 26.0%), and 15 to 19 minutes (63 commuters, 26.0%).
| Commute Time | # Commuters | % Commuters |
| Less than 5 Minutes | 63 | 26.0% |
| 5 to 9 Minutes | 0 | 0.0% |
| 10 to 14 Minutes | 116 | 47.9% |
| 15 to 19 Minutes | 63 | 26.0% |
| 20 to 24 Minutes | 0 | 0.0% |
| 25 to 29 Minutes | 0 | 0.0% |
| 30 to 34 Minutes | 0 | 0.0% |
| 35 to 39 Minutes | 0 | 0.0% |
| 40 to 44 Minutes | 0 | 0.0% |
| 45 to 59 Minutes | 0 | 0.0% |
| 60 to 89 Minutes | 0 | 0.0% |
| 90 or more Minutes | 0 | 0.0% |
Commute Time by Sex in Fields Landing
The most common commute times in Fields Landing are 15 to 19 minutes (63 commuters, 80.8%) for males and 10 to 14 minutes (116 commuters, 70.7%) for females.
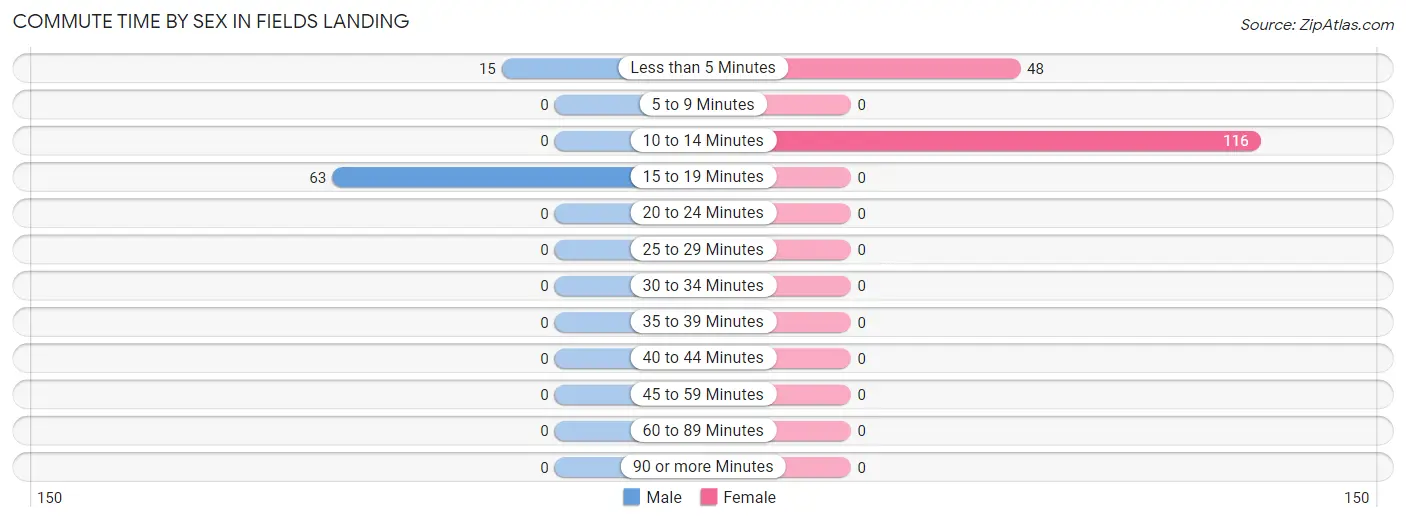
| Commute Time | Male | Female |
| Less than 5 Minutes | 15 (19.2%) | 48 (29.3%) |
| 5 to 9 Minutes | 0 (0.0%) | 0 (0.0%) |
| 10 to 14 Minutes | 0 (0.0%) | 116 (70.7%) |
| 15 to 19 Minutes | 63 (80.8%) | 0 (0.0%) |
| 20 to 24 Minutes | 0 (0.0%) | 0 (0.0%) |
| 25 to 29 Minutes | 0 (0.0%) | 0 (0.0%) |
| 30 to 34 Minutes | 0 (0.0%) | 0 (0.0%) |
| 35 to 39 Minutes | 0 (0.0%) | 0 (0.0%) |
| 40 to 44 Minutes | 0 (0.0%) | 0 (0.0%) |
| 45 to 59 Minutes | 0 (0.0%) | 0 (0.0%) |
| 60 to 89 Minutes | 0 (0.0%) | 0 (0.0%) |
| 90 or more Minutes | 0 (0.0%) | 0 (0.0%) |
Time of Departure to Work by Sex in Fields Landing
The most frequent times of departure to work in Fields Landing are 5:30 AM to 5:59 AM (63, 80.8%) for males and 8:00 AM to 8:29 AM (116, 70.7%) for females.
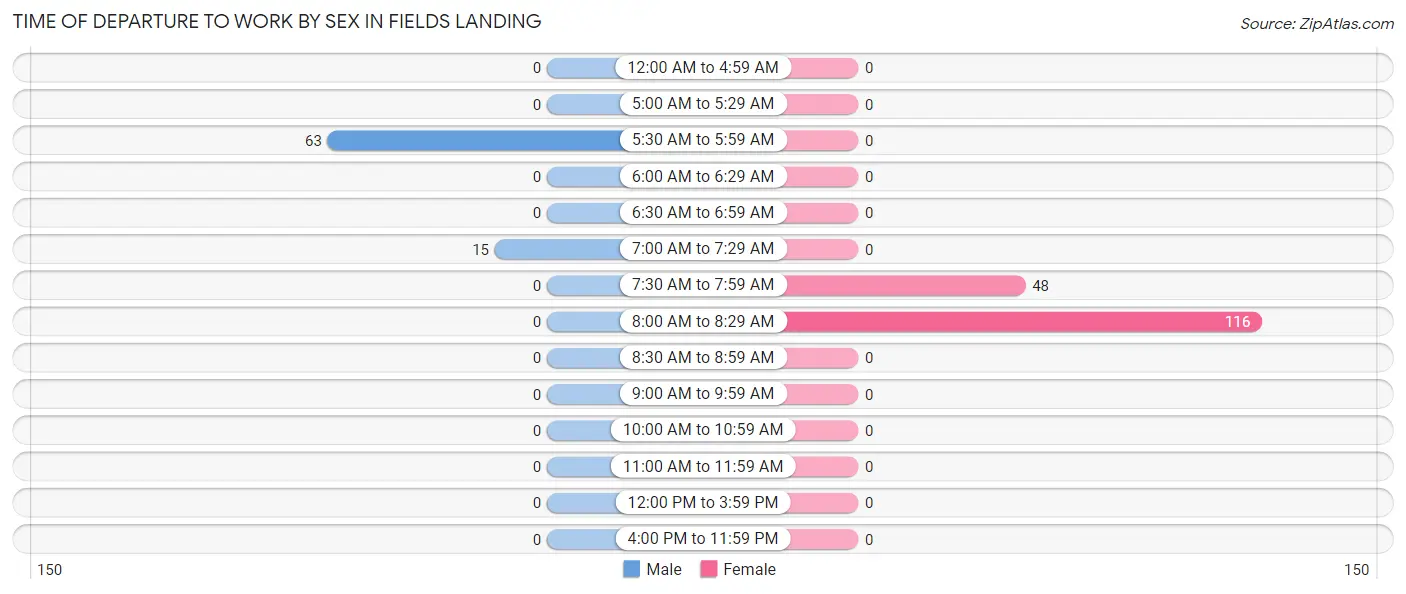
| Time of Departure | Male | Female |
| 12:00 AM to 4:59 AM | 0 (0.0%) | 0 (0.0%) |
| 5:00 AM to 5:29 AM | 0 (0.0%) | 0 (0.0%) |
| 5:30 AM to 5:59 AM | 63 (80.8%) | 0 (0.0%) |
| 6:00 AM to 6:29 AM | 0 (0.0%) | 0 (0.0%) |
| 6:30 AM to 6:59 AM | 0 (0.0%) | 0 (0.0%) |
| 7:00 AM to 7:29 AM | 15 (19.2%) | 0 (0.0%) |
| 7:30 AM to 7:59 AM | 0 (0.0%) | 48 (29.3%) |
| 8:00 AM to 8:29 AM | 0 (0.0%) | 116 (70.7%) |
| 8:30 AM to 8:59 AM | 0 (0.0%) | 0 (0.0%) |
| 9:00 AM to 9:59 AM | 0 (0.0%) | 0 (0.0%) |
| 10:00 AM to 10:59 AM | 0 (0.0%) | 0 (0.0%) |
| 11:00 AM to 11:59 AM | 0 (0.0%) | 0 (0.0%) |
| 12:00 PM to 3:59 PM | 0 (0.0%) | 0 (0.0%) |
| 4:00 PM to 11:59 PM | 0 (0.0%) | 0 (0.0%) |
| Total | 78 (100.0%) | 164 (100.0%) |
Housing Occupancy in Fields Landing
Occupancy by Ownership in Fields Landing
Of the total 148 dwellings in Fields Landing, owner-occupied units account for 72 (48.6%), while renter-occupied units make up 76 (51.3%).
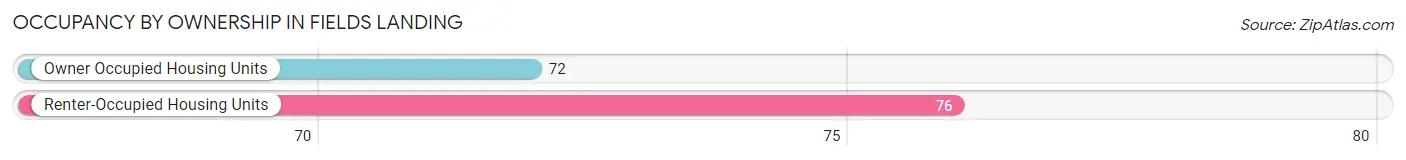
| Occupancy | # Housing Units | % Housing Units |
| Owner Occupied Housing Units | 72 | 48.6% |
| Renter-Occupied Housing Units | 76 | 51.3% |
| Total Occupied Housing Units | 148 | 100.0% |
Occupancy by Household Size in Fields Landing
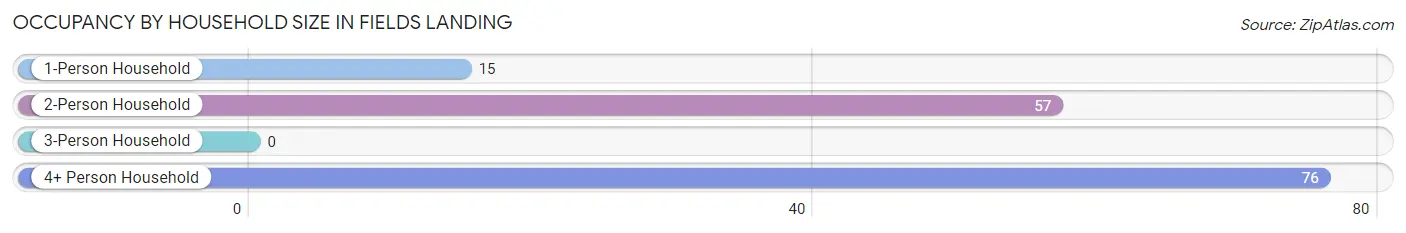
| Household Size | # Housing Units | % Housing Units |
| 1-Person Household | 15 | 10.1% |
| 2-Person Household | 57 | 38.5% |
| 3-Person Household | 0 | 0.0% |
| 4+ Person Household | 76 | 51.3% |
| Total Housing Units | 148 | 100.0% |
Occupancy by Ownership by Household Size in Fields Landing
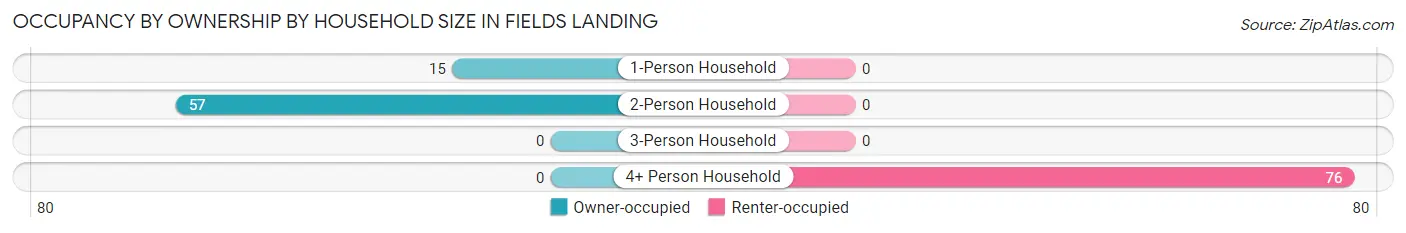
| Household Size | Owner-occupied | Renter-occupied |
| 1-Person Household | 15 (100.0%) | 0 (0.0%) |
| 2-Person Household | 57 (100.0%) | 0 (0.0%) |
| 3-Person Household | 0 (0.0%) | 0 (0.0%) |
| 4+ Person Household | 0 (0.0%) | 76 (100.0%) |
| Total Housing Units | 72 (48.6%) | 76 (51.3%) |
Occupancy by Educational Attainment in Fields Landing
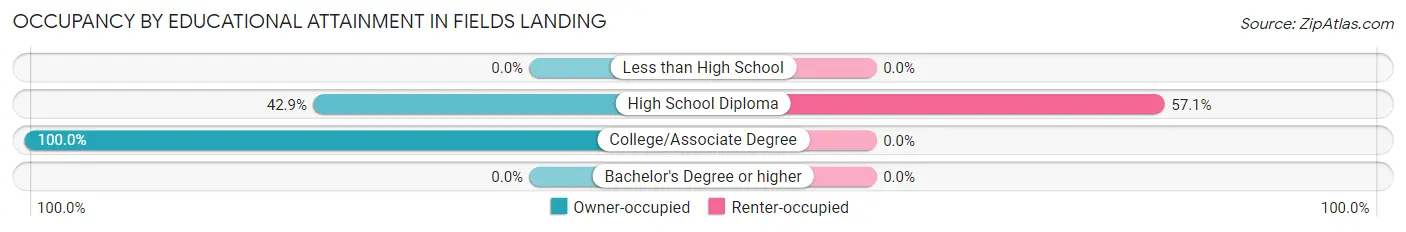
| Household Size | Owner-occupied | Renter-occupied |
| Less than High School | 0 (0.0%) | 0 (0.0%) |
| High School Diploma | 57 (42.9%) | 76 (57.1%) |
| College/Associate Degree | 15 (100.0%) | 0 (0.0%) |
| Bachelor's Degree or higher | 0 (0.0%) | 0 (0.0%) |
Occupancy by Age of Householder in Fields Landing
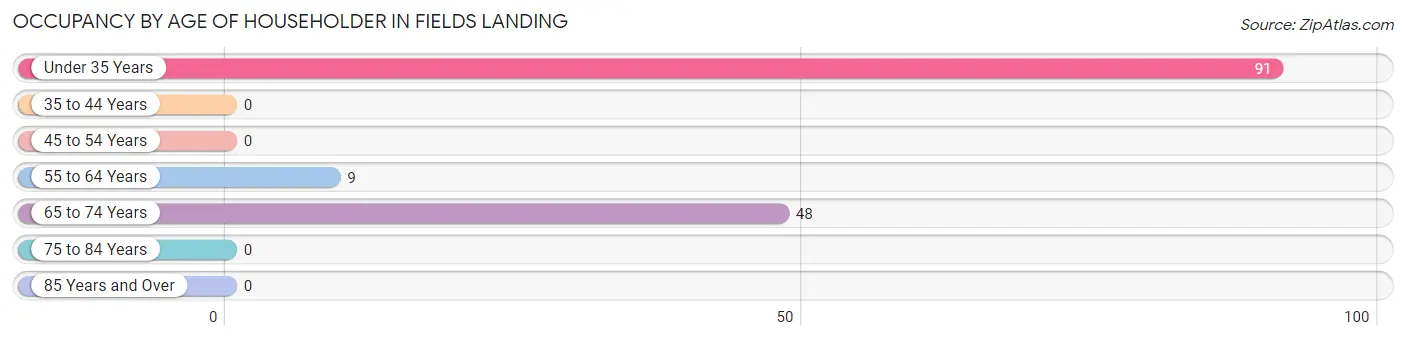
| Age Bracket | # Households | % Households |
| Under 35 Years | 91 | 61.5% |
| 35 to 44 Years | 0 | 0.0% |
| 45 to 54 Years | 0 | 0.0% |
| 55 to 64 Years | 9 | 6.1% |
| 65 to 74 Years | 48 | 32.4% |
| 75 to 84 Years | 0 | 0.0% |
| 85 Years and Over | 0 | 0.0% |
| Total | 148 | 100.0% |
Housing Finances in Fields Landing
Median Income by Occupancy in Fields Landing
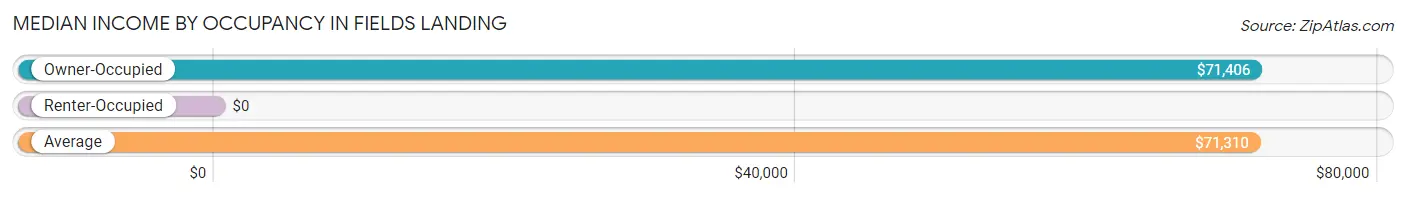
| Occupancy Type | # Households | Median Income |
| Owner-Occupied | 72 (48.6%) | $71,406 |
| Renter-Occupied | 76 (51.3%) | $0 |
| Average | 148 (100.0%) | $71,310 |
Occupancy by Householder Income Bracket in Fields Landing
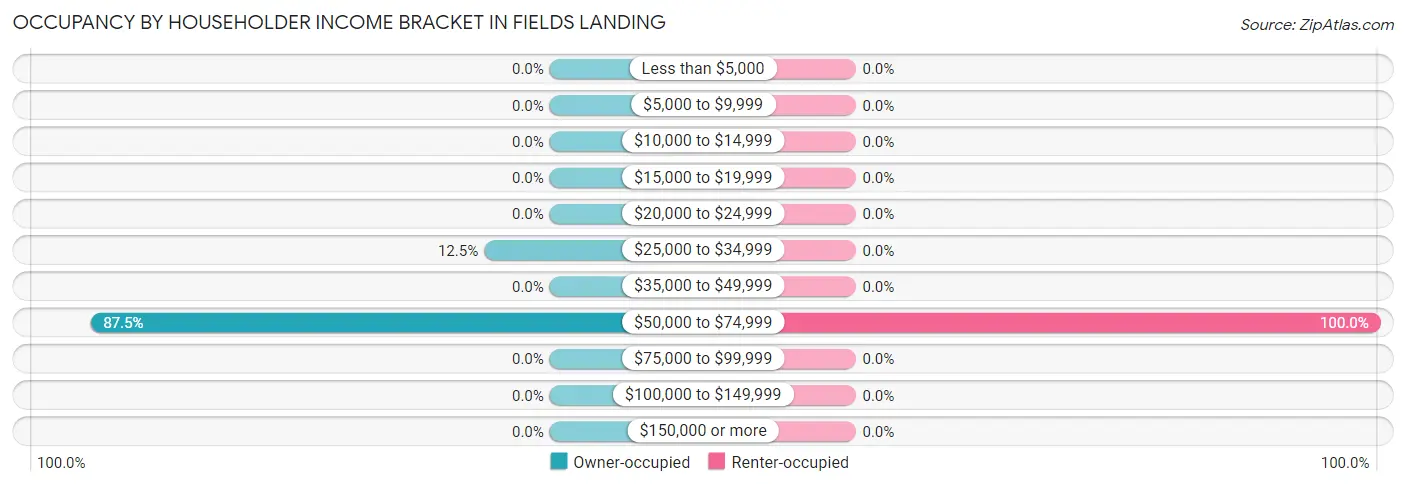
| Income Bracket | Owner-occupied | Renter-occupied |
| Less than $5,000 | 0 (0.0%) | 0 (0.0%) |
| $5,000 to $9,999 | 0 (0.0%) | 0 (0.0%) |
| $10,000 to $14,999 | 0 (0.0%) | 0 (0.0%) |
| $15,000 to $19,999 | 0 (0.0%) | 0 (0.0%) |
| $20,000 to $24,999 | 0 (0.0%) | 0 (0.0%) |
| $25,000 to $34,999 | 9 (12.5%) | 0 (0.0%) |
| $35,000 to $49,999 | 0 (0.0%) | 0 (0.0%) |
| $50,000 to $74,999 | 63 (87.5%) | 76 (100.0%) |
| $75,000 to $99,999 | 0 (0.0%) | 0 (0.0%) |
| $100,000 to $149,999 | 0 (0.0%) | 0 (0.0%) |
| $150,000 or more | 0 (0.0%) | 0 (0.0%) |
| Total | 72 (100.0%) | 76 (100.0%) |
Monthly Housing Cost Tiers in Fields Landing
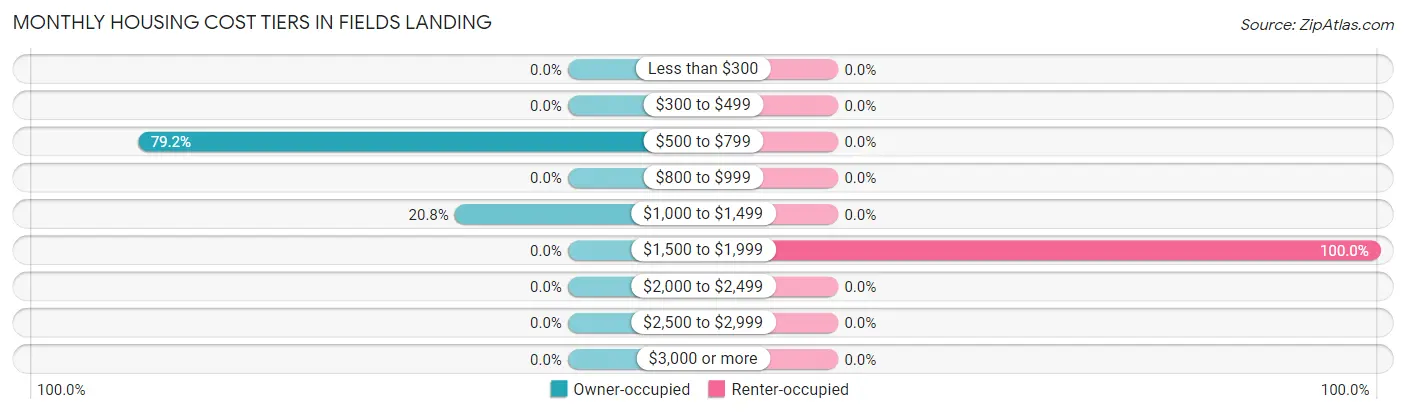
| Monthly Cost | Owner-occupied | Renter-occupied |
| Less than $300 | 0 (0.0%) | 0 (0.0%) |
| $300 to $499 | 0 (0.0%) | 0 (0.0%) |
| $500 to $799 | 57 (79.2%) | 0 (0.0%) |
| $800 to $999 | 0 (0.0%) | 0 (0.0%) |
| $1,000 to $1,499 | 15 (20.8%) | 0 (0.0%) |
| $1,500 to $1,999 | 0 (0.0%) | 76 (100.0%) |
| $2,000 to $2,499 | 0 (0.0%) | 0 (0.0%) |
| $2,500 to $2,999 | 0 (0.0%) | 0 (0.0%) |
| $3,000 or more | 0 (0.0%) | 0 (0.0%) |
| Total | 72 (100.0%) | 76 (100.0%) |
Physical Housing Characteristics in Fields Landing
Housing Structures in Fields Landing
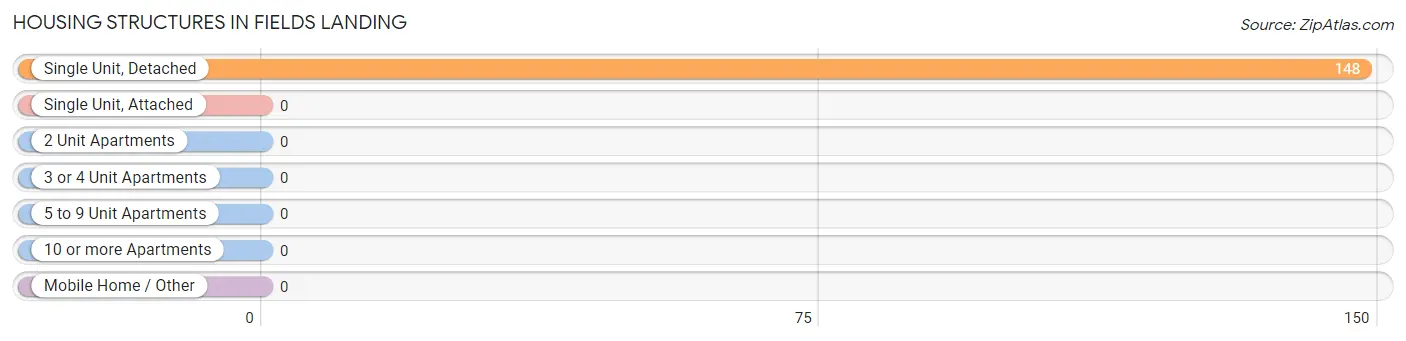
| Structure Type | # Housing Units | % Housing Units |
| Single Unit, Detached | 148 | 100.0% |
| Single Unit, Attached | 0 | 0.0% |
| 2 Unit Apartments | 0 | 0.0% |
| 3 or 4 Unit Apartments | 0 | 0.0% |
| 5 to 9 Unit Apartments | 0 | 0.0% |
| 10 or more Apartments | 0 | 0.0% |
| Mobile Home / Other | 0 | 0.0% |
| Total | 148 | 100.0% |
Housing Structures by Occupancy in Fields Landing
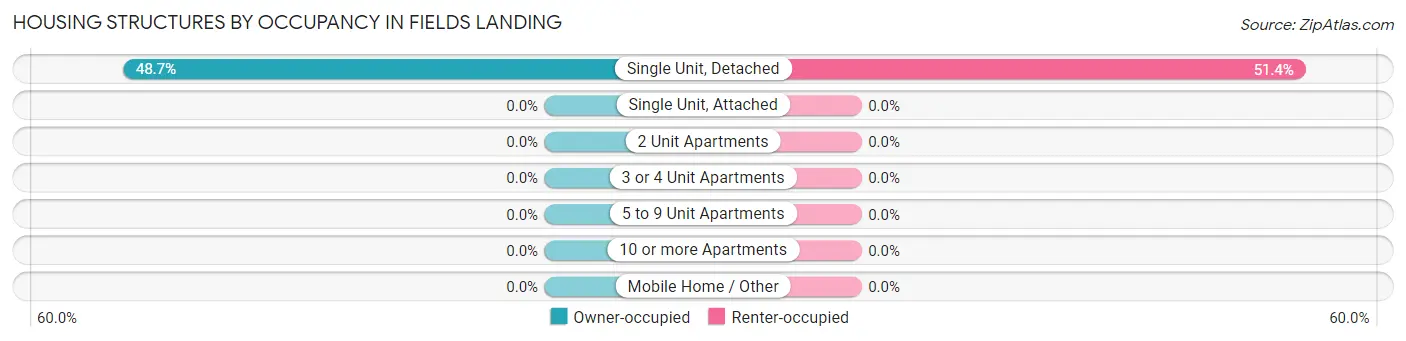
| Structure Type | Owner-occupied | Renter-occupied |
| Single Unit, Detached | 72 (48.6%) | 76 (51.3%) |
| Single Unit, Attached | 0 (0.0%) | 0 (0.0%) |
| 2 Unit Apartments | 0 (0.0%) | 0 (0.0%) |
| 3 or 4 Unit Apartments | 0 (0.0%) | 0 (0.0%) |
| 5 to 9 Unit Apartments | 0 (0.0%) | 0 (0.0%) |
| 10 or more Apartments | 0 (0.0%) | 0 (0.0%) |
| Mobile Home / Other | 0 (0.0%) | 0 (0.0%) |
| Total | 72 (48.6%) | 76 (51.3%) |
Housing Structures by Number of Rooms in Fields Landing
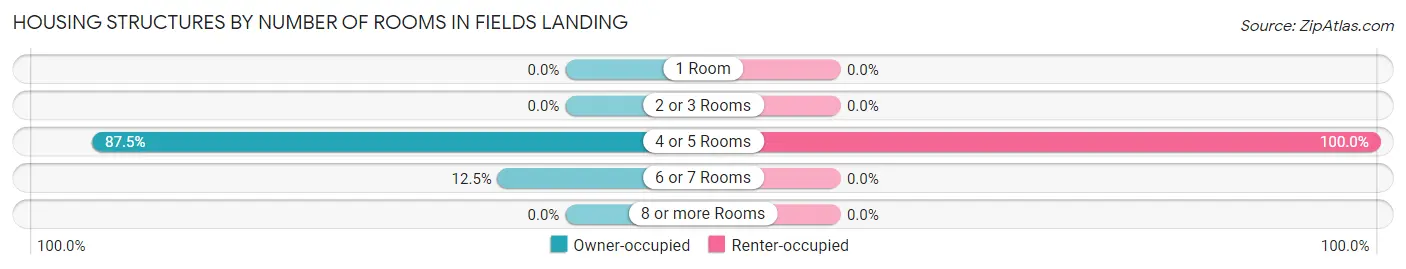
| Number of Rooms | Owner-occupied | Renter-occupied |
| 1 Room | 0 (0.0%) | 0 (0.0%) |
| 2 or 3 Rooms | 0 (0.0%) | 0 (0.0%) |
| 4 or 5 Rooms | 63 (87.5%) | 76 (100.0%) |
| 6 or 7 Rooms | 9 (12.5%) | 0 (0.0%) |
| 8 or more Rooms | 0 (0.0%) | 0 (0.0%) |
| Total | 72 (100.0%) | 76 (100.0%) |
Housing Structure by Heating Type in Fields Landing
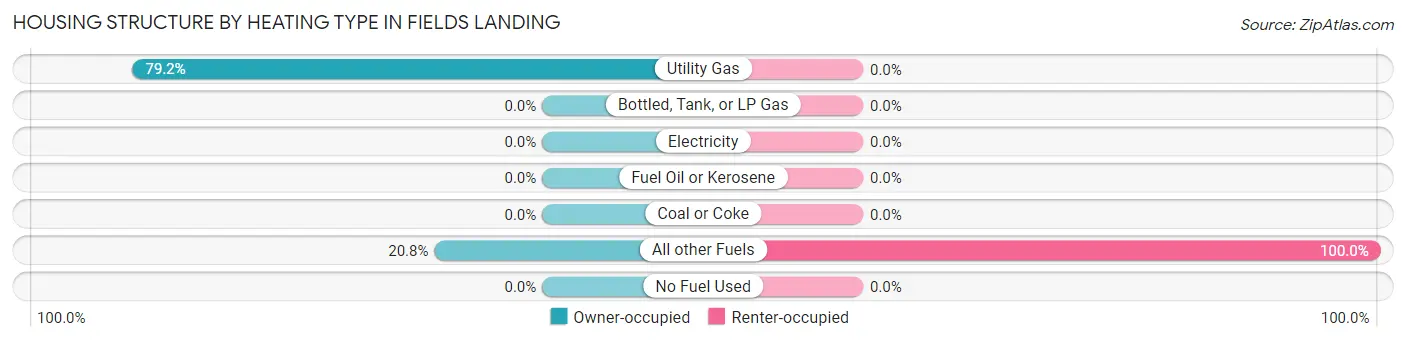
| Heating Type | Owner-occupied | Renter-occupied |
| Utility Gas | 57 (79.2%) | 0 (0.0%) |
| Bottled, Tank, or LP Gas | 0 (0.0%) | 0 (0.0%) |
| Electricity | 0 (0.0%) | 0 (0.0%) |
| Fuel Oil or Kerosene | 0 (0.0%) | 0 (0.0%) |
| Coal or Coke | 0 (0.0%) | 0 (0.0%) |
| All other Fuels | 15 (20.8%) | 76 (100.0%) |
| No Fuel Used | 0 (0.0%) | 0 (0.0%) |
| Total | 72 (100.0%) | 76 (100.0%) |
Household Vehicle Usage in Fields Landing
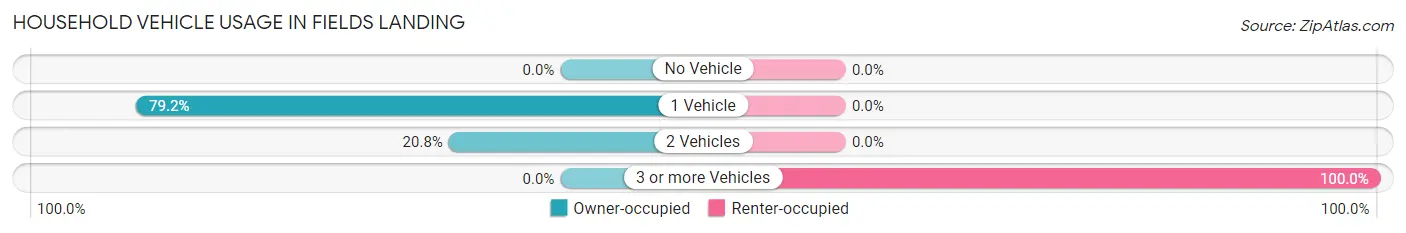
| Vehicles per Household | Owner-occupied | Renter-occupied |
| No Vehicle | 0 (0.0%) | 0 (0.0%) |
| 1 Vehicle | 57 (79.2%) | 0 (0.0%) |
| 2 Vehicles | 15 (20.8%) | 0 (0.0%) |
| 3 or more Vehicles | 0 (0.0%) | 76 (100.0%) |
| Total | 72 (100.0%) | 76 (100.0%) |
Real Estate & Mortgages in Fields Landing
Real Estate and Mortgage Overview in Fields Landing
| Characteristic | Without Mortgage | With Mortgage |
| Housing Units | 57 | 15 |
| Median Property Value | - | - |
| Median Household Income | - | - |
| Monthly Housing Costs | - | - |
| Real Estate Taxes | - | - |
Property Value by Mortgage Status in Fields Landing
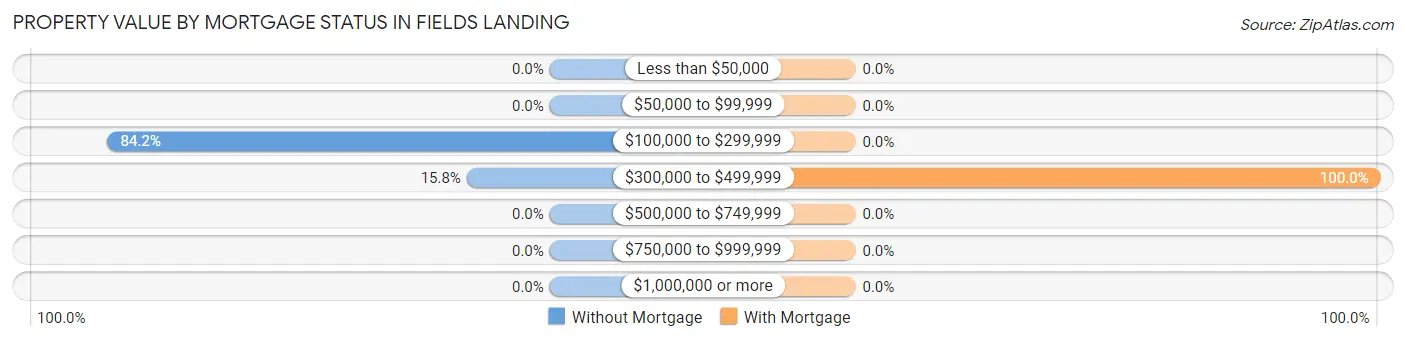
| Property Value | Without Mortgage | With Mortgage |
| Less than $50,000 | 0 (0.0%) | 0 (0.0%) |
| $50,000 to $99,999 | 0 (0.0%) | 0 (0.0%) |
| $100,000 to $299,999 | 48 (84.2%) | 0 (0.0%) |
| $300,000 to $499,999 | 9 (15.8%) | 15 (100.0%) |
| $500,000 to $749,999 | 0 (0.0%) | 0 (0.0%) |
| $750,000 to $999,999 | 0 (0.0%) | 0 (0.0%) |
| $1,000,000 or more | 0 (0.0%) | 0 (0.0%) |
| Total | 57 (100.0%) | 15 (100.0%) |
Household Income by Mortgage Status in Fields Landing
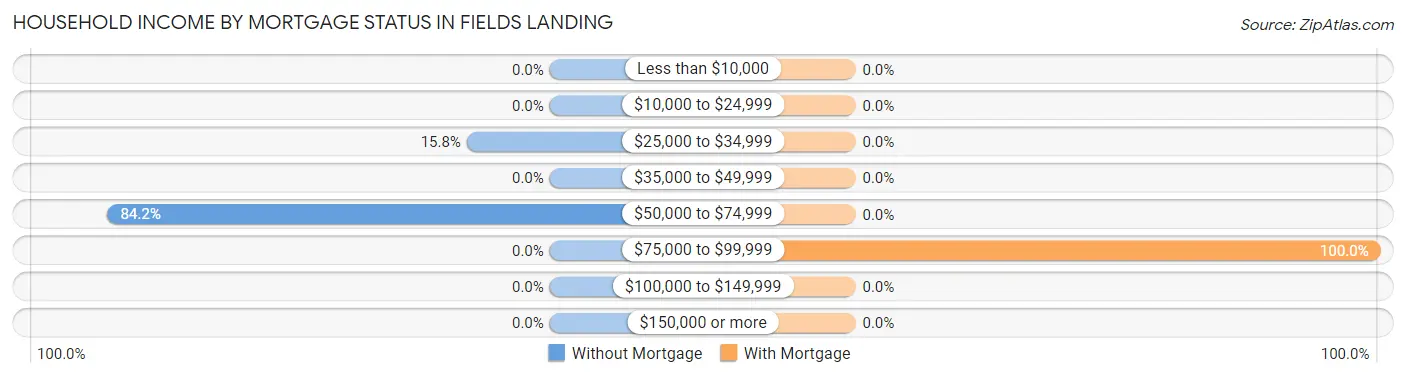
| Household Income | Without Mortgage | With Mortgage |
| Less than $10,000 | 0 (0.0%) | 0 (0.0%) |
| $10,000 to $24,999 | 0 (0.0%) | 0 (0.0%) |
| $25,000 to $34,999 | 9 (15.8%) | 0 (0.0%) |
| $35,000 to $49,999 | 0 (0.0%) | 0 (0.0%) |
| $50,000 to $74,999 | 48 (84.2%) | 0 (0.0%) |
| $75,000 to $99,999 | 0 (0.0%) | 15 (100.0%) |
| $100,000 to $149,999 | 0 (0.0%) | 0 (0.0%) |
| $150,000 or more | 0 (0.0%) | 0 (0.0%) |
| Total | 57 (100.0%) | 15 (100.0%) |
Property Value to Household Income Ratio in Fields Landing
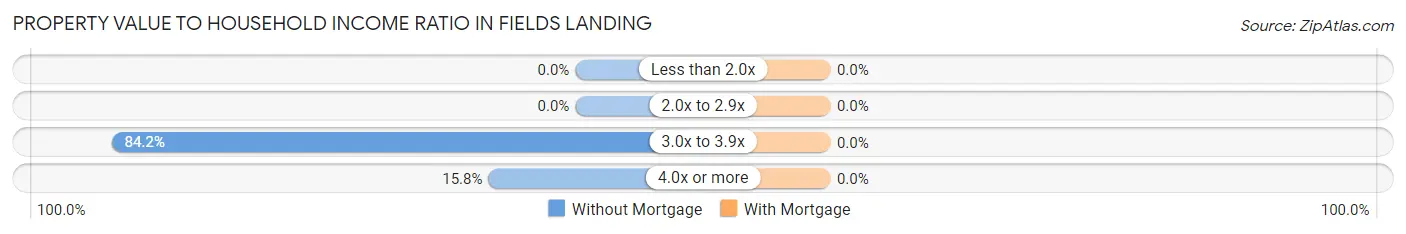
| Value-to-Income Ratio | Without Mortgage | With Mortgage |
| Less than 2.0x | 0 (0.0%) | 0 (0.0%) |
| 2.0x to 2.9x | 0 (0.0%) | 0 (0.0%) |
| 3.0x to 3.9x | 48 (84.2%) | 0 (0.0%) |
| 4.0x or more | 9 (15.8%) | 0 (0.0%) |
| Total | 57 (100.0%) | 15 (100.0%) |
Real Estate Taxes by Mortgage Status in Fields Landing
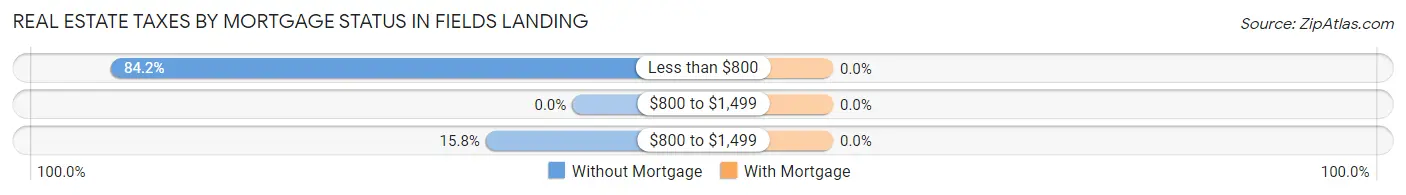
| Property Taxes | Without Mortgage | With Mortgage |
| Less than $800 | 48 (84.2%) | 0 (0.0%) |
| $800 to $1,499 | 0 (0.0%) | 0 (0.0%) |
| $800 to $1,499 | 9 (15.8%) | 0 (0.0%) |
| Total | 57 (100.0%) | 15 (100.0%) |
Health & Disability in Fields Landing
Health Insurance Coverage by Age in Fields Landing
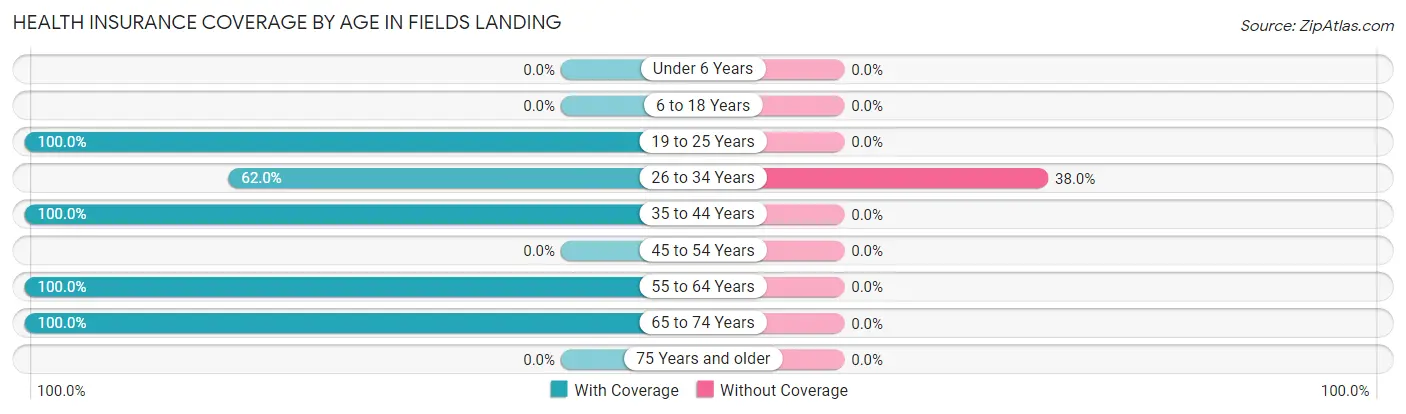
| Age Bracket | With Coverage | Without Coverage |
| Under 6 Years | 0 (0.0%) | 0 (0.0%) |
| 6 to 18 Years | 0 (0.0%) | 0 (0.0%) |
| 19 to 25 Years | 280 (100.0%) | 0 (0.0%) |
| 26 to 34 Years | 137 (62.0%) | 84 (38.0%) |
| 35 to 44 Years | 63 (100.0%) | 0 (0.0%) |
| 45 to 54 Years | 0 (0.0%) | 0 (0.0%) |
| 55 to 64 Years | 9 (100.0%) | 0 (0.0%) |
| 65 to 74 Years | 56 (100.0%) | 0 (0.0%) |
| 75 Years and older | 0 (0.0%) | 0 (0.0%) |
| Total | 545 (86.7%) | 84 (13.4%) |
Health Insurance Coverage by Citizenship Status in Fields Landing
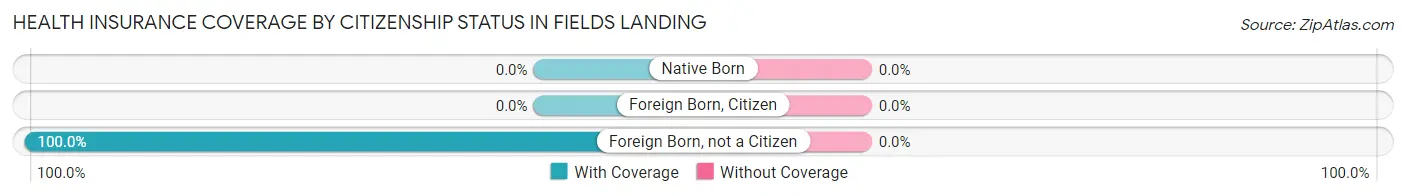
| Citizenship Status | With Coverage | Without Coverage |
| Native Born | 0 (0.0%) | 0 (0.0%) |
| Foreign Born, Citizen | 0 (0.0%) | 0 (0.0%) |
| Foreign Born, not a Citizen | 280 (100.0%) | 0 (0.0%) |
Health Insurance Coverage by Household Income in Fields Landing
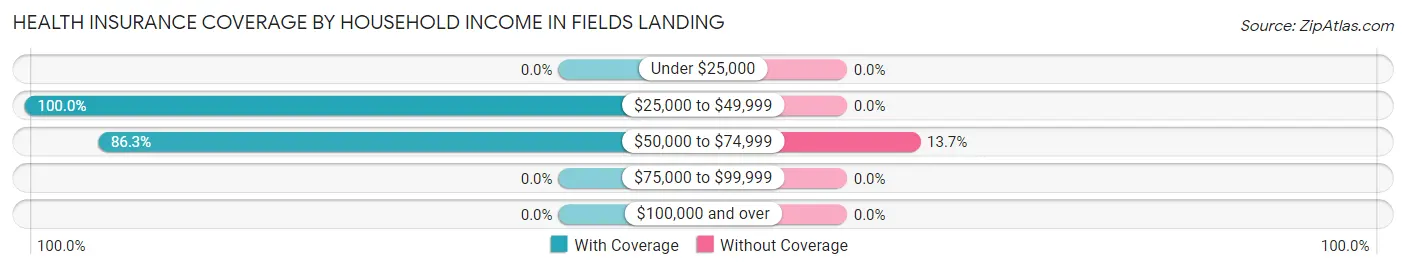
| Household Income | With Coverage | Without Coverage |
| Under $25,000 | 0 (0.0%) | 0 (0.0%) |
| $25,000 to $49,999 | 17 (100.0%) | 0 (0.0%) |
| $50,000 to $74,999 | 528 (86.3%) | 84 (13.7%) |
| $75,000 to $99,999 | 0 (0.0%) | 0 (0.0%) |
| $100,000 and over | 0 (0.0%) | 0 (0.0%) |
Public vs Private Health Insurance Coverage by Age in Fields Landing
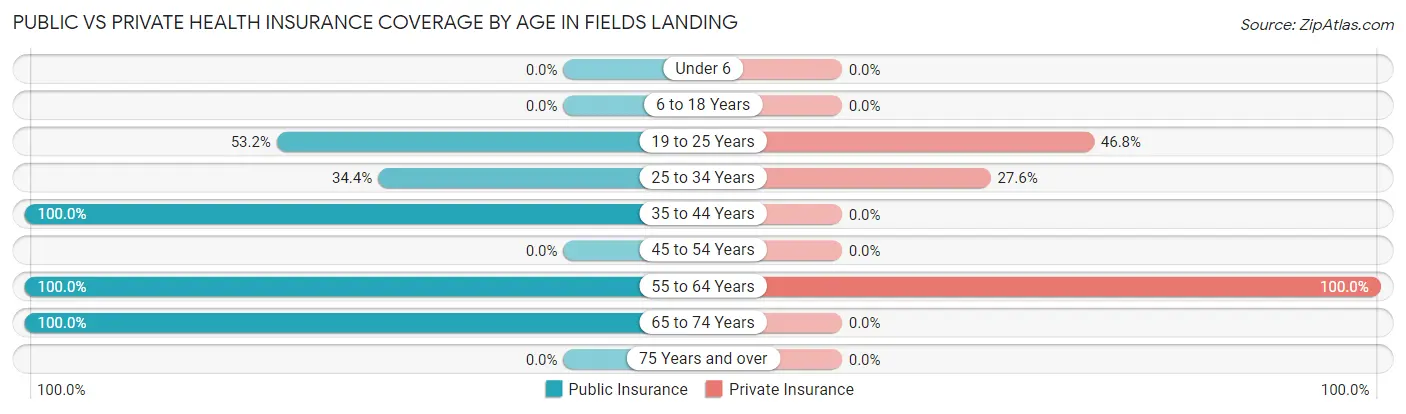
| Age Bracket | Public Insurance | Private Insurance |
| Under 6 | 0 (0.0%) | 0 (0.0%) |
| 6 to 18 Years | 0 (0.0%) | 0 (0.0%) |
| 19 to 25 Years | 149 (53.2%) | 131 (46.8%) |
| 25 to 34 Years | 76 (34.4%) | 61 (27.6%) |
| 35 to 44 Years | 63 (100.0%) | 0 (0.0%) |
| 45 to 54 Years | 0 (0.0%) | 0 (0.0%) |
| 55 to 64 Years | 9 (100.0%) | 9 (100.0%) |
| 65 to 74 Years | 56 (100.0%) | 0 (0.0%) |
| 75 Years and over | 0 (0.0%) | 0 (0.0%) |
| Total | 353 (56.1%) | 201 (32.0%) |
Disability Status by Sex by Age in Fields Landing
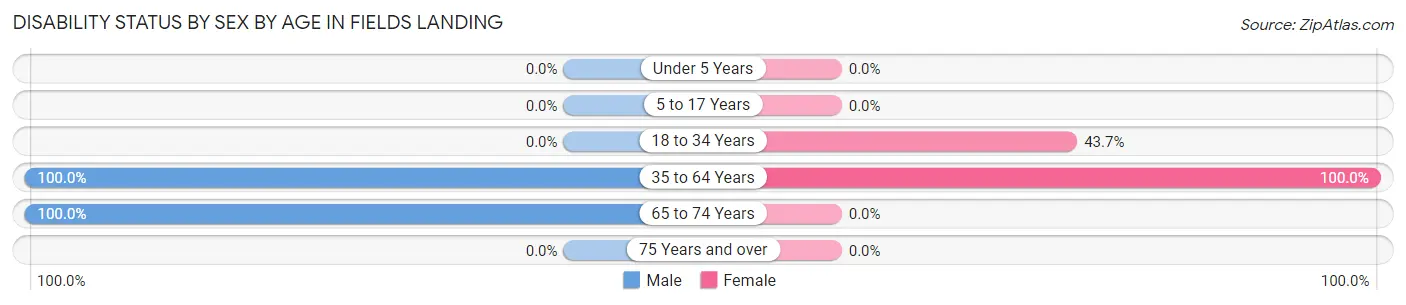
| Age Bracket | Male | Female |
| Under 5 Years | 0 (0.0%) | 0 (0.0%) |
| 5 to 17 Years | 0 (0.0%) | 0 (0.0%) |
| 18 to 34 Years | 0 (0.0%) | 149 (43.7%) |
| 35 to 64 Years | 63 (100.0%) | 9 (100.0%) |
| 65 to 74 Years | 8 (100.0%) | 0 (0.0%) |
| 75 Years and over | 0 (0.0%) | 0 (0.0%) |
Disability Class by Sex by Age in Fields Landing
Disability Class: Hearing Difficulty
| Age Bracket | Male | Female |
| Under 5 Years | 0 (0.0%) | 0 (0.0%) |
| 5 to 17 Years | 0 (0.0%) | 0 (0.0%) |
| 18 to 34 Years | 0 (0.0%) | 0 (0.0%) |
| 35 to 64 Years | 0 (0.0%) | 0 (0.0%) |
| 65 to 74 Years | 0 (0.0%) | 0 (0.0%) |
| 75 Years and over | 0 (0.0%) | 0 (0.0%) |
Disability Class: Vision Difficulty
| Age Bracket | Male | Female |
| Under 5 Years | 0 (0.0%) | 0 (0.0%) |
| 5 to 17 Years | 0 (0.0%) | 0 (0.0%) |
| 18 to 34 Years | 0 (0.0%) | 0 (0.0%) |
| 35 to 64 Years | 0 (0.0%) | 0 (0.0%) |
| 65 to 74 Years | 0 (0.0%) | 0 (0.0%) |
| 75 Years and over | 0 (0.0%) | 0 (0.0%) |
Disability Class: Cognitive Difficulty
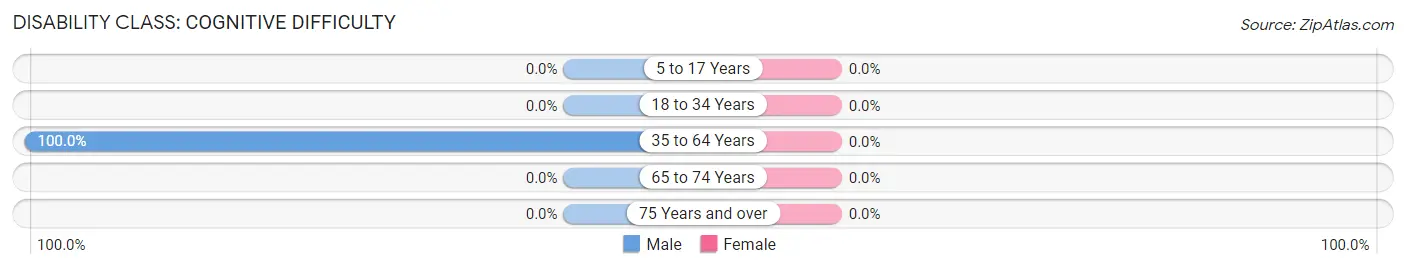
| Age Bracket | Male | Female |
| 5 to 17 Years | 0 (0.0%) | 0 (0.0%) |
| 18 to 34 Years | 0 (0.0%) | 0 (0.0%) |
| 35 to 64 Years | 63 (100.0%) | 0 (0.0%) |
| 65 to 74 Years | 0 (0.0%) | 0 (0.0%) |
| 75 Years and over | 0 (0.0%) | 0 (0.0%) |
Disability Class: Ambulatory Difficulty
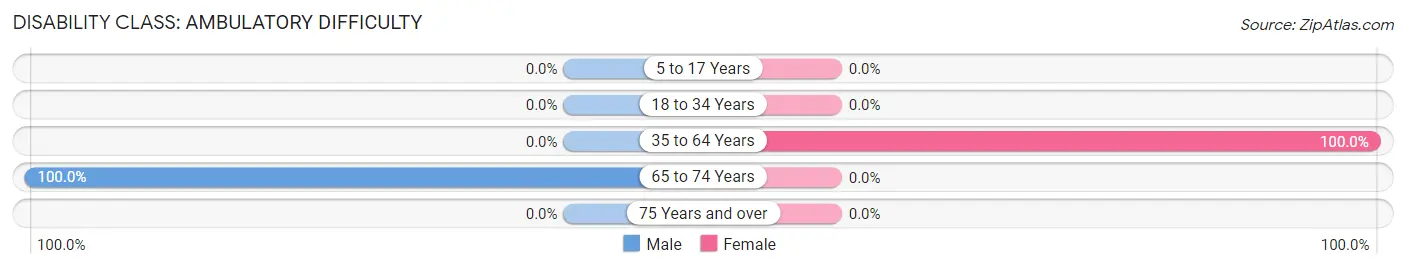
| Age Bracket | Male | Female |
| 5 to 17 Years | 0 (0.0%) | 0 (0.0%) |
| 18 to 34 Years | 0 (0.0%) | 0 (0.0%) |
| 35 to 64 Years | 0 (0.0%) | 9 (100.0%) |
| 65 to 74 Years | 8 (100.0%) | 0 (0.0%) |
| 75 Years and over | 0 (0.0%) | 0 (0.0%) |
Disability Class: Self-Care Difficulty
| Age Bracket | Male | Female |
| 5 to 17 Years | 0 (0.0%) | 0 (0.0%) |
| 18 to 34 Years | 0 (0.0%) | 0 (0.0%) |
| 35 to 64 Years | 0 (0.0%) | 0 (0.0%) |
| 65 to 74 Years | 0 (0.0%) | 0 (0.0%) |
| 75 Years and over | 0 (0.0%) | 0 (0.0%) |
Technology Access in Fields Landing
Computing Device Access in Fields Landing
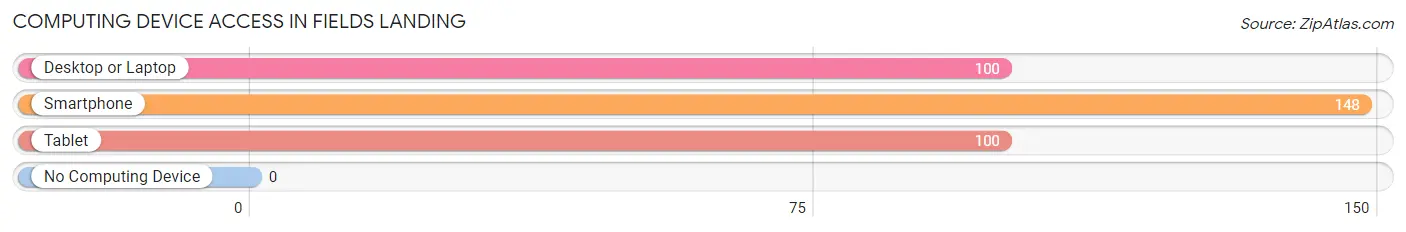
| Device Type | # Households | % Households |
| Desktop or Laptop | 100 | 67.6% |
| Smartphone | 148 | 100.0% |
| Tablet | 100 | 67.6% |
| No Computing Device | 0 | 0.0% |
| Total | 148 | 100.0% |
Internet Access in Fields Landing
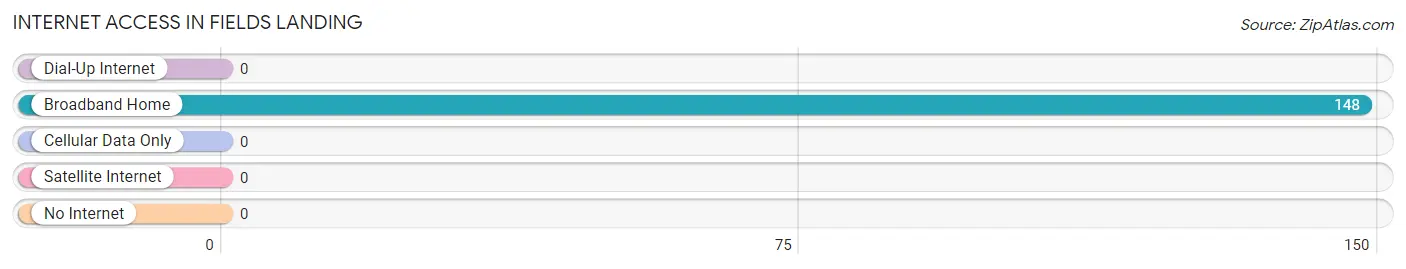
| Internet Type | # Households | % Households |
| Dial-Up Internet | 0 | 0.0% |
| Broadband Home | 148 | 100.0% |
| Cellular Data Only | 0 | 0.0% |
| Satellite Internet | 0 | 0.0% |
| No Internet | 0 | 0.0% |
| Total | 148 | 100.0% |
Fields Landing Summary
Fields Landing is a small unincorporated community located in Humboldt County, California. It is situated on the south shore of Humboldt Bay, approximately 8 miles south of Eureka. The population of Fields Landing was estimated to be 1,093 in the year 2000.
History
Fields Landing was originally inhabited by the Wiyot people, who lived in the area for thousands of years before the arrival of European settlers. The first European settlers arrived in the area in the 1850s, and the town was named after William Fields, who established a lumber mill in the area in 1858. The mill was the first of its kind in the area, and it quickly became the center of the local economy.
In the late 19th century, Fields Landing became a major port for the lumber industry, and the town grew rapidly. By the early 20th century, the town had become a bustling center of commerce, with a variety of businesses, including a hotel, a bank, a post office, and several stores.
Geography
Fields Landing is located in Humboldt County, California, on the south shore of Humboldt Bay. The town is situated at an elevation of approximately 20 feet above sea level. The climate in Fields Landing is mild and temperate, with average temperatures ranging from the mid-50s to the mid-70s throughout the year.
Economy
The economy of Fields Landing is largely based on the lumber industry. The town is home to several lumber mills, which provide employment for many of the town’s residents. In addition, Fields Landing is home to a variety of small businesses, including restaurants, retail stores, and other services.
Demographics
The population of Fields Landing was estimated to be 1,093 in the year 2000. The racial makeup of the town was 94.3% White, 0.7% African American, 0.7% Native American, 0.7% Asian, 0.7% Pacific Islander, and 2.7% from other races. The median household income in Fields Landing was $37,500 in 2000. The median age of the town’s residents was 37.5 years.
Common Questions
What is Per Capita Income in Fields Landing?
Per Capita income in Fields Landing is $20,091.
What is the Median Household income in Fields Landing?
Median Household Income in Fields Landing is $71,310.
What is Inequality or Gini Index in Fields Landing?
Inequality or Gini Index in Fields Landing is 0.04.
What is the Total Population of Fields Landing?
Total Population of Fields Landing is 629.
What is the Total Male Population of Fields Landing?
Total Male Population of Fields Landing is 231.
What is the Total Female Population of Fields Landing?
Total Female Population of Fields Landing is 398.
What is the Ratio of Males per 100 Females in Fields Landing?
There are 58.04 Males per 100 Females in Fields Landing.
What is the Ratio of Females per 100 Males in Fields Landing?
There are 172.29 Females per 100 Males in Fields Landing.
What is the Median Population Age in Fields Landing?
Median Population Age in Fields Landing is 27.4 Years.
What is the Average Family Size in Fields Landing
Average Family Size in Fields Landing is 2.2 People.
What is the Average Household Size in Fields Landing
Average Household Size in Fields Landing is 4.2 People.
How Large is the Labor Force in Fields Landing?
There are 411 People in the Labor Forcein in Fields Landing.
What is the Percentage of People in the Labor Force in Fields Landing?
65.3% of People are in the Labor Force in Fields Landing.
What is the Unemployment Rate in Fields Landing?
Unemployment Rate in Fields Landing is 20.7%.