Cities with the Highest Percentage of Population with a Degree in Engineering in Maine
RELATED REPORTS & OPTIONS
Engineering
Maine
Compare Cities
Map of Cities with the Highest Percentage of Population with a Degree in Engineering in Maine
0.0%
50.0%
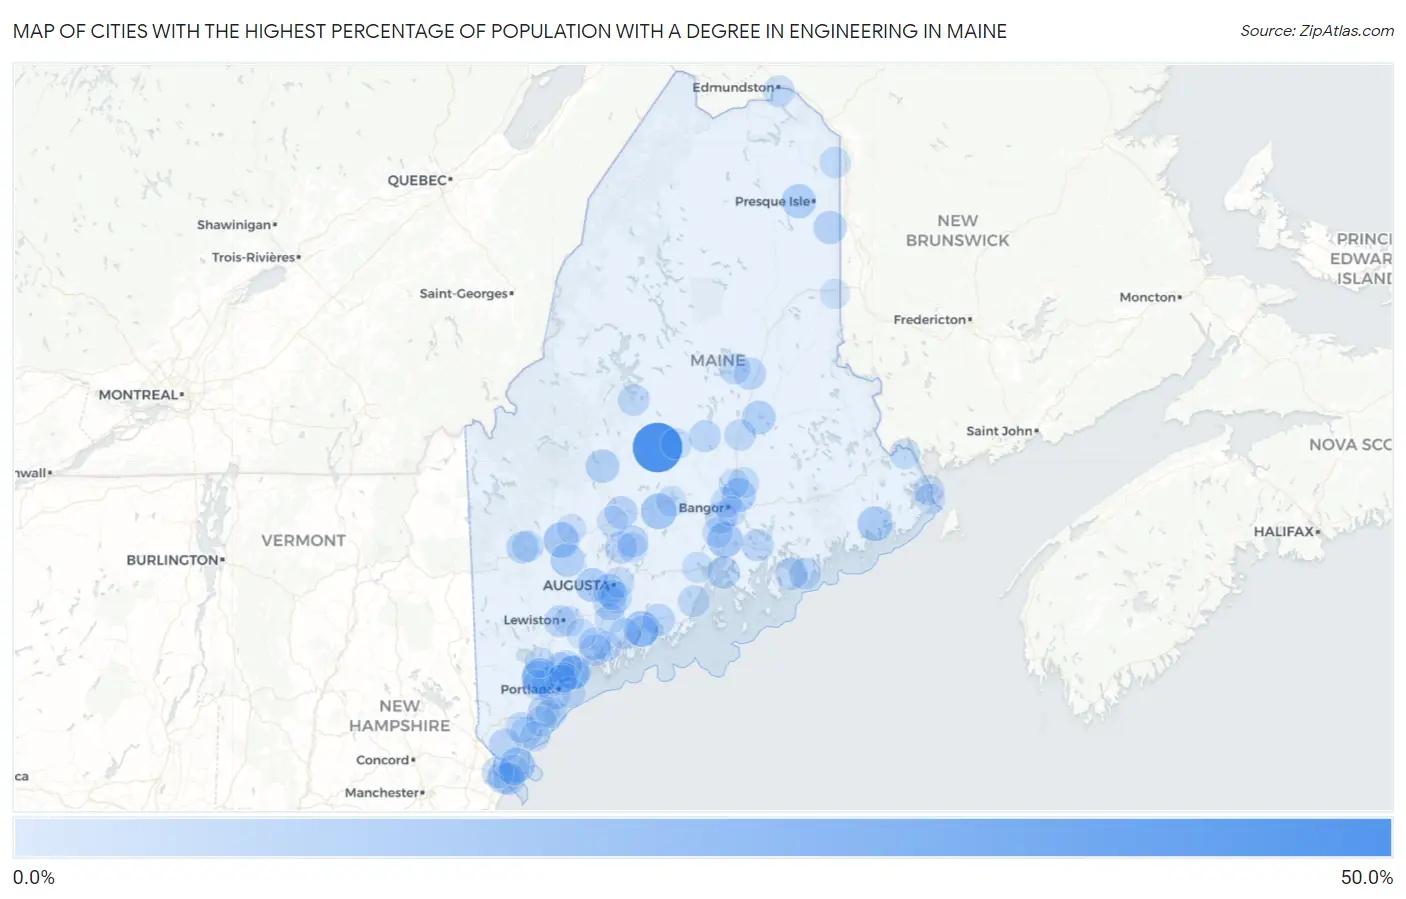
Cities with the Highest Percentage of Population with a Degree in Engineering in Maine
| City | % Graduates | vs State | vs National | |
| 1. | Guilford | 50.0% | 5.1%(+44.9)#1 | 7.6%(+42.4)#163 |
| 2. | Turner | 22.2% | 5.1%(+17.1)#2 | 7.6%(+14.6)#827 |
| 3. | South Berwick | 18.7% | 5.1%(+13.6)#3 | 7.6%(+11.1)#1,201 |
| 4. | South Windham | 16.2% | 5.1%(+11.1)#4 | 7.6%(+8.57)#1,617 |
| 5. | Pittsfield | 15.5% | 5.1%(+10.4)#5 | 7.6%(+7.84)#1,772 |
| 6. | Dunstan | 14.9% | 5.1%(+9.77)#6 | 7.6%(+7.23)#1,897 |
| 7. | Newcastle | 14.7% | 5.1%(+9.56)#7 | 7.6%(+7.02)#1,945 |
| 8. | Bucksport | 14.4% | 5.1%(+9.27)#8 | 7.6%(+6.73)#2,004 |
| 9. | Wilton | 14.1% | 5.1%(+9.02)#9 | 7.6%(+6.48)#2,106 |
| 10. | Northeast Harbor | 13.6% | 5.1%(+8.47)#10 | 7.6%(+5.93)#2,280 |
| 11. | Cape Neddick | 13.3% | 5.1%(+8.24)#11 | 7.6%(+5.70)#2,356 |
| 12. | Machias | 12.8% | 5.1%(+7.68)#12 | 7.6%(+5.14)#2,567 |
| 13. | Jonesport | 12.7% | 5.1%(+7.57)#13 | 7.6%(+5.03)#2,611 |
| 14. | Littlejohn Island | 12.0% | 5.1%(+6.89)#14 | 7.6%(+4.35)#2,893 |
| 15. | Greene | 11.3% | 5.1%(+6.23)#15 | 7.6%(+3.69)#3,203 |
| 16. | Mapleton | 11.1% | 5.1%(+6.00)#16 | 7.6%(+3.46)#3,326 |
| 17. | Winthrop | 11.0% | 5.1%(+5.87)#17 | 7.6%(+3.33)#3,414 |
| 18. | Orono | 10.9% | 5.1%(+5.77)#18 | 7.6%(+3.23)#3,475 |
| 19. | Livermore Falls | 10.4% | 5.1%(+5.25)#19 | 7.6%(+2.72)#3,816 |
| 20. | Lincoln | 10.0% | 5.1%(+4.92)#20 | 7.6%(+2.38)#4,047 |
| 21. | Bingham | 9.9% | 5.1%(+4.75)#21 | 7.6%(+2.21)#4,203 |
| 22. | Oak Hill | 9.7% | 5.1%(+4.63)#22 | 7.6%(+2.09)#4,292 |
| 23. | Little Falls | 9.3% | 5.1%(+4.18)#23 | 7.6%(+1.64)#4,649 |
| 24. | Mars Hill | 9.2% | 5.1%(+4.08)#24 | 7.6%(+1.54)#4,736 |
| 25. | Veazie | 9.0% | 5.1%(+3.91)#25 | 7.6%(+1.37)#4,895 |
| 26. | Kittery | 8.6% | 5.1%(+3.52)#26 | 7.6%(+0.983)#5,276 |
| 27. | Kezar Falls | 8.5% | 5.1%(+3.37)#27 | 7.6%(+0.827)#5,426 |
| 28. | Gardiner | 8.3% | 5.1%(+3.22)#28 | 7.6%(+0.679)#5,595 |
| 29. | Cousins Island | 8.3% | 5.1%(+3.19)#29 | 7.6%(+0.651)#5,616 |
| 30. | Skowhegan | 8.1% | 5.1%(+3.03)#30 | 7.6%(+0.493)#5,796 |
| 31. | Castine | 7.5% | 5.1%(+2.41)#31 | 7.6%(-0.125)#6,559 |
| 32. | Topsham | 7.5% | 5.1%(+2.41)#32 | 7.6%(-0.128)#6,560 |
| 33. | Hallowell | 7.2% | 5.1%(+2.05)#33 | 7.6%(-0.488)#7,043 |
| 34. | Waldoboro | 7.1% | 5.1%(+2.03)#34 | 7.6%(-0.505)#7,060 |
| 35. | Bar Harbor | 7.1% | 5.1%(+1.95)#35 | 7.6%(-0.589)#7,198 |
| 36. | Kittery Point | 7.0% | 5.1%(+1.94)#36 | 7.6%(-0.598)#7,206 |
| 37. | North Berwick | 7.0% | 5.1%(+1.91)#37 | 7.6%(-0.630)#7,242 |
| 38. | Ellsworth | 6.8% | 5.1%(+1.74)#38 | 7.6%(-0.802)#7,485 |
| 39. | Rumford | 6.8% | 5.1%(+1.74)#39 | 7.6%(-0.803)#7,487 |
| 40. | East Millinocket | 6.7% | 5.1%(+1.58)#40 | 7.6%(-0.956)#7,694 |
| 41. | Hampden | 6.5% | 5.1%(+1.40)#41 | 7.6%(-1.14)#7,976 |
| 42. | Milo | 6.3% | 5.1%(+1.19)#42 | 7.6%(-1.35)#8,310 |
| 43. | Fairfield | 6.2% | 5.1%(+1.11)#43 | 7.6%(-1.43)#8,472 |
| 44. | Saco | 6.2% | 5.1%(+1.10)#44 | 7.6%(-1.44)#8,479 |
| 45. | Bradley | 6.2% | 5.1%(+1.05)#45 | 7.6%(-1.49)#8,578 |
| 46. | Oakland | 6.1% | 5.1%(+0.986)#46 | 7.6%(-1.55)#8,683 |
| 47. | Auburn | 6.1% | 5.1%(+0.970)#47 | 7.6%(-1.57)#8,707 |
| 48. | Winter Harbor | 5.9% | 5.1%(+0.774)#48 | 7.6%(-1.77)#9,037 |
| 49. | Yarmouth | 5.8% | 5.1%(+0.668)#49 | 7.6%(-1.87)#9,186 |
| 50. | South Eliot | 5.7% | 5.1%(+0.636)#50 | 7.6%(-1.90)#9,236 |
| 51. | Greenville | 5.5% | 5.1%(+0.392)#51 | 7.6%(-2.15)#9,664 |
| 52. | Madawaska | 5.5% | 5.1%(+0.371)#52 | 7.6%(-2.17)#9,698 |
| 53. | South Portland | 5.4% | 5.1%(+0.250)#53 | 7.6%(-2.29)#9,905 |
| 54. | Westbrook | 5.3% | 5.1%(+0.195)#54 | 7.6%(-2.34)#10,006 |
| 55. | Brunswick | 5.2% | 5.1%(+0.135)#55 | 7.6%(-2.40)#10,116 |
| 56. | Camden | 5.2% | 5.1%(+0.093)#56 | 7.6%(-2.45)#10,167 |
| 57. | Howland | 5.2% | 5.1%(+0.087)#57 | 7.6%(-2.45)#10,178 |
| 58. | Damariscotta | 5.2% | 5.1%(+0.077)#58 | 7.6%(-2.46)#10,196 |
| 59. | Mexico | 5.2% | 5.1%(+0.042)#59 | 7.6%(-2.50)#10,260 |
| 60. | Randolph | 5.2% | 5.1%(+0.042)#60 | 7.6%(-2.50)#10,261 |
| 61. | Millinocket | 4.8% | 5.1%(-0.326)#61 | 7.6%(-2.87)#10,944 |
| 62. | Limestone | 4.6% | 5.1%(-0.503)#62 | 7.6%(-3.04)#11,233 |
| 63. | Kennebunk | 4.6% | 5.1%(-0.517)#63 | 7.6%(-3.06)#11,262 |
| 64. | Wiscasset | 4.5% | 5.1%(-0.606)#64 | 7.6%(-3.15)#11,422 |
| 65. | Old Orchard Beach | 4.4% | 5.1%(-0.665)#65 | 7.6%(-3.20)#11,533 |
| 66. | West Kennebunk | 4.4% | 5.1%(-0.718)#66 | 7.6%(-3.26)#11,617 |
| 67. | Milbridge | 4.1% | 5.1%(-1.04)#67 | 7.6%(-3.58)#12,197 |
| 68. | Dover Foxcroft | 4.0% | 5.1%(-1.07)#68 | 7.6%(-3.61)#12,238 |
| 69. | Belfast | 4.0% | 5.1%(-1.12)#69 | 7.6%(-3.66)#12,336 |
| 70. | Bangor | 3.8% | 5.1%(-1.27)#70 | 7.6%(-3.81)#12,585 |
| 71. | Kingfield | 3.8% | 5.1%(-1.31)#71 | 7.6%(-3.85)#12,655 |
| 72. | Milford | 3.7% | 5.1%(-1.42)#72 | 7.6%(-3.96)#12,870 |
| 73. | Augusta | 3.7% | 5.1%(-1.42)#73 | 7.6%(-3.96)#12,879 |
| 74. | Calais | 3.7% | 5.1%(-1.43)#74 | 7.6%(-3.97)#12,886 |
| 75. | Cumberland Center | 3.5% | 5.1%(-1.56)#75 | 7.6%(-4.10)#13,145 |
| 76. | Biddeford | 3.4% | 5.1%(-1.75)#76 | 7.6%(-4.29)#13,461 |
| 77. | Eastport | 3.4% | 5.1%(-1.75)#77 | 7.6%(-4.29)#13,464 |
| 78. | Portland | 3.3% | 5.1%(-1.76)#78 | 7.6%(-4.30)#13,479 |
| 79. | Gorham | 3.3% | 5.1%(-1.82)#79 | 7.6%(-4.36)#13,586 |
| 80. | Falmouth | 3.2% | 5.1%(-1.89)#80 | 7.6%(-4.43)#13,694 |
| 81. | Winterport | 3.2% | 5.1%(-1.94)#81 | 7.6%(-4.48)#13,788 |
| 82. | Newport | 3.1% | 5.1%(-1.98)#82 | 7.6%(-4.52)#13,848 |
| 83. | Norridgewock | 3.1% | 5.1%(-2.00)#83 | 7.6%(-4.54)#13,881 |
| 84. | Richmond | 3.1% | 5.1%(-2.05)#84 | 7.6%(-4.59)#13,960 |
| 85. | North Windham | 3.0% | 5.1%(-2.07)#85 | 7.6%(-4.61)#13,989 |
| 86. | York Harbor | 2.9% | 5.1%(-2.19)#86 | 7.6%(-4.73)#14,232 |
| 87. | Bath | 2.7% | 5.1%(-2.42)#87 | 7.6%(-4.96)#14,596 |
| 88. | Winslow | 2.6% | 5.1%(-2.47)#88 | 7.6%(-5.01)#14,674 |
| 89. | Old Town | 2.3% | 5.1%(-2.77)#89 | 7.6%(-5.31)#15,122 |
| 90. | Falmouth Foreside | 2.3% | 5.1%(-2.78)#90 | 7.6%(-5.32)#15,139 |
| 91. | Brewer | 2.3% | 5.1%(-2.79)#91 | 7.6%(-5.33)#15,169 |
| 92. | Lubec | 2.3% | 5.1%(-2.85)#92 | 7.6%(-5.39)#15,262 |
| 93. | Bethel | 2.2% | 5.1%(-2.89)#93 | 7.6%(-5.43)#15,324 |
| 94. | Cornish | 2.2% | 5.1%(-2.92)#94 | 7.6%(-5.46)#15,375 |
| 95. | Kennebunkport | 2.2% | 5.1%(-2.93)#95 | 7.6%(-5.47)#15,393 |
| 96. | Lewiston | 2.0% | 5.1%(-3.09)#96 | 7.6%(-5.63)#15,654 |
| 97. | Farmingdale | 1.8% | 5.1%(-3.29)#97 | 7.6%(-5.83)#15,973 |
| 98. | Lisbon Falls | 1.7% | 5.1%(-3.45)#98 | 7.6%(-5.99)#16,183 |
| 99. | Houlton | 1.7% | 5.1%(-3.45)#99 | 7.6%(-5.99)#16,192 |
| 100. | Farmington | 1.5% | 5.1%(-3.57)#100 | 7.6%(-6.11)#16,369 |
1
2Common Questions
What are the Top 10 Cities with the Highest Percentage of Population with a Degree in Engineering in Maine?
Top 10 Cities with the Highest Percentage of Population with a Degree in Engineering in Maine are:
#1
50.0%
#2
16.2%
#3
15.5%
#4
14.7%
#5
14.4%
#6
14.1%
#7
13.3%
#8
12.8%
#9
12.0%
#10
11.1%
What city has the Highest Percentage of Population with a Degree in Engineering in Maine?
Guilford has the Highest Percentage of Population with a Degree in Engineering in Maine with 50.0%.
What is the Percentage of Population with a Degree in Engineering in the State of Maine?
Percentage of Population with a Degree in Engineering in Maine is 5.1%.
What is the Percentage of Population with a Degree in Engineering in the United States?
Percentage of Population with a Degree in Engineering in the United States is 7.6%.