Cities with the Highest Percentage of Population with a Degree in Engineering in New Mexico
RELATED REPORTS & OPTIONS
Engineering
New Mexico
Compare Cities
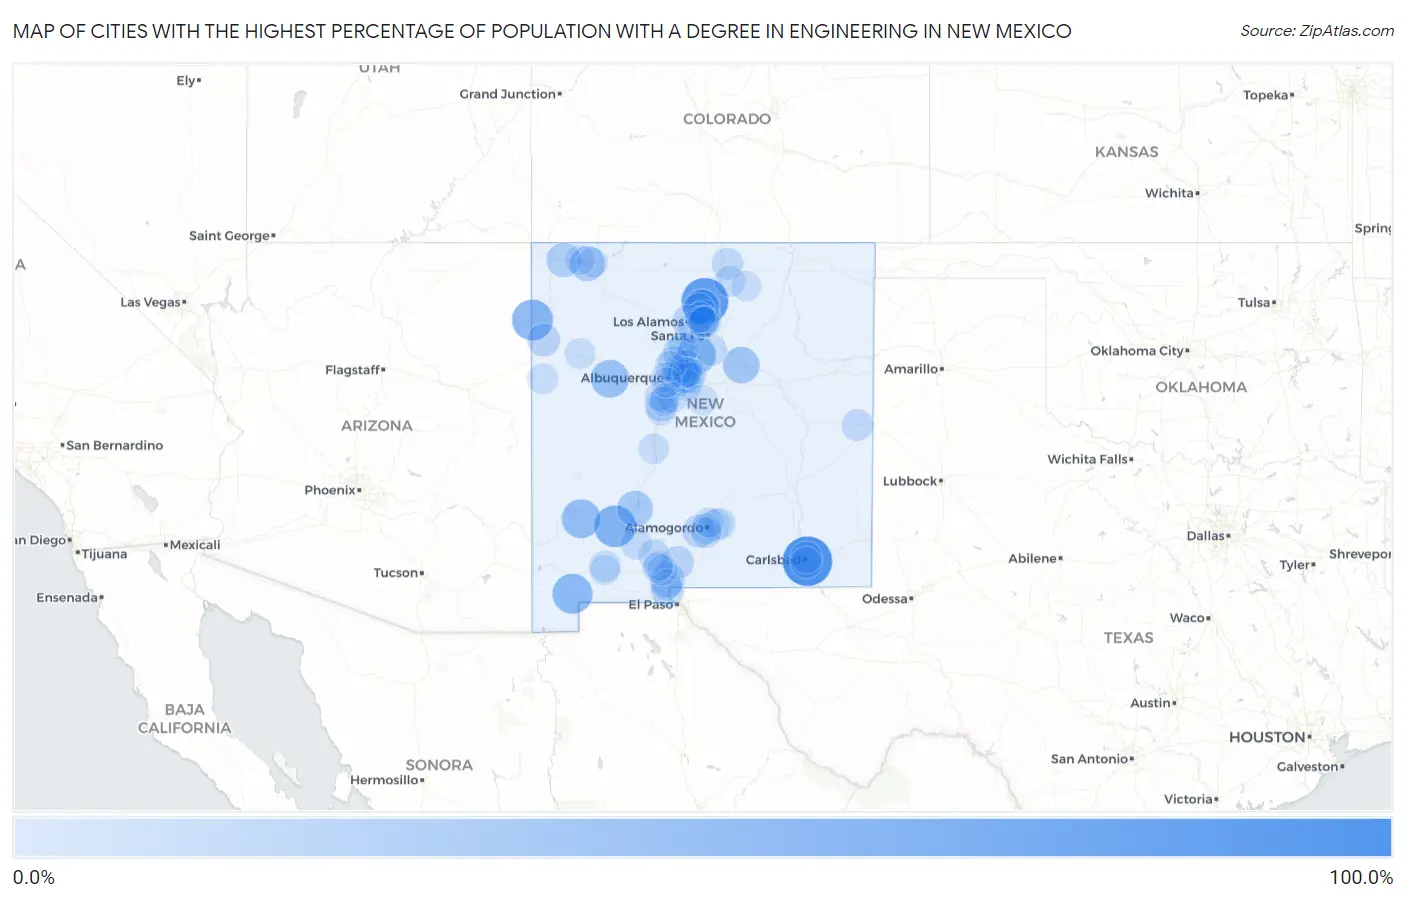
Map of Cities with the Highest Percentage of Population with a Degree in Engineering in New Mexico
0.0%
100.0%
Cities with the Highest Percentage of Population with a Degree in Engineering in New Mexico
| City | % Graduates | vs State | vs National | |
| 1. | Livingston Wheeler | 100.0% | 7.6%(+92.4)#1 | 7.6%(+92.4)#2 |
| 2. | Canova | 86.1% | 7.6%(+78.5)#2 | 7.6%(+78.4)#64 |
| 3. | Hillsboro | 61.5% | 7.6%(+54.0)#3 | 7.6%(+53.9)#112 |
| 4. | Navajo | 58.2% | 7.6%(+50.6)#4 | 7.6%(+50.6)#130 |
| 5. | Crestview | 55.2% | 7.6%(+47.6)#5 | 7.6%(+47.5)#142 |
| 6. | Hachita | 53.3% | 7.6%(+45.8)#6 | 7.6%(+45.7)#151 |
| 7. | Borrego Pass | 50.0% | 7.6%(+42.4)#7 | 7.6%(+42.4)#170 |
| 8. | Madrid | 48.1% | 7.6%(+40.6)#8 | 7.6%(+40.5)#190 |
| 9. | Lake Roberts | 47.1% | 7.6%(+39.5)#9 | 7.6%(+39.4)#198 |
| 10. | Fruitland | 44.9% | 7.6%(+37.3)#10 | 7.6%(+37.2)#214 |
| 11. | Mccartys Village | 43.2% | 7.6%(+35.7)#11 | 7.6%(+35.6)#226 |
| 12. | Alcalde | 36.8% | 7.6%(+29.3)#12 | 7.6%(+29.2)#308 |
| 13. | Villanueva | 36.4% | 7.6%(+28.9)#13 | 7.6%(+28.8)#314 |
| 14. | Little Walnut | 34.9% | 7.6%(+27.4)#14 | 7.6%(+27.3)#336 |
| 15. | Elephant Butte | 33.2% | 7.6%(+25.7)#15 | 7.6%(+25.6)#379 |
| 16. | Bluewater | 31.7% | 7.6%(+24.1)#16 | 7.6%(+24.1)#401 |
| 17. | Lee Acres | 29.5% | 7.6%(+22.0)#17 | 7.6%(+21.9)#457 |
| 18. | Ojo Encino | 28.6% | 7.6%(+21.0)#18 | 7.6%(+20.9)#483 |
| 19. | Waterflow | 27.7% | 7.6%(+20.2)#19 | 7.6%(+20.1)#532 |
| 20. | Vado | 27.4% | 7.6%(+19.8)#20 | 7.6%(+19.7)#540 |
| 21. | Carnuel | 26.3% | 7.6%(+18.7)#21 | 7.6%(+18.6)#585 |
| 22. | San Felipe Pueblo | 24.0% | 7.6%(+16.4)#22 | 7.6%(+16.4)#717 |
| 23. | Cedar Crest | 23.3% | 7.6%(+15.7)#23 | 7.6%(+15.7)#762 |
| 24. | La Villita | 22.5% | 7.6%(+15.0)#24 | 7.6%(+14.9)#805 |
| 25. | San Jose Cdp Rio Arriba County | 20.7% | 7.6%(+13.2)#25 | 7.6%(+13.1)#982 |
| 26. | Rio Rancho Estates | 20.1% | 7.6%(+12.6)#26 | 7.6%(+12.5)#1,019 |
| 27. | White Sands | 20.1% | 7.6%(+12.5)#27 | 7.6%(+12.4)#1,020 |
| 28. | Rock Springs | 20.0% | 7.6%(+12.4)#28 | 7.6%(+12.4)#1,029 |
| 29. | Holloman Afb | 19.6% | 7.6%(+12.1)#29 | 7.6%(+12.0)#1,099 |
| 30. | Los Alamos | 19.5% | 7.6%(+11.9)#30 | 7.6%(+11.8)#1,112 |
| 31. | La Madera | 19.4% | 7.6%(+11.8)#31 | 7.6%(+11.8)#1,117 |
| 32. | Sausal | 18.8% | 7.6%(+11.2)#32 | 7.6%(+11.1)#1,193 |
| 33. | La Union | 18.3% | 7.6%(+10.8)#33 | 7.6%(+10.7)#1,235 |
| 34. | El Valle De Arroyo Seco | 17.6% | 7.6%(+10.0)#34 | 7.6%(+9.93)#1,342 |
| 35. | Thunder Mountain | 16.7% | 7.6%(+9.16)#35 | 7.6%(+9.08)#1,490 |
| 36. | White Rock | 15.7% | 7.6%(+8.15)#36 | 7.6%(+8.06)#1,729 |
| 37. | La Huerta | 15.2% | 7.6%(+7.61)#37 | 7.6%(+7.52)#1,830 |
| 38. | Edith Enclave | 14.9% | 7.6%(+7.36)#38 | 7.6%(+7.28)#1,889 |
| 39. | Questa | 14.4% | 7.6%(+6.79)#39 | 7.6%(+6.70)#2,008 |
| 40. | Cannon Afb | 14.0% | 7.6%(+6.42)#40 | 7.6%(+6.34)#2,148 |
| 41. | Keeler Farm | 13.9% | 7.6%(+6.37)#41 | 7.6%(+6.29)#2,168 |
| 42. | High Rolls | 13.7% | 7.6%(+6.14)#42 | 7.6%(+6.05)#2,244 |
| 43. | Sedillo | 13.6% | 7.6%(+6.05)#43 | 7.6%(+5.97)#2,268 |
| 44. | Lamy | 13.6% | 7.6%(+6.03)#44 | 7.6%(+5.94)#2,276 |
| 45. | Hatch | 13.2% | 7.6%(+5.68)#45 | 7.6%(+5.60)#2,394 |
| 46. | Radium Springs | 13.2% | 7.6%(+5.68)#46 | 7.6%(+5.60)#2,395 |
| 47. | Sandia Park | 13.2% | 7.6%(+5.60)#47 | 7.6%(+5.52)#2,420 |
| 48. | Ponderosa Pine | 13.1% | 7.6%(+5.49)#48 | 7.6%(+5.40)#2,466 |
| 49. | Carlsbad | 13.0% | 7.6%(+5.48)#49 | 7.6%(+5.40)#2,468 |
| 50. | Cloudcroft | 13.0% | 7.6%(+5.40)#50 | 7.6%(+5.32)#2,512 |
| 51. | Conejo | 12.8% | 7.6%(+5.21)#51 | 7.6%(+5.12)#2,573 |
| 52. | Chamberino | 12.6% | 7.6%(+5.02)#52 | 7.6%(+4.94)#2,638 |
| 53. | Dona Ana | 12.5% | 7.6%(+4.93)#53 | 7.6%(+4.85)#2,663 |
| 54. | Las Campanas | 12.4% | 7.6%(+4.88)#54 | 7.6%(+4.79)#2,724 |
| 55. | San Antonito Cdp Bernalillo County | 12.3% | 7.6%(+4.76)#55 | 7.6%(+4.68)#2,768 |
| 56. | Tres Arroyos | 12.2% | 7.6%(+4.64)#56 | 7.6%(+4.56)#2,805 |
| 57. | Taos Pueblo | 11.8% | 7.6%(+4.28)#57 | 7.6%(+4.19)#2,964 |
| 58. | Sandia Heights | 11.7% | 7.6%(+4.16)#58 | 7.6%(+4.08)#3,016 |
| 59. | Paa-Ko | 11.7% | 7.6%(+4.13)#59 | 7.6%(+4.05)#3,038 |
| 60. | Valle Vista | 11.7% | 7.6%(+4.12)#60 | 7.6%(+4.04)#3,043 |
| 61. | Alamogordo | 11.1% | 7.6%(+3.56)#61 | 7.6%(+3.48)#3,305 |
| 62. | Nambe | 11.1% | 7.6%(+3.52)#62 | 7.6%(+3.44)#3,363 |
| 63. | Chamita | 10.8% | 7.6%(+3.24)#63 | 7.6%(+3.16)#3,512 |
| 64. | Jaconita | 10.6% | 7.6%(+3.07)#64 | 7.6%(+2.99)#3,624 |
| 65. | Pojoaque | 10.3% | 7.6%(+2.76)#65 | 7.6%(+2.68)#3,850 |
| 66. | Thoreau | 10.3% | 7.6%(+2.73)#66 | 7.6%(+2.65)#3,874 |
| 67. | Jarales | 10.2% | 7.6%(+2.66)#67 | 7.6%(+2.57)#3,922 |
| 68. | Espanola | 10.2% | 7.6%(+2.64)#68 | 7.6%(+2.55)#3,934 |
| 69. | University Park | 10.2% | 7.6%(+2.60)#69 | 7.6%(+2.52)#3,952 |
| 70. | Zuni Pueblo | 10.1% | 7.6%(+2.58)#70 | 7.6%(+2.50)#3,974 |
| 71. | Boles Acres | 9.9% | 7.6%(+2.32)#71 | 7.6%(+2.24)#4,172 |
| 72. | Penasco | 9.9% | 7.6%(+2.29)#72 | 7.6%(+2.21)#4,201 |
| 73. | Cuyamungue | 9.9% | 7.6%(+2.29)#73 | 7.6%(+2.21)#4,206 |
| 74. | Meadow Lake | 9.9% | 7.6%(+2.29)#74 | 7.6%(+2.21)#4,212 |
| 75. | La Tierra | 9.8% | 7.6%(+2.26)#75 | 7.6%(+2.17)#4,238 |
| 76. | Bernalillo | 9.5% | 7.6%(+1.96)#76 | 7.6%(+1.88)#4,434 |
| 77. | Socorro | 9.5% | 7.6%(+1.92)#77 | 7.6%(+1.84)#4,488 |
| 78. | Placitas Cdp Sandoval County | 9.4% | 7.6%(+1.83)#78 | 7.6%(+1.74)#4,555 |
| 79. | Tano Road | 9.3% | 7.6%(+1.77)#79 | 7.6%(+1.69)#4,598 |
| 80. | Estancia | 9.0% | 7.6%(+1.48)#80 | 7.6%(+1.40)#4,862 |
| 81. | Los Lunas | 9.0% | 7.6%(+1.39)#81 | 7.6%(+1.31)#4,968 |
| 82. | Edgewood | 8.7% | 7.6%(+1.12)#82 | 7.6%(+1.03)#5,233 |
| 83. | Bloomfield | 8.6% | 7.6%(+1.07)#83 | 7.6%(+0.991)#5,269 |
| 84. | Angel Fire | 8.6% | 7.6%(+0.987)#84 | 7.6%(+0.905)#5,354 |
| 85. | Sagar | 8.5% | 7.6%(+0.924)#85 | 7.6%(+0.843)#5,407 |
| 86. | Las Cruces | 8.5% | 7.6%(+0.914)#86 | 7.6%(+0.833)#5,418 |
| 87. | La Mesilla | 8.4% | 7.6%(+0.845)#87 | 7.6%(+0.764)#5,481 |
| 88. | Albuquerque | 8.2% | 7.6%(+0.664)#88 | 7.6%(+0.583)#5,690 |
| 89. | Santo Domingo Pueblo | 8.1% | 7.6%(+0.542)#89 | 7.6%(+0.461)#5,829 |
| 90. | Fairacres | 8.0% | 7.6%(+0.434)#90 | 7.6%(+0.352)#5,970 |
| 91. | Farmington | 7.9% | 7.6%(+0.356)#91 | 7.6%(+0.274)#6,062 |
| 92. | Corrales | 7.9% | 7.6%(+0.341)#92 | 7.6%(+0.260)#6,081 |
| 93. | Canon | 7.7% | 7.6%(+0.126)#93 | 7.6%(+0.045)#6,357 |
| 94. | Deming | 7.6% | 7.6%(+0.050)#94 | 7.6%(-0.031)#6,458 |
| 95. | El Cerro | 7.5% | 7.6%(-0.054)#95 | 7.6%(-0.136)#6,575 |
| 96. | La Luz | 7.4% | 7.6%(-0.159)#96 | 7.6%(-0.240)#6,700 |
| 97. | Tome | 7.3% | 7.6%(-0.263)#97 | 7.6%(-0.344)#6,856 |
| 98. | South Valley | 7.3% | 7.6%(-0.314)#98 | 7.6%(-0.395)#6,917 |
| 99. | Picacho Hills | 7.2% | 7.6%(-0.391)#99 | 7.6%(-0.473)#7,017 |
| 100. | Sandia Knolls | 7.0% | 7.6%(-0.573)#100 | 7.6%(-0.655)#7,279 |
Common Questions
What are the Top 10 Cities with the Highest Percentage of Population with a Degree in Engineering in New Mexico?
Top 10 Cities with the Highest Percentage of Population with a Degree in Engineering in New Mexico are:
#1
100.0%
#2
86.1%
#3
61.5%
#4
58.2%
#5
53.3%
#6
48.1%
#7
47.1%
#8
43.2%
#9
36.8%
#10
36.4%
What city has the Highest Percentage of Population with a Degree in Engineering in New Mexico?
Livingston Wheeler has the Highest Percentage of Population with a Degree in Engineering in New Mexico with 100.0%.
What is the Percentage of Population with a Degree in Engineering in the State of New Mexico?
Percentage of Population with a Degree in Engineering in New Mexico is 7.6%.
What is the Percentage of Population with a Degree in Engineering in the United States?
Percentage of Population with a Degree in Engineering in the United States is 7.6%.