Cities with the Highest Percentage of Population with a Degree in Engineering in Pennsylvania
RELATED REPORTS & OPTIONS
Engineering
Pennsylvania
Compare Cities
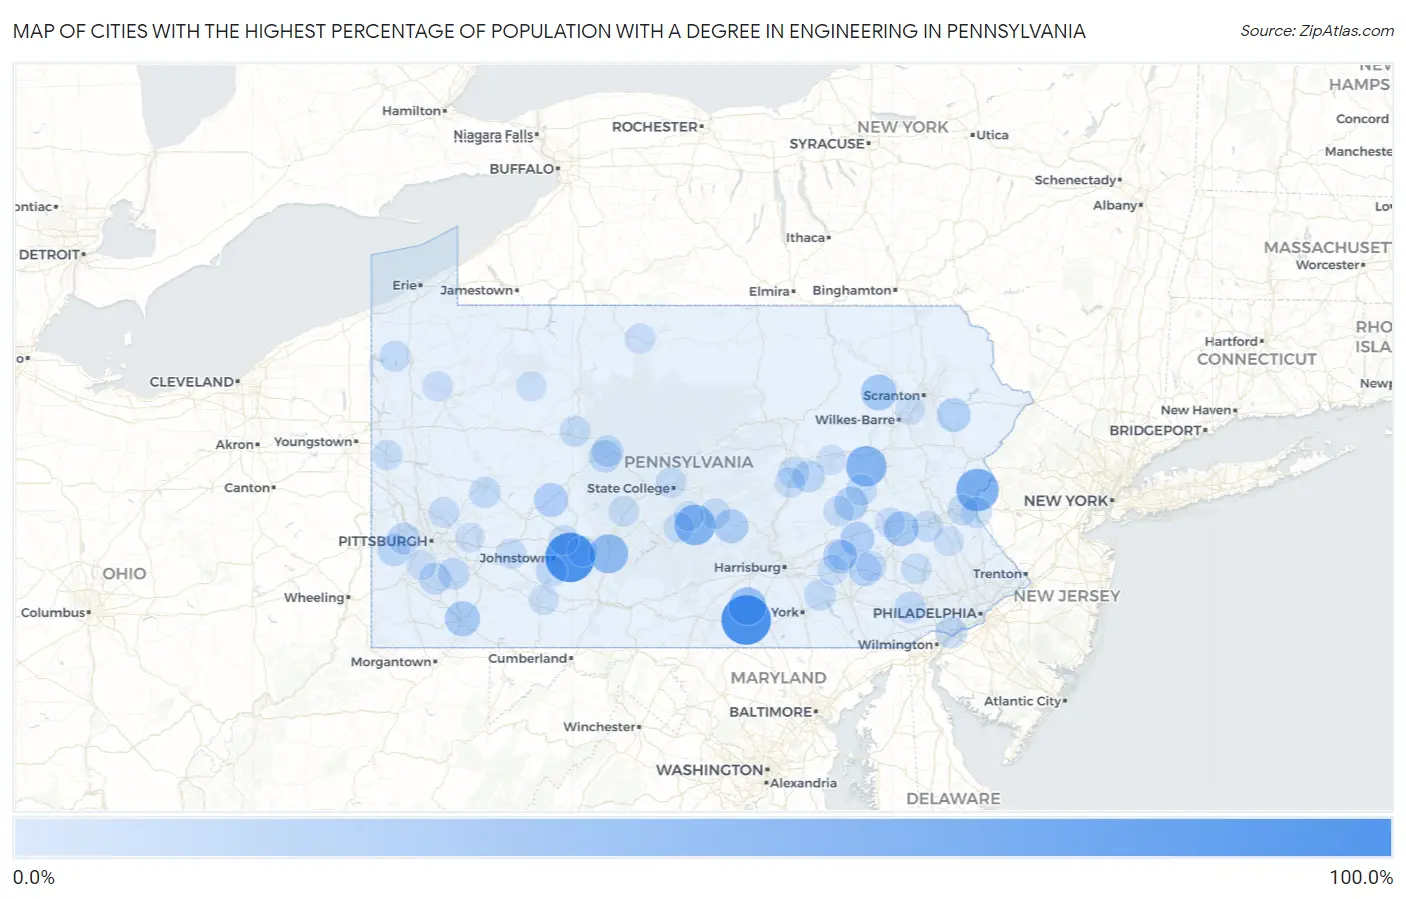
Map of Cities with the Highest Percentage of Population with a Degree in Engineering in Pennsylvania
0.0%
100.0%
Cities with the Highest Percentage of Population with a Degree in Engineering in Pennsylvania
| City | % Graduates | vs State | vs National | |
| 1. | St Michael | 100.0% | 6.7%(+93.3)#1 | 7.6%(+92.4)#11 |
| 2. | Table Rock | 100.0% | 6.7%(+93.3)#2 | 7.6%(+92.4)#39 |
| 3. | Canoe Creek | 100.0% | 6.7%(+93.3)#3 | 7.6%(+92.4)#51 |
| 4. | Eagle Creek | 81.2% | 6.7%(+74.5)#4 | 7.6%(+73.6)#72 |
| 5. | Martins Creek | 68.8% | 6.7%(+62.0)#5 | 7.6%(+61.1)#84 |
| 6. | S N P J Borough | 66.7% | 6.7%(+59.9)#6 | 7.6%(+59.0)#97 |
| 7. | Strodes Mills | 60.5% | 6.7%(+53.7)#7 | 7.6%(+52.8)#116 |
| 8. | Nuremberg | 60.0% | 6.7%(+53.3)#8 | 7.6%(+52.4)#121 |
| 9. | East Freedom | 53.7% | 6.7%(+46.9)#9 | 7.6%(+46.0)#149 |
| 10. | Shelocta Borough | 50.0% | 6.7%(+43.3)#10 | 7.6%(+42.4)#174 |
| 11. | Frisco | 48.2% | 6.7%(+41.5)#11 | 7.6%(+40.6)#186 |
| 12. | Gardners | 48.1% | 6.7%(+41.4)#12 | 7.6%(+40.5)#189 |
| 13. | Glen Hope Borough | 45.5% | 6.7%(+38.7)#13 | 7.6%(+37.8)#212 |
| 14. | Kimberton | 40.3% | 6.7%(+33.6)#14 | 7.6%(+32.7)#262 |
| 15. | Adamsburg Borough | 40.0% | 6.7%(+33.3)#15 | 7.6%(+32.4)#270 |
| 16. | Noxen | 39.0% | 6.7%(+32.3)#16 | 7.6%(+31.4)#281 |
| 17. | New Columbus Borough | 36.8% | 6.7%(+30.1)#17 | 7.6%(+29.2)#307 |
| 18. | Oliver | 36.4% | 6.7%(+29.7)#18 | 7.6%(+28.8)#315 |
| 19. | Virginville | 36.4% | 6.7%(+29.6)#19 | 7.6%(+28.7)#317 |
| 20. | Shippingport Borough | 35.3% | 6.7%(+28.6)#20 | 7.6%(+27.6)#331 |
| 21. | Bald Eagle | 35.0% | 6.7%(+28.3)#21 | 7.6%(+27.4)#334 |
| 22. | Jacksonville Cdp Centre County | 33.3% | 6.7%(+26.6)#22 | 7.6%(+25.7)#377 |
| 23. | Mexico | 32.3% | 6.7%(+25.6)#23 | 7.6%(+24.7)#389 |
| 24. | Commodore | 32.3% | 6.7%(+25.5)#24 | 7.6%(+24.6)#391 |
| 25. | Rehrersburg | 32.1% | 6.7%(+25.4)#25 | 7.6%(+24.5)#393 |
| 26. | Pocono Springs | 31.7% | 6.7%(+25.0)#26 | 7.6%(+24.1)#400 |
| 27. | Forestville | 31.4% | 6.7%(+24.7)#27 | 7.6%(+23.8)#405 |
| 28. | Hebron | 30.8% | 6.7%(+24.0)#28 | 7.6%(+23.1)#419 |
| 29. | Donegal Borough | 30.0% | 6.7%(+23.3)#29 | 7.6%(+22.4)#449 |
| 30. | Springboro Borough | 29.2% | 6.7%(+22.4)#30 | 7.6%(+21.5)#470 |
| 31. | Leesport Borough | 28.5% | 6.7%(+21.7)#31 | 7.6%(+20.8)#501 |
| 32. | Schoeneck | 25.9% | 6.7%(+19.1)#32 | 7.6%(+18.2)#604 |
| 33. | Bulger | 25.8% | 6.7%(+19.1)#33 | 7.6%(+18.2)#607 |
| 34. | Hyde | 25.7% | 6.7%(+18.9)#34 | 7.6%(+18.0)#614 |
| 35. | Timblin Borough | 25.0% | 6.7%(+18.3)#35 | 7.6%(+17.4)#664 |
| 36. | Snydertown | 23.9% | 6.7%(+17.1)#36 | 7.6%(+16.2)#729 |
| 37. | Enlow | 23.7% | 6.7%(+16.9)#37 | 7.6%(+16.0)#741 |
| 38. | Baidland | 23.4% | 6.7%(+16.6)#38 | 7.6%(+15.7)#757 |
| 39. | Collinsburg | 23.3% | 6.7%(+16.5)#39 | 7.6%(+15.6)#765 |
| 40. | Linwood | 22.9% | 6.7%(+16.1)#40 | 7.6%(+15.2)#783 |
| 41. | Plymptonville | 22.4% | 6.7%(+15.7)#41 | 7.6%(+14.8)#812 |
| 42. | Caln | 22.3% | 6.7%(+15.6)#42 | 7.6%(+14.7)#822 |
| 43. | Pughtown | 22.0% | 6.7%(+15.3)#43 | 7.6%(+14.4)#853 |
| 44. | Maytown | 21.8% | 6.7%(+15.1)#44 | 7.6%(+14.2)#862 |
| 45. | Davidsville | 21.6% | 6.7%(+14.9)#45 | 7.6%(+14.0)#878 |
| 46. | Loretto Borough | 21.5% | 6.7%(+14.8)#46 | 7.6%(+13.8)#885 |
| 47. | Lenape Heights | 21.4% | 6.7%(+14.7)#47 | 7.6%(+13.8)#889 |
| 48. | Duncansville Borough | 21.3% | 6.7%(+14.6)#48 | 7.6%(+13.7)#912 |
| 49. | Kapp Heights | 20.9% | 6.7%(+14.2)#49 | 7.6%(+13.3)#958 |
| 50. | Harmonsburg | 20.7% | 6.7%(+14.0)#50 | 7.6%(+13.0)#984 |
| 51. | Breinigsville | 20.7% | 6.7%(+13.9)#51 | 7.6%(+13.0)#985 |
| 52. | Altamont | 20.4% | 6.7%(+13.7)#52 | 7.6%(+12.8)#1,000 |
| 53. | Raubsville | 20.2% | 6.7%(+13.4)#53 | 7.6%(+12.5)#1,017 |
| 54. | Glen Campbell Borough | 20.0% | 6.7%(+13.3)#54 | 7.6%(+12.4)#1,054 |
| 55. | New Boston | 20.0% | 6.7%(+13.3)#55 | 7.6%(+12.4)#1,057 |
| 56. | West Elizabeth Borough | 19.6% | 6.7%(+12.8)#56 | 7.6%(+11.9)#1,103 |
| 57. | Spring Hill | 19.5% | 6.7%(+12.8)#57 | 7.6%(+11.8)#1,111 |
| 58. | Wyalusing Borough | 19.4% | 6.7%(+12.7)#58 | 7.6%(+11.8)#1,113 |
| 59. | Mount Pocono Borough | 19.4% | 6.7%(+12.7)#59 | 7.6%(+11.8)#1,115 |
| 60. | Treasure Lake | 19.3% | 6.7%(+12.6)#60 | 7.6%(+11.7)#1,128 |
| 61. | Bairdford | 19.2% | 6.7%(+12.5)#61 | 7.6%(+11.6)#1,139 |
| 62. | Maitland | 19.0% | 6.7%(+12.3)#62 | 7.6%(+11.4)#1,156 |
| 63. | Hummels Wharf | 18.9% | 6.7%(+12.2)#63 | 7.6%(+11.3)#1,168 |
| 64. | Tipton | 18.8% | 6.7%(+12.0)#64 | 7.6%(+11.1)#1,192 |
| 65. | Culp | 18.8% | 6.7%(+12.0)#65 | 7.6%(+11.1)#1,199 |
| 66. | Loganville Borough | 18.7% | 6.7%(+12.0)#66 | 7.6%(+11.1)#1,200 |
| 67. | Middletown | 18.3% | 6.7%(+11.5)#67 | 7.6%(+10.6)#1,243 |
| 68. | Toftrees | 18.2% | 6.7%(+11.5)#68 | 7.6%(+10.6)#1,250 |
| 69. | Allensville | 18.2% | 6.7%(+11.4)#69 | 7.6%(+10.5)#1,258 |
| 70. | Millwood | 18.2% | 6.7%(+11.4)#70 | 7.6%(+10.5)#1,259 |
| 71. | Donaldson | 18.2% | 6.7%(+11.4)#71 | 7.6%(+10.5)#1,260 |
| 72. | Reinholds | 18.0% | 6.7%(+11.3)#72 | 7.6%(+10.4)#1,293 |
| 73. | Douglassville | 18.0% | 6.7%(+11.3)#73 | 7.6%(+10.4)#1,298 |
| 74. | Walnutport Borough | 18.0% | 6.7%(+11.2)#74 | 7.6%(+10.3)#1,299 |
| 75. | Delta Borough | 17.7% | 6.7%(+11.0)#75 | 7.6%(+10.1)#1,324 |
| 76. | Mount Gretna Heights | 17.7% | 6.7%(+11.0)#76 | 7.6%(+10.1)#1,326 |
| 77. | Hannasville | 17.6% | 6.7%(+10.9)#77 | 7.6%(+10.00)#1,336 |
| 78. | Homestead Borough | 17.5% | 6.7%(+10.8)#78 | 7.6%(+9.88)#1,350 |
| 79. | Elberta | 17.4% | 6.7%(+10.7)#79 | 7.6%(+9.74)#1,378 |
| 80. | Plumville Borough | 17.4% | 6.7%(+10.7)#80 | 7.6%(+9.74)#1,380 |
| 81. | Roulette | 17.3% | 6.7%(+10.6)#81 | 7.6%(+9.69)#1,392 |
| 82. | Oakwood | 17.1% | 6.7%(+10.4)#82 | 7.6%(+9.50)#1,415 |
| 83. | North Wales Borough | 17.1% | 6.7%(+10.4)#83 | 7.6%(+9.45)#1,427 |
| 84. | Mundys Corner | 16.7% | 6.7%(+9.97)#84 | 7.6%(+9.06)#1,493 |
| 85. | Wattsburg Borough | 16.7% | 6.7%(+9.93)#85 | 7.6%(+9.02)#1,507 |
| 86. | Bolivar Borough | 16.7% | 6.7%(+9.93)#86 | 7.6%(+9.02)#1,511 |
| 87. | Mill Creek Borough | 16.7% | 6.7%(+9.93)#87 | 7.6%(+9.02)#1,519 |
| 88. | Mcmurray | 16.6% | 6.7%(+9.87)#88 | 7.6%(+8.96)#1,545 |
| 89. | Friedens | 16.6% | 6.7%(+9.83)#89 | 7.6%(+8.92)#1,551 |
| 90. | Edenburg | 16.5% | 6.7%(+9.81)#90 | 7.6%(+8.90)#1,554 |
| 91. | Avon | 16.5% | 6.7%(+9.78)#91 | 7.6%(+8.87)#1,559 |
| 92. | Belleville | 16.4% | 6.7%(+9.66)#92 | 7.6%(+8.75)#1,582 |
| 93. | Murrysville | 16.3% | 6.7%(+9.59)#93 | 7.6%(+8.68)#1,592 |
| 94. | Bell Acres Borough | 16.3% | 6.7%(+9.57)#94 | 7.6%(+8.67)#1,596 |
| 95. | West Homestead Borough | 16.3% | 6.7%(+9.56)#95 | 7.6%(+8.65)#1,601 |
| 96. | Browntown | 16.2% | 6.7%(+9.50)#96 | 7.6%(+8.59)#1,615 |
| 97. | Marienville | 16.2% | 6.7%(+9.48)#97 | 7.6%(+8.57)#1,616 |
| 98. | Spinnerstown | 16.0% | 6.7%(+9.26)#98 | 7.6%(+8.35)#1,657 |
| 99. | Confluence Borough | 15.9% | 6.7%(+9.12)#99 | 7.6%(+8.21)#1,687 |
| 100. | Rupert | 15.8% | 6.7%(+9.05)#100 | 7.6%(+8.14)#1,707 |
Common Questions
What are the Top 10 Cities with the Highest Percentage of Population with a Degree in Engineering in Pennsylvania?
Top 10 Cities with the Highest Percentage of Population with a Degree in Engineering in Pennsylvania are:
#1
100.0%
#2
100.0%
#3
68.8%
#4
60.5%
#5
60.0%
#6
53.7%
#7
48.1%
#8
39.0%
#9
36.4%
#10
36.4%
What city has the Highest Percentage of Population with a Degree in Engineering in Pennsylvania?
St Michael has the Highest Percentage of Population with a Degree in Engineering in Pennsylvania with 100.0%.
What is the Percentage of Population with a Degree in Engineering in the State of Pennsylvania?
Percentage of Population with a Degree in Engineering in Pennsylvania is 6.7%.
What is the Percentage of Population with a Degree in Engineering in the United States?
Percentage of Population with a Degree in Engineering in the United States is 7.6%.