Zip Codes with the Highest Percentage of Population with a Degree in Engineering in San Diego, CA
RELATED REPORTS & OPTIONS
Engineering
San Diego
Compare Zip Codes
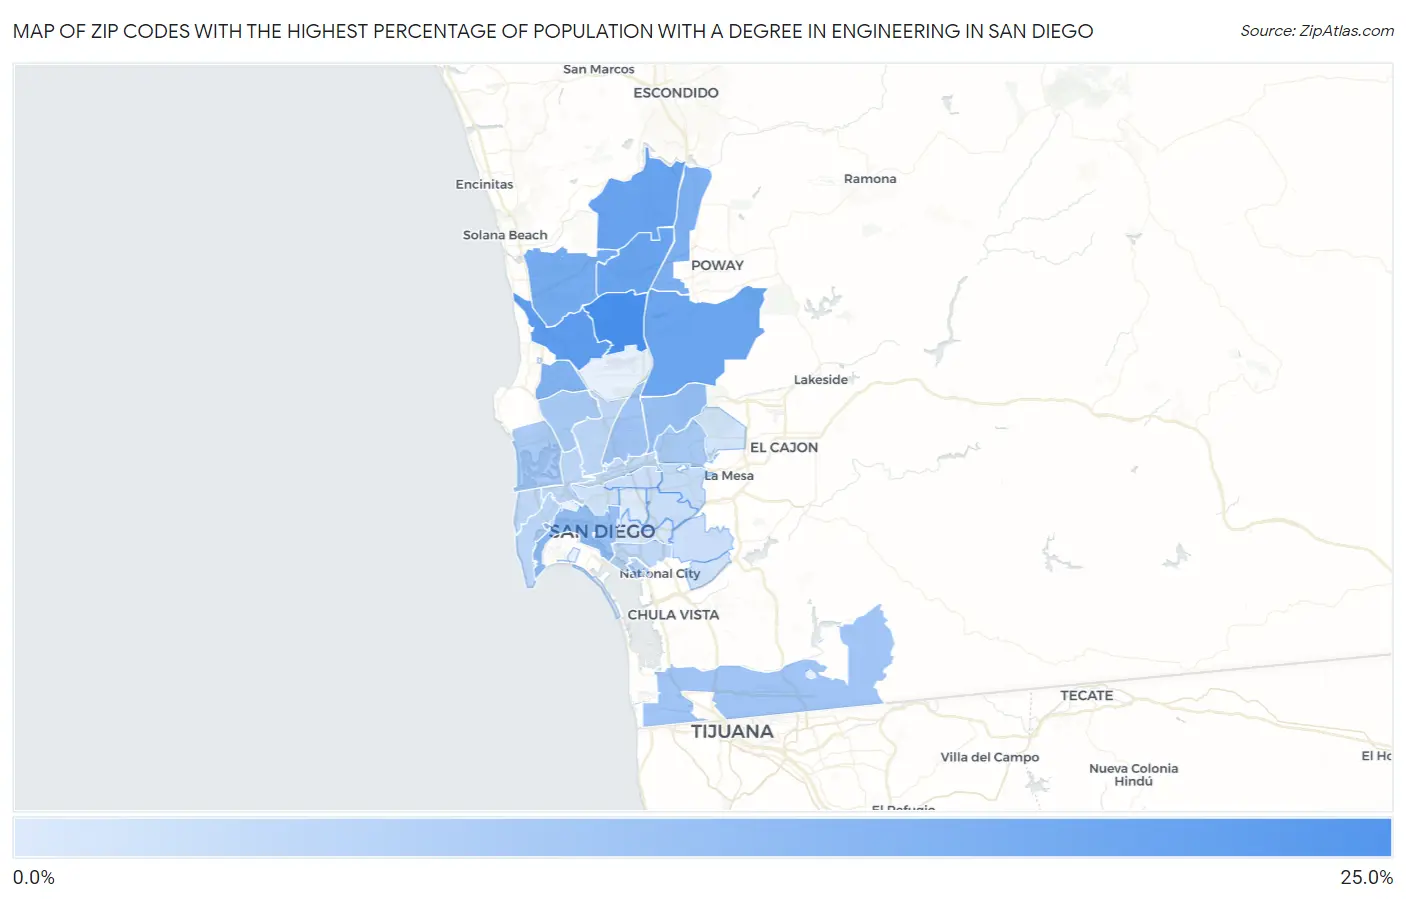
Map of Zip Codes with the Highest Percentage of Population with a Degree in Engineering in San Diego
4.9%
21.6%
Zip Codes with the Highest Percentage of Population with a Degree in Engineering in San Diego, CA
| Zip Code | % Graduates | vs State | vs National | |
| 1. | 92126 | 21.6% | 9.9%(+11.7)#94 | 7.6%(+14.0)#749 |
| 2. | 92121 | 19.0% | 9.9%(+9.03)#121 | 7.6%(+11.3)#1,037 |
| 3. | 92127 | 17.9% | 9.9%(+8.02)#133 | 7.6%(+10.3)#1,167 |
| 4. | 92129 | 17.5% | 9.9%(+7.54)#140 | 7.6%(+9.81)#1,227 |
| 5. | 92131 | 17.2% | 9.9%(+7.23)#146 | 7.6%(+9.51)#1,288 |
| 6. | 92130 | 16.4% | 9.9%(+6.43)#156 | 7.6%(+8.71)#1,427 |
| 7. | 92128 | 15.3% | 9.9%(+5.42)#171 | 7.6%(+7.70)#1,667 |
| 8. | 92122 | 14.9% | 9.9%(+4.93)#178 | 7.6%(+7.21)#1,779 |
| 9. | 92124 | 12.4% | 9.9%(+2.47)#262 | 7.6%(+4.74)#2,687 |
| 10. | 92101 | 12.4% | 9.9%(+2.44)#265 | 7.6%(+4.72)#2,701 |
| 11. | 92154 | 11.2% | 9.9%(+1.30)#320 | 7.6%(+3.58)#3,380 |
| 12. | 92123 | 11.2% | 9.9%(+1.29)#321 | 7.6%(+3.56)#3,393 |
| 13. | 92120 | 10.7% | 9.9%(+0.759)#354 | 7.6%(+3.03)#3,796 |
| 14. | 92117 | 10.5% | 9.9%(+0.614)#367 | 7.6%(+2.89)#3,938 |
| 15. | 92109 | 10.2% | 9.9%(+0.286)#405 | 7.6%(+2.56)#4,263 |
| 16. | 92136 | 8.9% | 9.9%(-0.981)#526 | 7.6%(+1.29)#5,689 |
| 17. | 92106 | 8.5% | 9.9%(-1.41)#577 | 7.6%(+0.865)#6,258 |
| 18. | 92111 | 8.3% | 9.9%(-1.65)#603 | 7.6%(+0.625)#6,627 |
| 19. | 92110 | 8.1% | 9.9%(-1.85)#635 | 7.6%(+0.426)#6,971 |
| 20. | 92113 | 8.0% | 9.9%(-1.90)#641 | 7.6%(+0.374)#7,048 |
| 21. | 92108 | 7.8% | 9.9%(-2.10)#671 | 7.6%(+0.171)#7,417 |
| 22. | 92107 | 7.7% | 9.9%(-2.20)#689 | 7.6%(+0.080)#7,575 |
| 23. | 92115 | 7.4% | 9.9%(-2.52)#740 | 7.6%(-0.242)#8,196 |
| 24. | 92105 | 7.2% | 9.9%(-2.69)#770 | 7.6%(-0.418)#8,520 |
| 25. | 92114 | 6.9% | 9.9%(-3.00)#817 | 7.6%(-0.730)#9,182 |
| 26. | 92116 | 6.8% | 9.9%(-3.13)#829 | 7.6%(-0.852)#9,407 |
| 27. | 92103 | 6.5% | 9.9%(-3.45)#880 | 7.6%(-1.17)#10,064 |
| 28. | 92139 | 6.4% | 9.9%(-3.50)#886 | 7.6%(-1.23)#10,174 |
| 29. | 92119 | 6.0% | 9.9%(-3.94)#958 | 7.6%(-1.66)#11,230 |
| 30. | 92102 | 5.4% | 9.9%(-4.56)#1,052 | 7.6%(-2.28)#12,767 |
| 31. | 92104 | 4.9% | 9.9%(-4.98)#1,091 | 7.6%(-2.70)#13,848 |
1
Common Questions
What are the Top 10 Zip Codes with the Highest Percentage of Population with a Degree in Engineering in San Diego, CA?
Top 10 Zip Codes with the Highest Percentage of Population with a Degree in Engineering in San Diego, CA are:
What zip code has the Highest Percentage of Population with a Degree in Engineering in San Diego, CA?
92126 has the Highest Percentage of Population with a Degree in Engineering in San Diego, CA with 21.6%.
What is the Percentage of Population with a Degree in Engineering in San Diego, CA?
Percentage of Population with a Degree in Engineering in San Diego is 11.6%.
What is the Percentage of Population with a Degree in Engineering in California?
Percentage of Population with a Degree in Engineering in California is 9.9%.
What is the Percentage of Population with a Degree in Engineering in the United States?
Percentage of Population with a Degree in Engineering in the United States is 7.6%.