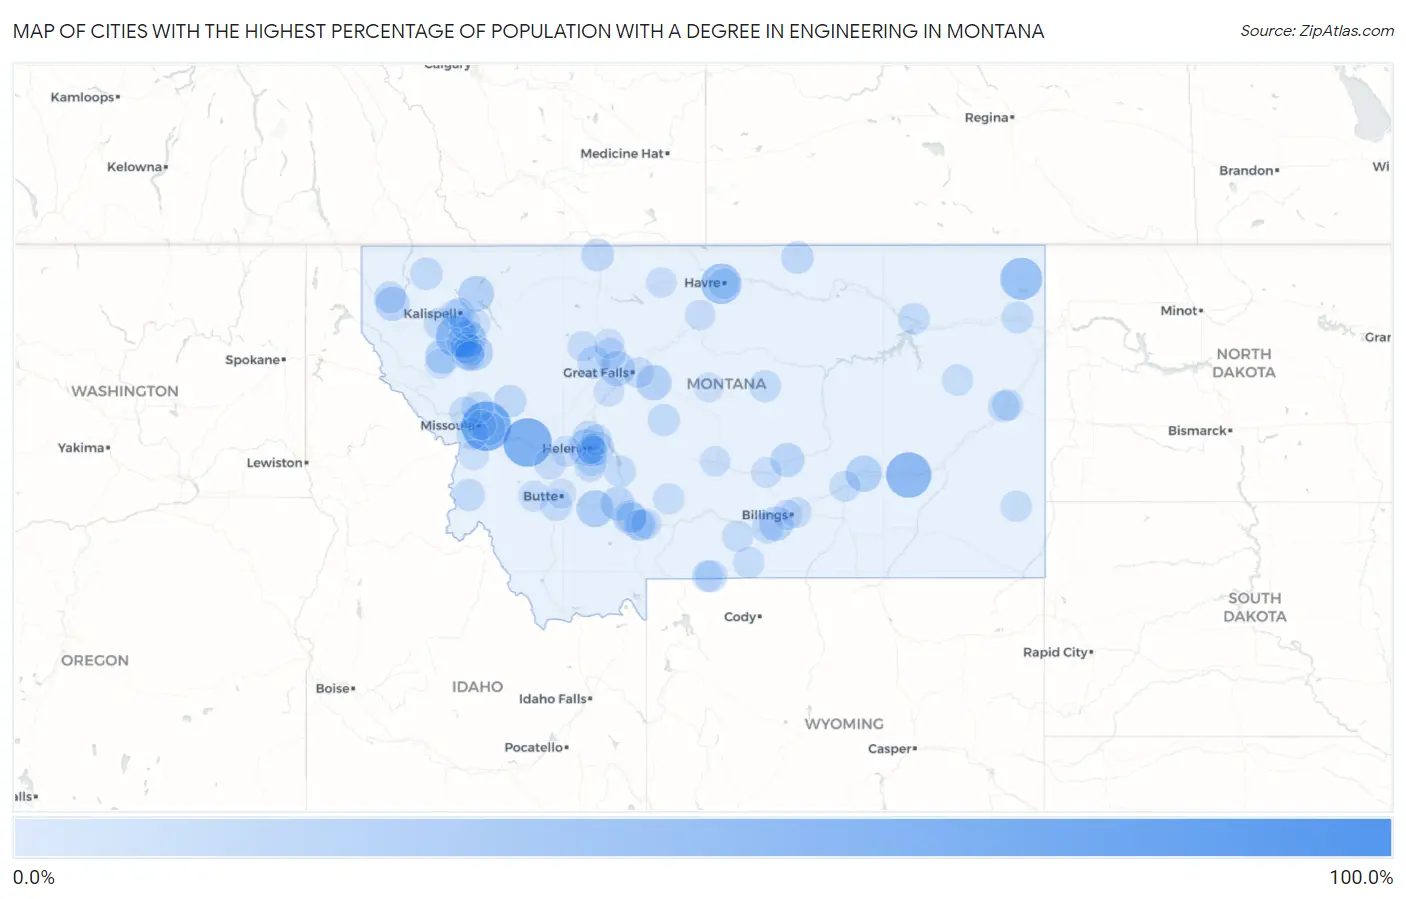
Cities with the Highest Percentage of Population with a Degree in Engineering in Montana
RELATED REPORTS & OPTIONS
Engineering
Montana
Compare Cities
Map of Cities with the Highest Percentage of Population with a Degree in Engineering in Montana
0.0%
100.0%
Cities with the Highest Percentage of Population with a Degree in Engineering in Montana
| City | % Graduates | vs State | vs National | |
| 1. | Canyon Creek | 100.0% | 5.5%(+94.5)#1 | 7.6%(+92.4)#48 |
| 2. | Piltzville | 63.0% | 5.5%(+57.5)#2 | 7.6%(+55.3)#109 |
| 3. | Drummond | 60.0% | 5.5%(+54.5)#3 | 7.6%(+52.4)#120 |
| 4. | Rosebud | 50.0% | 5.5%(+44.5)#4 | 7.6%(+42.4)#181 |
| 5. | Vida | 40.0% | 5.5%(+34.5)#5 | 7.6%(+32.4)#274 |
| 6. | Reserve | 40.0% | 5.5%(+34.5)#6 | 7.6%(+32.4)#275 |
| 7. | St. Mary | 37.8% | 5.5%(+32.3)#7 | 7.6%(+30.1)#294 |
| 8. | Lake Mary Ronan | 36.4% | 5.5%(+30.9)#8 | 7.6%(+28.7)#320 |
| 9. | West Havre | 35.5% | 5.5%(+30.0)#9 | 7.6%(+27.8)#328 |
| 10. | Cardwell | 25.0% | 5.5%(+19.5)#10 | 7.6%(+17.4)#676 |
| 11. | Rollins | 24.1% | 5.5%(+18.7)#11 | 7.6%(+16.5)#710 |
| 12. | Helena West Side | 23.0% | 5.5%(+17.5)#12 | 7.6%(+15.3)#781 |
| 13. | Hysham | 22.6% | 5.5%(+17.1)#13 | 7.6%(+14.9)#800 |
| 14. | Finley Point | 21.4% | 5.5%(+15.9)#14 | 7.6%(+13.7)#910 |
| 15. | Coram | 21.0% | 5.5%(+15.5)#15 | 7.6%(+13.3)#945 |
| 16. | Belt | 20.3% | 5.5%(+14.8)#16 | 7.6%(+12.6)#1,010 |
| 17. | Pine Creek | 19.4% | 5.5%(+13.9)#17 | 7.6%(+11.7)#1,125 |
| 18. | Vaughn | 19.1% | 5.5%(+13.6)#18 | 7.6%(+11.5)#1,151 |
| 19. | Lonepine | 18.5% | 5.5%(+13.0)#19 | 7.6%(+10.9)#1,214 |
| 20. | Laurel | 17.6% | 5.5%(+12.1)#20 | 7.6%(+9.95)#1,339 |
| 21. | Pioneer Junction | 17.4% | 5.5%(+11.9)#21 | 7.6%(+9.74)#1,373 |
| 22. | Amsterdam | 17.1% | 5.5%(+11.6)#22 | 7.6%(+9.43)#1,433 |
| 23. | Wheatland | 16.7% | 5.5%(+11.3)#23 | 7.6%(+9.08)#1,489 |
| 24. | Camp Three | 16.0% | 5.5%(+10.5)#24 | 7.6%(+8.35)#1,654 |
| 25. | Fox | 15.8% | 5.5%(+10.3)#25 | 7.6%(+8.14)#1,711 |
| 26. | East Helena | 14.9% | 5.5%(+9.47)#26 | 7.6%(+7.30)#1,883 |
| 27. | Turah | 14.9% | 5.5%(+9.46)#27 | 7.6%(+7.30)#1,887 |
| 28. | Fairfield | 13.0% | 5.5%(+7.52)#28 | 7.6%(+5.35)#2,496 |
| 29. | Sunburst | 12.7% | 5.5%(+7.22)#29 | 7.6%(+5.05)#2,605 |
| 30. | Rocky Point | 12.5% | 5.5%(+7.02)#30 | 7.6%(+4.85)#2,696 |
| 31. | Turner | 12.5% | 5.5%(+7.02)#31 | 7.6%(+4.85)#2,709 |
| 32. | Pinnacle | 12.5% | 5.5%(+7.02)#32 | 7.6%(+4.85)#2,711 |
| 33. | Seeley Lake | 12.1% | 5.5%(+6.62)#33 | 7.6%(+4.45)#2,856 |
| 34. | Trego | 11.9% | 5.5%(+6.44)#34 | 7.6%(+4.27)#2,922 |
| 35. | Hardy | 11.8% | 5.5%(+6.29)#35 | 7.6%(+4.12)#3,007 |
| 36. | Marion | 11.2% | 5.5%(+5.73)#36 | 7.6%(+3.56)#3,275 |
| 37. | Darby | 11.1% | 5.5%(+5.63)#37 | 7.6%(+3.46)#3,328 |
| 38. | Cooke City | 11.1% | 5.5%(+5.63)#38 | 7.6%(+3.46)#3,348 |
| 39. | Neihart | 11.1% | 5.5%(+5.63)#39 | 7.6%(+3.46)#3,351 |
| 40. | Park City | 10.6% | 5.5%(+5.10)#40 | 7.6%(+2.93)#3,663 |
| 41. | Lolo | 10.6% | 5.5%(+5.10)#41 | 7.6%(+2.93)#3,666 |
| 42. | Roy | 10.5% | 5.5%(+5.05)#42 | 7.6%(+2.88)#3,713 |
| 43. | Libby | 10.5% | 5.5%(+5.02)#43 | 7.6%(+2.85)#3,724 |
| 44. | Evaro | 10.4% | 5.5%(+4.91)#44 | 7.6%(+2.74)#3,799 |
| 45. | Culbertson | 10.3% | 5.5%(+4.78)#45 | 7.6%(+2.61)#3,896 |
| 46. | Townsend | 10.0% | 5.5%(+4.52)#46 | 7.6%(+2.35)#4,062 |
| 47. | Dayton | 9.8% | 5.5%(+4.32)#47 | 7.6%(+2.16)#4,251 |
| 48. | Butte Silver Bow Balance | 9.7% | 5.5%(+4.21)#48 | 7.6%(+2.04)#4,318 |
| 49. | West Glendive | 9.6% | 5.5%(+4.10)#49 | 7.6%(+1.93)#4,407 |
| 50. | Nashua | 9.4% | 5.5%(+3.90)#50 | 7.6%(+1.73)#4,571 |
| 51. | Frenchtown | 9.3% | 5.5%(+3.87)#51 | 7.6%(+1.70)#4,591 |
| 52. | Clancy | 9.1% | 5.5%(+3.61)#52 | 7.6%(+1.44)#4,793 |
| 53. | King Arthur Park | 9.0% | 5.5%(+3.49)#53 | 7.6%(+1.32)#4,956 |
| 54. | Lindisfarne | 8.9% | 5.5%(+3.44)#54 | 7.6%(+1.27)#5,007 |
| 55. | Helena Valley Northwest | 8.8% | 5.5%(+3.34)#55 | 7.6%(+1.17)#5,101 |
| 56. | Circle | 8.8% | 5.5%(+3.28)#56 | 7.6%(+1.11)#5,147 |
| 57. | Absarokee | 8.7% | 5.5%(+3.22)#57 | 7.6%(+1.05)#5,203 |
| 58. | Wilsall | 8.7% | 5.5%(+3.22)#58 | 7.6%(+1.05)#5,219 |
| 59. | Power | 8.7% | 5.5%(+3.22)#59 | 7.6%(+1.05)#5,221 |
| 60. | Silver Gate | 8.7% | 5.5%(+3.22)#60 | 7.6%(+1.05)#5,226 |
| 61. | Red Lodge | 8.7% | 5.5%(+3.21)#61 | 7.6%(+1.04)#5,230 |
| 62. | Ekalaka | 8.5% | 5.5%(+3.00)#62 | 7.6%(+0.827)#5,431 |
| 63. | Glendive | 8.4% | 5.5%(+2.96)#63 | 7.6%(+0.795)#5,454 |
| 64. | Four Corners | 8.4% | 5.5%(+2.94)#64 | 7.6%(+0.767)#5,478 |
| 65. | Deer Lodge | 8.4% | 5.5%(+2.92)#65 | 7.6%(+0.747)#5,495 |
| 66. | Jefferson City | 8.1% | 5.5%(+2.61)#66 | 7.6%(+0.441)#5,854 |
| 67. | Anaconda Deer Lodge County | 8.0% | 5.5%(+2.48)#67 | 7.6%(+0.313)#6,011 |
| 68. | Helena Valley Northeast | 8.0% | 5.5%(+2.48)#68 | 7.6%(+0.312)#6,016 |
| 69. | Kings Point | 7.8% | 5.5%(+2.36)#69 | 7.6%(+0.196)#6,160 |
| 70. | Elliston | 7.8% | 5.5%(+2.36)#70 | 7.6%(+0.196)#6,162 |
| 71. | Custer | 7.7% | 5.5%(+2.21)#71 | 7.6%(+0.045)#6,376 |
| 72. | Batavia | 7.5% | 5.5%(+2.04)#72 | 7.6%(-0.129)#6,562 |
| 73. | Havre | 7.4% | 5.5%(+1.94)#73 | 7.6%(-0.229)#6,687 |
| 74. | Somers | 6.9% | 5.5%(+1.46)#74 | 7.6%(-0.713)#7,369 |
| 75. | Malmstrom Afb | 6.9% | 5.5%(+1.45)#75 | 7.6%(-0.720)#7,377 |
| 76. | Bozeman | 6.9% | 5.5%(+1.44)#76 | 7.6%(-0.733)#7,396 |
| 77. | Lavina | 6.7% | 5.5%(+1.19)#77 | 7.6%(-0.981)#7,759 |
| 78. | Maverick Mountain | 6.7% | 5.5%(+1.19)#78 | 7.6%(-0.981)#7,761 |
| 79. | Big Sandy | 6.6% | 5.5%(+1.08)#79 | 7.6%(-1.09)#7,902 |
| 80. | South Hills | 6.5% | 5.5%(+1.07)#80 | 7.6%(-1.10)#7,926 |
| 81. | Churchill | 6.3% | 5.5%(+0.850)#81 | 7.6%(-1.32)#8,258 |
| 82. | Choteau | 6.1% | 5.5%(+0.630)#82 | 7.6%(-1.54)#8,653 |
| 83. | Lockwood | 6.1% | 5.5%(+0.607)#83 | 7.6%(-1.56)#8,692 |
| 84. | Harlowton | 6.1% | 5.5%(+0.582)#84 | 7.6%(-1.59)#8,740 |
| 85. | Joplin | 6.1% | 5.5%(+0.582)#85 | 7.6%(-1.59)#8,754 |
| 86. | Cascade | 5.7% | 5.5%(+0.203)#86 | 7.6%(-1.97)#9,360 |
| 87. | Bigfork | 5.6% | 5.5%(+0.155)#87 | 7.6%(-2.01)#9,443 |
| 88. | Billings | 5.6% | 5.5%(+0.121)#88 | 7.6%(-2.05)#9,494 |
| 89. | Fishtail | 5.6% | 5.5%(+0.077)#89 | 7.6%(-2.09)#9,584 |
| 90. | Stevensville | 5.3% | 5.5%(-0.149)#90 | 7.6%(-2.32)#9,963 |
| 91. | Rockvale | 5.3% | 5.5%(-0.216)#91 | 7.6%(-2.38)#10,088 |
| 92. | Helena | 5.2% | 5.5%(-0.230)#92 | 7.6%(-2.40)#10,110 |
| 93. | Dutton | 5.1% | 5.5%(-0.351)#93 | 7.6%(-2.52)#10,310 |
| 94. | Essex | 5.1% | 5.5%(-0.351)#94 | 7.6%(-2.52)#10,314 |
| 95. | Walkerville | 5.0% | 5.5%(-0.520)#95 | 7.6%(-2.69)#10,616 |
| 96. | Polson | 4.9% | 5.5%(-0.529)#96 | 7.6%(-2.70)#10,631 |
| 97. | Hot Springs | 4.9% | 5.5%(-0.601)#97 | 7.6%(-2.77)#10,763 |
| 98. | Denton | 4.9% | 5.5%(-0.601)#98 | 7.6%(-2.77)#10,768 |
| 99. | Kalispell | 4.8% | 5.5%(-0.630)#99 | 7.6%(-2.80)#10,813 |
| 100. | East Missoula | 4.8% | 5.5%(-0.637)#100 | 7.6%(-2.81)#10,828 |
Common Questions
What are the Top 10 Cities with the Highest Percentage of Population with a Degree in Engineering in Montana?
Top 10 Cities with the Highest Percentage of Population with a Degree in Engineering in Montana are:
#1
63.0%
#2
60.0%
#3
50.0%
#4
40.0%
#5
36.4%
#6
35.5%
#7
25.0%
#8
24.1%
#9
23.0%
#10
22.6%
What city has the Highest Percentage of Population with a Degree in Engineering in Montana?
Piltzville has the Highest Percentage of Population with a Degree in Engineering in Montana with 63.0%.
What is the Percentage of Population with a Degree in Engineering in the State of Montana?
Percentage of Population with a Degree in Engineering in Montana is 5.5%.
What is the Percentage of Population with a Degree in Engineering in the United States?
Percentage of Population with a Degree in Engineering in the United States is 7.6%.