Cities with the Highest Percentage of Population with a Degree in Engineering in Oklahoma
RELATED REPORTS & OPTIONS
Engineering
Oklahoma
Compare Cities
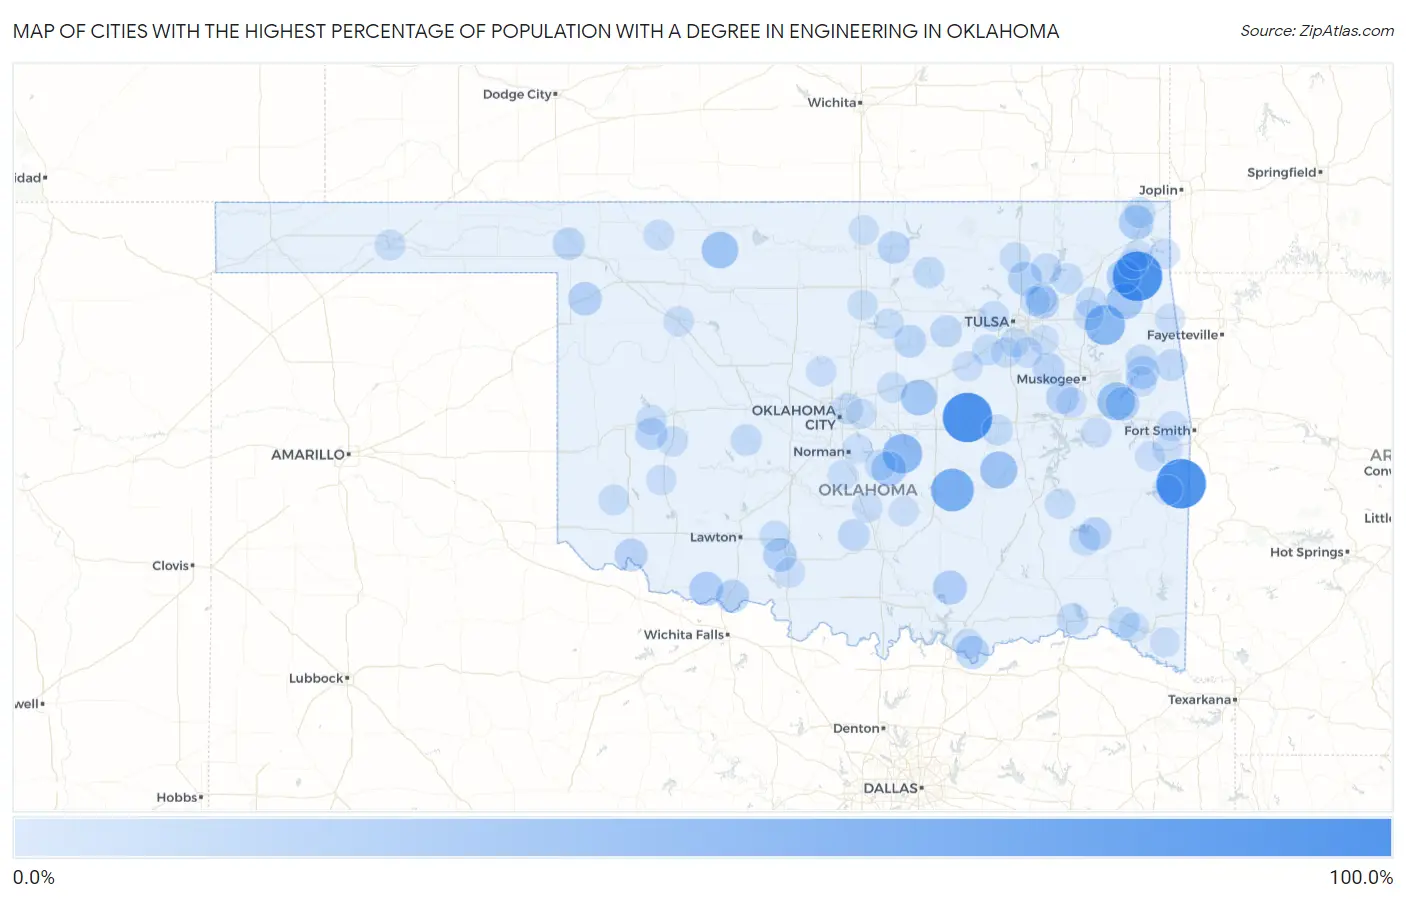
Map of Cities with the Highest Percentage of Population with a Degree in Engineering in Oklahoma
0.0%
100.0%
Cities with the Highest Percentage of Population with a Degree in Engineering in Oklahoma
| City | % Graduates | vs State | vs National | |
| 1. | Castle | 100.0% | 5.4%(+94.6)#1 | 7.6%(+92.4)#26 |
| 2. | Monroe | 100.0% | 5.4%(+94.6)#2 | 7.6%(+92.4)#30 |
| 3. | Drowning Creek | 100.0% | 5.4%(+94.6)#3 | 7.6%(+92.4)#31 |
| 4. | Canadian Shores | 66.7% | 5.4%(+61.2)#4 | 7.6%(+59.0)#89 |
| 5. | Sasakwa | 66.7% | 5.4%(+61.2)#5 | 7.6%(+59.0)#95 |
| 6. | Cedar Crest | 53.3% | 5.4%(+47.9)#6 | 7.6%(+45.7)#150 |
| 7. | Brooksville | 50.0% | 5.4%(+44.6)#7 | 7.6%(+42.4)#175 |
| 8. | Notchietown | 41.9% | 5.4%(+36.5)#8 | 7.6%(+34.3)#245 |
| 9. | Lamar | 40.0% | 5.4%(+34.6)#9 | 7.6%(+32.4)#267 |
| 10. | Dacoma | 37.5% | 5.4%(+32.1)#10 | 7.6%(+29.9)#300 |
| 11. | Kenwood | 34.5% | 5.4%(+29.0)#11 | 7.6%(+26.8)#341 |
| 12. | Sparks | 33.3% | 5.4%(+27.9)#12 | 7.6%(+25.7)#368 |
| 13. | Hochatown | 29.5% | 5.4%(+24.1)#13 | 7.6%(+21.9)#458 |
| 14. | Briartown | 29.2% | 5.4%(+23.7)#14 | 7.6%(+21.5)#471 |
| 15. | Tribbey | 28.6% | 5.4%(+23.1)#15 | 7.6%(+20.9)#485 |
| 16. | Dotyville | 27.6% | 5.4%(+22.1)#16 | 7.6%(+19.9)#537 |
| 17. | Grandfield | 25.0% | 5.4%(+19.6)#17 | 7.6%(+17.4)#642 |
| 18. | Milburn | 25.0% | 5.4%(+19.6)#18 | 7.6%(+17.4)#653 |
| 19. | Disney | 25.0% | 5.4%(+19.6)#19 | 7.6%(+17.4)#661 |
| 20. | Vera | 24.7% | 5.4%(+19.3)#20 | 7.6%(+17.1)#687 |
| 21. | Redbird Smith | 24.1% | 5.4%(+18.7)#21 | 7.6%(+16.5)#708 |
| 22. | Rocky Point | 24.0% | 5.4%(+18.6)#22 | 7.6%(+16.4)#719 |
| 23. | Gage | 22.6% | 5.4%(+17.1)#23 | 7.6%(+14.9)#798 |
| 24. | Empire City | 22.5% | 5.4%(+17.1)#24 | 7.6%(+14.9)#806 |
| 25. | Kemp | 22.2% | 5.4%(+16.8)#25 | 7.6%(+14.6)#837 |
| 26. | Randlett | 21.4% | 5.4%(+16.0)#26 | 7.6%(+13.8)#891 |
| 27. | Tenkiller | 21.1% | 5.4%(+15.6)#27 | 7.6%(+13.4)#937 |
| 28. | Wainwright | 20.0% | 5.4%(+14.6)#28 | 7.6%(+12.4)#1,061 |
| 29. | Elmer | 20.0% | 5.4%(+14.6)#29 | 7.6%(+12.4)#1,071 |
| 30. | Valley Park | 20.0% | 5.4%(+14.6)#30 | 7.6%(+12.4)#1,074 |
| 31. | Tuskahoma | 19.0% | 5.4%(+13.6)#31 | 7.6%(+11.4)#1,159 |
| 32. | Ripley | 18.2% | 5.4%(+12.7)#32 | 7.6%(+10.5)#1,262 |
| 33. | Mccord | 17.5% | 5.4%(+12.0)#33 | 7.6%(+9.81)#1,361 |
| 34. | Laverne | 17.4% | 5.4%(+12.0)#34 | 7.6%(+9.78)#1,365 |
| 35. | Ingalls | 17.1% | 5.4%(+11.7)#35 | 7.6%(+9.50)#1,420 |
| 36. | Haskell | 16.2% | 5.4%(+10.8)#36 | 7.6%(+8.55)#1,621 |
| 37. | Burns Flat | 16.1% | 5.4%(+10.7)#37 | 7.6%(+8.46)#1,631 |
| 38. | Elmore City | 15.6% | 5.4%(+10.1)#38 | 7.6%(+7.91)#1,753 |
| 39. | Fairfield | 14.7% | 5.4%(+9.27)#39 | 7.6%(+7.06)#1,932 |
| 40. | Oilton | 14.5% | 5.4%(+9.10)#40 | 7.6%(+6.90)#1,969 |
| 41. | Hugo | 14.1% | 5.4%(+8.64)#41 | 7.6%(+6.43)#2,119 |
| 42. | Binger | 13.5% | 5.4%(+8.02)#42 | 7.6%(+5.81)#2,323 |
| 43. | Ralston | 13.3% | 5.4%(+7.89)#43 | 7.6%(+5.69)#2,369 |
| 44. | Millerton | 13.3% | 5.4%(+7.89)#44 | 7.6%(+5.69)#2,374 |
| 45. | Lowrey | 13.0% | 5.4%(+7.60)#45 | 7.6%(+5.40)#2,478 |
| 46. | Welling | 12.5% | 5.4%(+7.06)#46 | 7.6%(+4.85)#2,669 |
| 47. | Clayton | 12.5% | 5.4%(+7.06)#47 | 7.6%(+4.85)#2,672 |
| 48. | North Miami | 12.5% | 5.4%(+7.06)#48 | 7.6%(+4.85)#2,685 |
| 49. | Weleetka | 12.0% | 5.4%(+6.56)#49 | 7.6%(+4.35)#2,886 |
| 50. | Lake Aluma | 11.9% | 5.4%(+6.46)#50 | 7.6%(+4.26)#2,934 |
| 51. | Pryor Creek | 11.9% | 5.4%(+6.46)#51 | 7.6%(+4.25)#2,938 |
| 52. | Central High | 11.8% | 5.4%(+6.35)#52 | 7.6%(+4.14)#2,989 |
| 53. | Bushyhead | 11.5% | 5.4%(+6.10)#53 | 7.6%(+3.89)#3,101 |
| 54. | Limestone | 11.5% | 5.4%(+6.05)#54 | 7.6%(+3.84)#3,128 |
| 55. | Kellyville | 11.1% | 5.4%(+5.67)#55 | 7.6%(+3.46)#3,323 |
| 56. | Etowah | 11.1% | 5.4%(+5.67)#56 | 7.6%(+3.46)#3,343 |
| 57. | Guymon | 10.7% | 5.4%(+5.26)#57 | 7.6%(+3.06)#3,586 |
| 58. | Mangum | 10.4% | 5.4%(+4.98)#58 | 7.6%(+2.77)#3,773 |
| 59. | Freedom | 10.3% | 5.4%(+4.90)#59 | 7.6%(+2.70)#3,837 |
| 60. | Wellston | 10.0% | 5.4%(+4.56)#60 | 7.6%(+2.35)#4,068 |
| 61. | Cedar Lake | 10.0% | 5.4%(+4.56)#61 | 7.6%(+2.35)#4,082 |
| 62. | Talala | 10.0% | 5.4%(+4.56)#62 | 7.6%(+2.35)#4,086 |
| 63. | Haileyville | 9.8% | 5.4%(+4.36)#63 | 7.6%(+2.16)#4,249 |
| 64. | Ochelata | 9.7% | 5.4%(+4.24)#64 | 7.6%(+2.03)#4,327 |
| 65. | Dry Creek | 9.7% | 5.4%(+4.24)#65 | 7.6%(+2.03)#4,333 |
| 66. | Kiefer | 9.6% | 5.4%(+4.19)#66 | 7.6%(+1.99)#4,359 |
| 67. | Sand Springs | 9.6% | 5.4%(+4.16)#67 | 7.6%(+1.95)#4,391 |
| 68. | New Cordell | 9.5% | 5.4%(+4.08)#68 | 7.6%(+1.88)#4,439 |
| 69. | Foss | 9.5% | 5.4%(+4.08)#69 | 7.6%(+1.88)#4,457 |
| 70. | Chouteau | 9.5% | 5.4%(+4.05)#70 | 7.6%(+1.84)#4,485 |
| 71. | Seiling | 9.3% | 5.4%(+3.86)#71 | 7.6%(+1.65)#4,634 |
| 72. | Hobart | 9.1% | 5.4%(+3.62)#72 | 7.6%(+1.41)#4,850 |
| 73. | Cashion | 9.0% | 5.4%(+3.53)#73 | 7.6%(+1.32)#4,954 |
| 74. | Muldrow | 8.7% | 5.4%(+3.27)#74 | 7.6%(+1.06)#5,191 |
| 75. | Porum | 8.7% | 5.4%(+3.26)#75 | 7.6%(+1.05)#5,205 |
| 76. | Oktaha | 8.7% | 5.4%(+3.26)#76 | 7.6%(+1.05)#5,218 |
| 77. | Cayuga | 8.7% | 5.4%(+3.26)#77 | 7.6%(+1.05)#5,224 |
| 78. | Bristow | 8.6% | 5.4%(+3.20)#78 | 7.6%(+0.994)#5,258 |
| 79. | Bixby | 8.6% | 5.4%(+3.17)#79 | 7.6%(+0.965)#5,293 |
| 80. | Spiro | 8.6% | 5.4%(+3.16)#80 | 7.6%(+0.955)#5,301 |
| 81. | Cleora | 8.6% | 5.4%(+3.13)#81 | 7.6%(+0.924)#5,327 |
| 82. | Perry | 8.5% | 5.4%(+3.10)#82 | 7.6%(+0.893)#5,358 |
| 83. | Washington | 8.5% | 5.4%(+3.10)#83 | 7.6%(+0.889)#5,363 |
| 84. | Achille | 8.3% | 5.4%(+2.89)#84 | 7.6%(+0.686)#5,572 |
| 85. | Stillwater | 8.2% | 5.4%(+2.78)#85 | 7.6%(+0.570)#5,711 |
| 86. | Paoli | 8.2% | 5.4%(+2.76)#86 | 7.6%(+0.549)#5,738 |
| 87. | Comanche | 8.0% | 5.4%(+2.60)#87 | 7.6%(+0.388)#5,922 |
| 88. | Bokoshe | 8.0% | 5.4%(+2.56)#88 | 7.6%(+0.352)#5,975 |
| 89. | West Siloam Springs | 8.0% | 5.4%(+2.52)#89 | 7.6%(+0.317)#6,006 |
| 90. | Howe | 7.7% | 5.4%(+2.25)#90 | 7.6%(+0.045)#6,347 |
| 91. | Garvin | 7.7% | 5.4%(+2.25)#91 | 7.6%(+0.045)#6,375 |
| 92. | Owasso | 7.7% | 5.4%(+2.25)#92 | 7.6%(+0.039)#6,380 |
| 93. | Nicoma Park | 7.6% | 5.4%(+2.15)#93 | 7.6%(-0.053)#6,482 |
| 94. | Norman | 7.5% | 5.4%(+2.06)#94 | 7.6%(-0.145)#6,586 |
| 95. | Stratford | 7.4% | 5.4%(+2.01)#95 | 7.6%(-0.201)#6,656 |
| 96. | Jenks | 7.4% | 5.4%(+1.93)#96 | 7.6%(-0.276)#6,760 |
| 97. | Blackwell | 7.3% | 5.4%(+1.90)#97 | 7.6%(-0.310)#6,803 |
| 98. | Bernice | 7.3% | 5.4%(+1.88)#98 | 7.6%(-0.330)#6,835 |
| 99. | Haworth | 7.1% | 5.4%(+1.70)#99 | 7.6%(-0.505)#7,083 |
| 100. | Broken Arrow | 7.1% | 5.4%(+1.69)#100 | 7.6%(-0.512)#7,100 |
Common Questions
What are the Top 10 Cities with the Highest Percentage of Population with a Degree in Engineering in Oklahoma?
Top 10 Cities with the Highest Percentage of Population with a Degree in Engineering in Oklahoma are:
#1
100.0%
#2
100.0%
#3
100.0%
#4
66.7%
#5
53.3%
#6
50.0%
#7
41.9%
#8
40.0%
#9
37.5%
#10
34.5%
What city has the Highest Percentage of Population with a Degree in Engineering in Oklahoma?
Castle has the Highest Percentage of Population with a Degree in Engineering in Oklahoma with 100.0%.
What is the Percentage of Population with a Degree in Engineering in the State of Oklahoma?
Percentage of Population with a Degree in Engineering in Oklahoma is 5.4%.
What is the Percentage of Population with a Degree in Engineering in the United States?
Percentage of Population with a Degree in Engineering in the United States is 7.6%.