Cities with the Highest Percentage of Population with a Degree in Engineering in Oregon
RELATED REPORTS & OPTIONS
Engineering
Oregon
Compare Cities
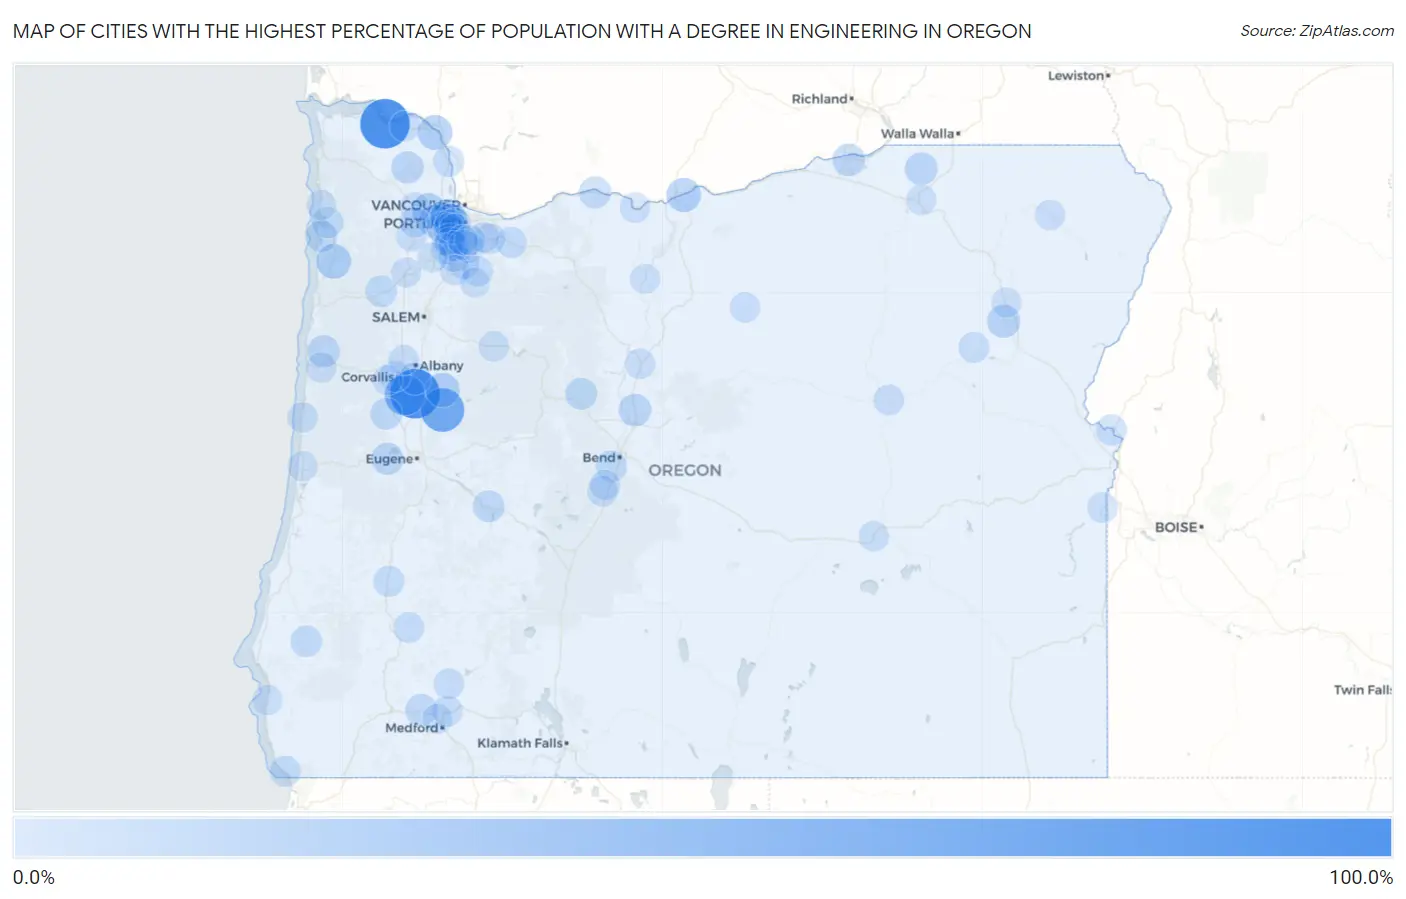
Map of Cities with the Highest Percentage of Population with a Degree in Engineering in Oregon
0.0%
100.0%
Cities with the Highest Percentage of Population with a Degree in Engineering in Oregon
| City | % Graduates | vs State | vs National | |
| 1. | Westport | 100.0% | 7.0%(+93.0)#1 | 7.6%(+92.4)#10 |
| 2. | Shedd | 100.0% | 7.0%(+93.0)#2 | 7.6%(+92.4)#25 |
| 3. | Crawfordsville | 70.7% | 7.0%(+63.7)#3 | 7.6%(+63.1)#81 |
| 4. | Peoria | 56.2% | 7.0%(+49.2)#4 | 7.6%(+48.6)#135 |
| 5. | Barnesdale | 43.5% | 7.0%(+36.5)#5 | 7.6%(+35.8)#225 |
| 6. | Meacham | 42.3% | 7.0%(+35.3)#6 | 7.6%(+34.7)#240 |
| 7. | Neotsu | 27.3% | 7.0%(+20.3)#7 | 7.6%(+19.7)#542 |
| 8. | Beaver | 27.3% | 7.0%(+20.2)#8 | 7.6%(+19.6)#549 |
| 9. | Rainier | 27.2% | 7.0%(+20.2)#9 | 7.6%(+19.6)#554 |
| 10. | Bethany | 26.1% | 7.0%(+19.1)#10 | 7.6%(+18.5)#591 |
| 11. | Sodaville | 25.8% | 7.0%(+18.8)#11 | 7.6%(+18.2)#606 |
| 12. | Rufus | 25.0% | 7.0%(+18.0)#12 | 7.6%(+17.4)#657 |
| 13. | Elmira | 23.1% | 7.0%(+16.1)#13 | 7.6%(+15.4)#773 |
| 14. | North Plains | 22.8% | 7.0%(+15.8)#14 | 7.6%(+15.1)#788 |
| 15. | Hillsboro | 21.0% | 7.0%(+13.9)#15 | 7.6%(+13.3)#951 |
| 16. | Haines | 20.0% | 7.0%(+13.0)#16 | 7.6%(+12.4)#1,050 |
| 17. | Juniper Canyon | 19.3% | 7.0%(+12.2)#17 | 7.6%(+11.6)#1,133 |
| 18. | Oak Hills | 18.9% | 7.0%(+11.9)#18 | 7.6%(+11.3)#1,170 |
| 19. | Terrebonne | 17.6% | 7.0%(+10.5)#19 | 7.6%(+9.91)#1,343 |
| 20. | Umatilla | 17.6% | 7.0%(+10.5)#20 | 7.6%(+9.91)#1,344 |
| 21. | Helix | 17.5% | 7.0%(+10.5)#21 | 7.6%(+9.85)#1,356 |
| 22. | Keno | 16.6% | 7.0%(+9.58)#22 | 7.6%(+8.96)#1,544 |
| 23. | Siletz | 16.3% | 7.0%(+9.24)#23 | 7.6%(+8.61)#1,608 |
| 24. | Cedar Mill | 16.3% | 7.0%(+9.24)#24 | 7.6%(+8.61)#1,609 |
| 25. | Vernonia | 16.1% | 7.0%(+9.05)#25 | 7.6%(+8.42)#1,641 |
| 26. | Veneta | 15.5% | 7.0%(+8.48)#26 | 7.6%(+7.86)#1,771 |
| 27. | Tangent | 15.0% | 7.0%(+8.02)#27 | 7.6%(+7.40)#1,862 |
| 28. | Hood River | 15.0% | 7.0%(+7.98)#28 | 7.6%(+7.36)#1,869 |
| 29. | Knappa | 14.4% | 7.0%(+7.42)#29 | 7.6%(+6.80)#1,986 |
| 30. | Netarts | 14.3% | 7.0%(+7.26)#30 | 7.6%(+6.64)#2,031 |
| 31. | Gold Hill | 14.1% | 7.0%(+7.11)#31 | 7.6%(+6.48)#2,107 |
| 32. | Oakridge | 14.0% | 7.0%(+6.95)#32 | 7.6%(+6.32)#2,156 |
| 33. | Camp Sherman | 13.8% | 7.0%(+6.73)#33 | 7.6%(+6.10)#2,232 |
| 34. | Aloha | 13.6% | 7.0%(+6.60)#34 | 7.6%(+5.97)#2,267 |
| 35. | Alpine | 13.5% | 7.0%(+6.49)#35 | 7.6%(+5.87)#2,301 |
| 36. | Rockcreek | 13.4% | 7.0%(+6.40)#36 | 7.6%(+5.77)#2,331 |
| 37. | Sheridan | 13.4% | 7.0%(+6.39)#37 | 7.6%(+5.76)#2,335 |
| 38. | Powers | 12.9% | 7.0%(+5.88)#38 | 7.6%(+5.26)#2,530 |
| 39. | Durham | 12.3% | 7.0%(+5.31)#39 | 7.6%(+4.69)#2,761 |
| 40. | Bay City | 12.3% | 7.0%(+5.28)#40 | 7.6%(+4.65)#2,777 |
| 41. | West Haven Sylvan | 12.2% | 7.0%(+5.17)#41 | 7.6%(+4.55)#2,810 |
| 42. | Seventh Mountain | 12.1% | 7.0%(+5.05)#42 | 7.6%(+4.43)#2,860 |
| 43. | Bull Mountain | 11.4% | 7.0%(+4.34)#43 | 7.6%(+3.72)#3,184 |
| 44. | Harbor | 11.2% | 7.0%(+4.20)#44 | 7.6%(+3.57)#3,263 |
| 45. | Sandy | 11.0% | 7.0%(+3.98)#45 | 7.6%(+3.36)#3,398 |
| 46. | Roseburg North | 11.0% | 7.0%(+3.97)#46 | 7.6%(+3.34)#3,405 |
| 47. | Columbia City | 10.8% | 7.0%(+3.78)#47 | 7.6%(+3.15)#3,519 |
| 48. | Corvallis | 10.7% | 7.0%(+3.71)#48 | 7.6%(+3.08)#3,564 |
| 49. | Annex | 10.5% | 7.0%(+3.50)#49 | 7.6%(+2.88)#3,704 |
| 50. | Beaverton | 10.4% | 7.0%(+3.42)#50 | 7.6%(+2.80)#3,758 |
| 51. | Tigard | 10.4% | 7.0%(+3.33)#51 | 7.6%(+2.70)#3,825 |
| 52. | Days Creek | 10.0% | 7.0%(+2.98)#52 | 7.6%(+2.35)#4,096 |
| 53. | Cedar Hills | 9.8% | 7.0%(+2.82)#53 | 7.6%(+2.19)#4,221 |
| 54. | Damascus | 9.6% | 7.0%(+2.59)#54 | 7.6%(+1.96)#4,379 |
| 55. | Three Rivers | 9.5% | 7.0%(+2.47)#55 | 7.6%(+1.84)#4,489 |
| 56. | Sherwood | 9.5% | 7.0%(+2.46)#56 | 7.6%(+1.84)#4,491 |
| 57. | Canby | 9.5% | 7.0%(+2.44)#57 | 7.6%(+1.82)#4,499 |
| 58. | Marlene | 9.1% | 7.0%(+2.11)#58 | 7.6%(+1.48)#4,766 |
| 59. | Wilsonville | 9.1% | 7.0%(+2.07)#59 | 7.6%(+1.45)#4,786 |
| 60. | White City | 9.1% | 7.0%(+2.03)#60 | 7.6%(+1.41)#4,851 |
| 61. | Shady Cove | 9.0% | 7.0%(+2.00)#61 | 7.6%(+1.37)#4,892 |
| 62. | West Linn | 8.9% | 7.0%(+1.92)#62 | 7.6%(+1.30)#4,986 |
| 63. | John Day | 8.9% | 7.0%(+1.88)#63 | 7.6%(+1.26)#5,021 |
| 64. | Sumpter | 8.8% | 7.0%(+1.80)#64 | 7.6%(+1.18)#5,097 |
| 65. | Clatskanie | 8.7% | 7.0%(+1.72)#65 | 7.6%(+1.09)#5,167 |
| 66. | The Dalles | 8.7% | 7.0%(+1.70)#66 | 7.6%(+1.07)#5,183 |
| 67. | Adrian | 8.7% | 7.0%(+1.67)#67 | 7.6%(+1.05)#5,220 |
| 68. | Adair Village | 8.6% | 7.0%(+1.61)#68 | 7.6%(+0.989)#5,271 |
| 69. | Yachats | 8.5% | 7.0%(+1.51)#69 | 7.6%(+0.883)#5,369 |
| 70. | Gates | 8.4% | 7.0%(+1.41)#70 | 7.6%(+0.786)#5,460 |
| 71. | King City | 8.3% | 7.0%(+1.29)#71 | 7.6%(+0.665)#5,605 |
| 72. | Madras | 8.2% | 7.0%(+1.18)#72 | 7.6%(+0.556)#5,727 |
| 73. | Gaston | 8.1% | 7.0%(+1.04)#73 | 7.6%(+0.417)#5,883 |
| 74. | Raleigh Hills | 8.0% | 7.0%(+0.999)#74 | 7.6%(+0.374)#5,936 |
| 75. | Tualatin | 8.0% | 7.0%(+0.968)#75 | 7.6%(+0.343)#5,986 |
| 76. | Fossil | 7.9% | 7.0%(+0.898)#76 | 7.6%(+0.273)#6,068 |
| 77. | Sunriver | 7.9% | 7.0%(+0.889)#77 | 7.6%(+0.265)#6,072 |
| 78. | Toledo | 7.9% | 7.0%(+0.882)#78 | 7.6%(+0.257)#6,084 |
| 79. | Mulino | 7.9% | 7.0%(+0.862)#79 | 7.6%(+0.237)#6,117 |
| 80. | Green Meadows | 7.9% | 7.0%(+0.854)#80 | 7.6%(+0.229)#6,122 |
| 81. | Banks | 7.8% | 7.0%(+0.824)#81 | 7.6%(+0.200)#6,147 |
| 82. | Forest Grove | 7.8% | 7.0%(+0.791)#82 | 7.6%(+0.166)#6,193 |
| 83. | Stafford | 7.8% | 7.0%(+0.765)#83 | 7.6%(+0.140)#6,222 |
| 84. | Hines | 7.6% | 7.0%(+0.616)#84 | 7.6%(-0.009)#6,429 |
| 85. | Mcminnville | 7.5% | 7.0%(+0.459)#85 | 7.6%(-0.166)#6,618 |
| 86. | Happy Valley | 7.5% | 7.0%(+0.432)#86 | 7.6%(-0.193)#6,650 |
| 87. | Wallowa | 7.4% | 7.0%(+0.424)#87 | 7.6%(-0.201)#6,657 |
| 88. | Aurora | 7.3% | 7.0%(+0.254)#88 | 7.6%(-0.371)#6,889 |
| 89. | Philomath | 7.1% | 7.0%(+0.050)#89 | 7.6%(-0.575)#7,177 |
| 90. | Lake Oswego | 7.0% | 7.0%(-0.008)#90 | 7.6%(-0.632)#7,250 |
| 91. | Nesika Beach | 7.0% | 7.0%(-0.023)#91 | 7.6%(-0.648)#7,272 |
| 92. | Mission | 6.9% | 7.0%(-0.078)#92 | 7.6%(-0.703)#7,355 |
| 93. | Rockaway Beach | 6.9% | 7.0%(-0.156)#93 | 7.6%(-0.781)#7,460 |
| 94. | Central Point | 6.9% | 7.0%(-0.162)#94 | 7.6%(-0.787)#7,464 |
| 95. | Newberg | 6.6% | 7.0%(-0.403)#95 | 7.6%(-1.03)#7,821 |
| 96. | North Powder | 6.6% | 7.0%(-0.465)#96 | 7.6%(-1.09)#7,903 |
| 97. | Maupin | 6.6% | 7.0%(-0.465)#97 | 7.6%(-1.09)#7,905 |
| 98. | Oak Grove | 6.5% | 7.0%(-0.505)#98 | 7.6%(-1.13)#7,970 |
| 99. | Florence | 6.5% | 7.0%(-0.531)#99 | 7.6%(-1.16)#8,001 |
| 100. | Molalla | 6.5% | 7.0%(-0.550)#100 | 7.6%(-1.17)#8,028 |
Common Questions
What are the Top 10 Cities with the Highest Percentage of Population with a Degree in Engineering in Oregon?
Top 10 Cities with the Highest Percentage of Population with a Degree in Engineering in Oregon are:
#1
100.0%
#2
100.0%
#3
70.7%
#4
56.2%
#5
27.3%
#6
27.2%
#7
26.1%
#8
25.8%
#9
25.0%
#10
22.8%
What city has the Highest Percentage of Population with a Degree in Engineering in Oregon?
Westport has the Highest Percentage of Population with a Degree in Engineering in Oregon with 100.0%.
What is the Percentage of Population with a Degree in Engineering in the State of Oregon?
Percentage of Population with a Degree in Engineering in Oregon is 7.0%.
What is the Percentage of Population with a Degree in Engineering in the United States?
Percentage of Population with a Degree in Engineering in the United States is 7.6%.