Cities with the Highest Percentage of Population with a Degree in Engineering in Nebraska
RELATED REPORTS & OPTIONS
Engineering
Nebraska
Compare Cities
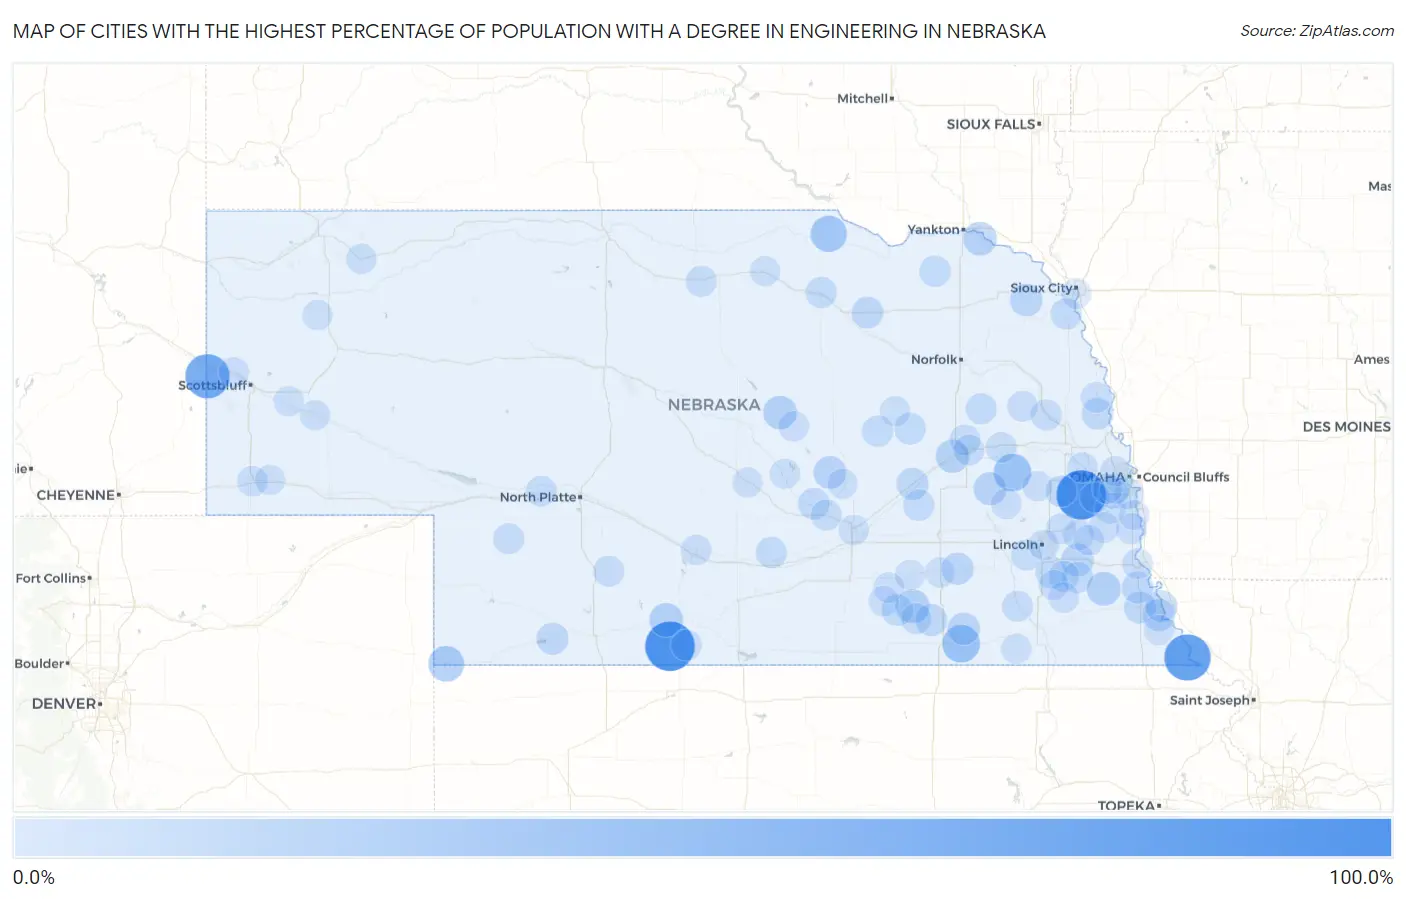
Map of Cities with the Highest Percentage of Population with a Degree in Engineering in Nebraska
0.0%
100.0%
Cities with the Highest Percentage of Population with a Degree in Engineering in Nebraska
| City | % Graduates | vs State | vs National | |
| 1. | Wann | 100.0% | 4.2%(+95.8)#1 | 7.6%(+92.4)#41 |
| 2. | Hendley | 100.0% | 4.2%(+95.8)#2 | 7.6%(+92.4)#55 |
| 3. | Rulo | 83.3% | 4.2%(+79.1)#3 | 7.6%(+75.7)#68 |
| 4. | Lyman | 72.7% | 4.2%(+68.5)#4 | 7.6%(+65.1)#77 |
| 5. | Bruno | 40.0% | 4.2%(+35.8)#5 | 7.6%(+32.4)#269 |
| 6. | Gilead | 40.0% | 4.2%(+35.8)#6 | 7.6%(+32.4)#276 |
| 7. | Bristow | 33.3% | 4.2%(+29.1)#7 | 7.6%(+25.7)#376 |
| 8. | Haigler | 30.0% | 4.2%(+25.8)#8 | 7.6%(+22.4)#446 |
| 9. | Holbrook | 21.7% | 4.2%(+17.5)#9 | 7.6%(+14.1)#869 |
| 10. | Cook | 21.7% | 4.2%(+17.5)#10 | 7.6%(+14.0)#876 |
| 11. | Ong | 21.4% | 4.2%(+17.2)#11 | 7.6%(+13.8)#904 |
| 12. | St Helena | 20.0% | 4.2%(+15.8)#12 | 7.6%(+12.4)#1,062 |
| 13. | Elyria | 20.0% | 4.2%(+15.8)#13 | 7.6%(+12.4)#1,070 |
| 14. | Duncan | 19.4% | 4.2%(+15.2)#14 | 7.6%(+11.7)#1,124 |
| 15. | Elba | 16.7% | 4.2%(+12.5)#15 | 7.6%(+9.02)#1,523 |
| 16. | Garrison | 16.7% | 4.2%(+12.5)#16 | 7.6%(+9.02)#1,537 |
| 17. | Palmyra | 15.8% | 4.2%(+11.6)#17 | 7.6%(+8.14)#1,700 |
| 18. | Allen | 15.8% | 4.2%(+11.6)#18 | 7.6%(+8.14)#1,702 |
| 19. | Alexandria | 14.3% | 4.2%(+10.1)#19 | 7.6%(+6.64)#2,061 |
| 20. | Nemaha | 14.3% | 4.2%(+10.1)#20 | 7.6%(+6.64)#2,062 |
| 21. | Exeter | 14.0% | 4.2%(+9.75)#21 | 7.6%(+6.31)#2,163 |
| 22. | Clarks | 13.0% | 4.2%(+8.84)#22 | 7.6%(+5.40)#2,477 |
| 23. | Auburn | 12.9% | 4.2%(+8.68)#23 | 7.6%(+5.23)#2,538 |
| 24. | Trenton | 12.5% | 4.2%(+8.30)#24 | 7.6%(+4.85)#2,678 |
| 25. | Carleton | 12.5% | 4.2%(+8.30)#25 | 7.6%(+4.85)#2,695 |
| 26. | Brownville | 12.5% | 4.2%(+8.30)#26 | 7.6%(+4.85)#2,702 |
| 27. | Julian | 11.8% | 4.2%(+7.56)#27 | 7.6%(+4.12)#3,008 |
| 28. | Orchard | 11.5% | 4.2%(+7.34)#28 | 7.6%(+3.89)#3,103 |
| 29. | St Edward | 11.3% | 4.2%(+7.12)#29 | 7.6%(+3.67)#3,214 |
| 30. | Edgar | 11.1% | 4.2%(+6.91)#30 | 7.6%(+3.46)#3,331 |
| 31. | Herman | 11.1% | 4.2%(+6.91)#31 | 7.6%(+3.46)#3,335 |
| 32. | Howard City Boelus | 10.3% | 4.2%(+6.15)#32 | 7.6%(+2.70)#3,836 |
| 33. | Hickman | 10.1% | 4.2%(+5.89)#33 | 7.6%(+2.44)#4,013 |
| 34. | Ithaca | 10.0% | 4.2%(+5.80)#34 | 7.6%(+2.35)#4,098 |
| 35. | Cedar Rapids | 9.9% | 4.2%(+5.68)#35 | 7.6%(+2.23)#4,189 |
| 36. | Polk | 9.7% | 4.2%(+5.48)#36 | 7.6%(+2.03)#4,330 |
| 37. | Bloomfield | 9.5% | 4.2%(+5.28)#37 | 7.6%(+1.84)#4,494 |
| 38. | O Neill | 9.3% | 4.2%(+5.09)#38 | 7.6%(+1.64)#4,647 |
| 39. | Glenwood | 9.0% | 4.2%(+4.83)#39 | 7.6%(+1.39)#4,875 |
| 40. | Homer | 8.6% | 4.2%(+4.37)#40 | 7.6%(+0.924)#5,334 |
| 41. | Leigh | 8.3% | 4.2%(+4.13)#41 | 7.6%(+0.686)#5,571 |
| 42. | Douglas | 8.3% | 4.2%(+4.13)#42 | 7.6%(+0.686)#5,579 |
| 43. | Scribner | 8.1% | 4.2%(+3.86)#43 | 7.6%(+0.417)#5,882 |
| 44. | Curtis | 7.9% | 4.2%(+3.70)#44 | 7.6%(+0.247)#6,101 |
| 45. | Long Pine | 7.9% | 4.2%(+3.70)#45 | 7.6%(+0.247)#6,107 |
| 46. | Panama | 7.7% | 4.2%(+3.49)#46 | 7.6%(+0.045)#6,367 |
| 47. | Beaver City | 7.5% | 4.2%(+3.35)#47 | 7.6%(-0.100)#6,539 |
| 48. | Cairo | 7.5% | 4.2%(+3.32)#48 | 7.6%(-0.129)#6,561 |
| 49. | Davenport | 7.4% | 4.2%(+3.21)#49 | 7.6%(-0.240)#6,711 |
| 50. | Lakeview | 7.3% | 4.2%(+3.12)#50 | 7.6%(-0.330)#6,838 |
| 51. | De Witt | 7.2% | 4.2%(+3.03)#51 | 7.6%(-0.419)#6,951 |
| 52. | Schuyler | 7.2% | 4.2%(+3.02)#52 | 7.6%(-0.427)#6,963 |
| 53. | Denton | 7.1% | 4.2%(+2.94)#53 | 7.6%(-0.505)#7,092 |
| 54. | Columbus | 7.0% | 4.2%(+2.80)#54 | 7.6%(-0.649)#7,274 |
| 55. | Sutherland | 7.0% | 4.2%(+2.78)#55 | 7.6%(-0.671)#7,300 |
| 56. | Elsie | 6.9% | 4.2%(+2.70)#56 | 7.6%(-0.751)#7,430 |
| 57. | Tekamah | 6.6% | 4.2%(+2.44)#57 | 7.6%(-1.00)#7,789 |
| 58. | Dwight | 6.5% | 4.2%(+2.25)#58 | 7.6%(-1.20)#8,067 |
| 59. | Adams | 6.4% | 4.2%(+2.16)#59 | 7.6%(-1.28)#8,200 |
| 60. | Manley | 6.2% | 4.2%(+2.05)#60 | 7.6%(-1.40)#8,413 |
| 61. | Alvo | 6.2% | 4.2%(+2.05)#61 | 7.6%(-1.40)#8,418 |
| 62. | Nebraska City | 6.2% | 4.2%(+2.02)#62 | 7.6%(-1.42)#8,460 |
| 63. | Waverly | 6.2% | 4.2%(+2.00)#63 | 7.6%(-1.44)#8,485 |
| 64. | Dodge | 6.2% | 4.2%(+1.95)#64 | 7.6%(-1.49)#8,580 |
| 65. | Elmwood | 6.1% | 4.2%(+1.95)#65 | 7.6%(-1.50)#8,595 |
| 66. | Kimball | 6.1% | 4.2%(+1.86)#66 | 7.6%(-1.59)#8,737 |
| 67. | Mitchell | 5.7% | 4.2%(+1.47)#67 | 7.6%(-1.98)#9,383 |
| 68. | Lexington | 5.7% | 4.2%(+1.46)#68 | 7.6%(-1.99)#9,410 |
| 69. | Ord | 5.6% | 4.2%(+1.42)#69 | 7.6%(-2.03)#9,461 |
| 70. | Murray | 5.6% | 4.2%(+1.42)#70 | 7.6%(-2.03)#9,469 |
| 71. | Hay Springs | 5.4% | 4.2%(+1.24)#71 | 7.6%(-2.21)#9,770 |
| 72. | Cedar Creek | 5.4% | 4.2%(+1.21)#72 | 7.6%(-2.24)#9,830 |
| 73. | Valley | 5.3% | 4.2%(+1.13)#73 | 7.6%(-2.32)#9,966 |
| 74. | Papillion | 5.3% | 4.2%(+1.08)#74 | 7.6%(-2.37)#10,044 |
| 75. | Lincoln | 5.3% | 4.2%(+1.06)#75 | 7.6%(-2.39)#10,102 |
| 76. | Bellevue | 5.2% | 4.2%(+1.01)#76 | 7.6%(-2.44)#10,153 |
| 77. | Clay Center | 5.1% | 4.2%(+0.928)#77 | 7.6%(-2.52)#10,297 |
| 78. | Grand Island | 5.0% | 4.2%(+0.843)#78 | 7.6%(-2.60)#10,461 |
| 79. | Hemingford | 5.0% | 4.2%(+0.800)#79 | 7.6%(-2.65)#10,533 |
| 80. | Diller | 5.0% | 4.2%(+0.800)#80 | 7.6%(-2.65)#10,550 |
| 81. | Loup City | 5.0% | 4.2%(+0.765)#81 | 7.6%(-2.68)#10,606 |
| 82. | La Vista | 4.9% | 4.2%(+0.741)#82 | 7.6%(-2.71)#10,641 |
| 83. | Albion | 4.9% | 4.2%(+0.686)#83 | 7.6%(-2.76)#10,741 |
| 84. | Bayard | 4.8% | 4.2%(+0.613)#84 | 7.6%(-2.83)#10,886 |
| 85. | South Sioux City | 4.8% | 4.2%(+0.570)#85 | 7.6%(-2.88)#10,960 |
| 86. | Fairmont | 4.7% | 4.2%(+0.488)#86 | 7.6%(-2.96)#11,093 |
| 87. | Mason City | 4.7% | 4.2%(+0.451)#87 | 7.6%(-3.00)#11,166 |
| 88. | Sutton | 4.6% | 4.2%(+0.362)#88 | 7.6%(-3.09)#11,311 |
| 89. | Firth | 4.5% | 4.2%(+0.346)#89 | 7.6%(-3.10)#11,350 |
| 90. | Dix | 4.5% | 4.2%(+0.346)#90 | 7.6%(-3.10)#11,355 |
| 91. | Weston | 4.5% | 4.2%(+0.346)#91 | 7.6%(-3.10)#11,357 |
| 92. | Gretna | 4.5% | 4.2%(+0.296)#92 | 7.6%(-3.15)#11,432 |
| 93. | Fairfield | 4.4% | 4.2%(+0.245)#93 | 7.6%(-3.20)#11,529 |
| 94. | Shubert | 4.4% | 4.2%(+0.245)#94 | 7.6%(-3.20)#11,531 |
| 95. | St Paul | 4.4% | 4.2%(+0.232)#95 | 7.6%(-3.22)#11,549 |
| 96. | Stuart | 4.4% | 4.2%(+0.225)#96 | 7.6%(-3.22)#11,563 |
| 97. | Omaha | 4.3% | 4.2%(+0.132)#97 | 7.6%(-3.32)#11,731 |
| 98. | Chalco | 4.3% | 4.2%(+0.131)#98 | 7.6%(-3.32)#11,732 |
| 99. | Plattsmouth | 4.3% | 4.2%(+0.104)#99 | 7.6%(-3.34)#11,772 |
| 100. | Bridgeport | 4.3% | 4.2%(+0.101)#100 | 7.6%(-3.35)#11,777 |
Common Questions
What are the Top 10 Cities with the Highest Percentage of Population with a Degree in Engineering in Nebraska?
Top 10 Cities with the Highest Percentage of Population with a Degree in Engineering in Nebraska are:
What city has the Highest Percentage of Population with a Degree in Engineering in Nebraska?
Wann has the Highest Percentage of Population with a Degree in Engineering in Nebraska with 100.0%.
What is the Percentage of Population with a Degree in Engineering in the State of Nebraska?
Percentage of Population with a Degree in Engineering in Nebraska is 4.2%.
What is the Percentage of Population with a Degree in Engineering in the United States?
Percentage of Population with a Degree in Engineering in the United States is 7.6%.