Alum Rock, CA Map & Demographics
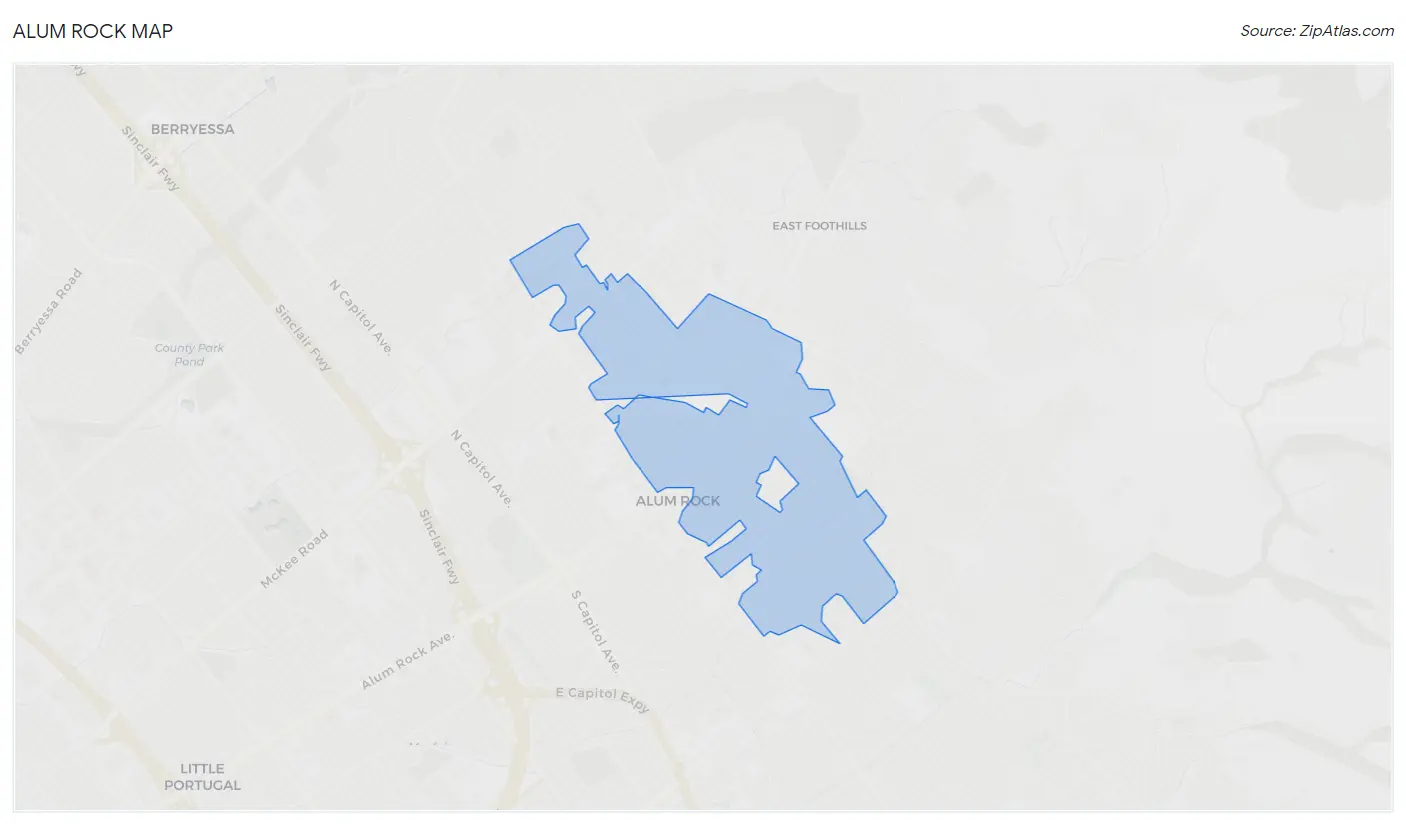
Alum Rock Map
Alum Rock Overview
$31,891
PER CAPITA INCOME
$109,107
AVG FAMILY INCOME
$108,929
AVG HOUSEHOLD INCOME
28.1%
WAGE / INCOME GAP [ % ]
71.9¢/ $1
WAGE / INCOME GAP [ $ ]
0.39
INEQUALITY / GINI INDEX
11,831
TOTAL POPULATION
5,900
MALE POPULATION
5,931
FEMALE POPULATION
99.48
MALES / 100 FEMALES
100.53
FEMALES / 100 MALES
38.0
MEDIAN AGE
4.2
AVG FAMILY SIZE
4.1
AVG HOUSEHOLD SIZE
6,178
LABOR FORCE [ PEOPLE ]
65.6%
PERCENT IN LABOR FORCE
5.3%
UNEMPLOYMENT RATE
Income in Alum Rock
Income Overview in Alum Rock
Per Capita Income in Alum Rock is $31,891, while median incomes of families and households are $109,107 and $108,929 respectively.
| Characteristic | Number | Measure |
| Per Capita Income | 11,831 | $31,891 |
| Median Family Income | 2,296 | $109,107 |
| Mean Family Income | 2,296 | $120,473 |
| Median Household Income | 2,774 | $108,929 |
| Mean Household Income | 2,774 | $127,272 |
| Income Deficit | 2,296 | $0 |
| Wage / Income Gap (%) | 11,831 | 28.10% |
| Wage / Income Gap ($) | 11,831 | 71.90¢ per $1 |
| Gini / Inequality Index | 11,831 | 0.39 |
Earnings by Sex in Alum Rock
Average Earnings in Alum Rock are $39,930, $46,115 for men and $33,157 for women, a difference of 28.1%.
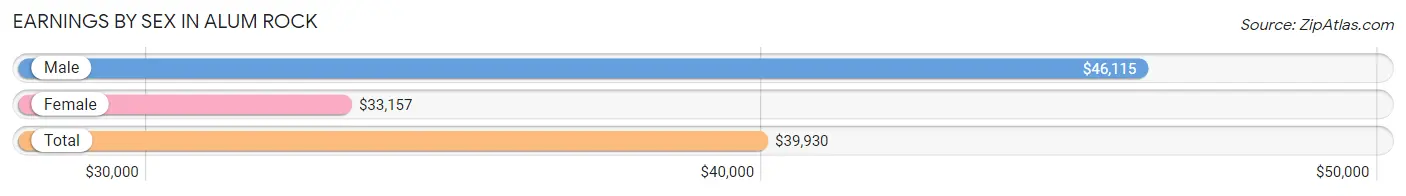
| Sex | Number | Average Earnings |
| Male | 3,596 (58.6%) | $46,115 |
| Female | 2,539 (41.4%) | $33,157 |
| Total | 6,135 (100.0%) | $39,930 |
Earnings by Sex by Income Bracket in Alum Rock
The most common earnings brackets in Alum Rock are $100,000+ for men (528 | 14.7%) and $35,000 to $39,999 for women (242 | 9.5%).
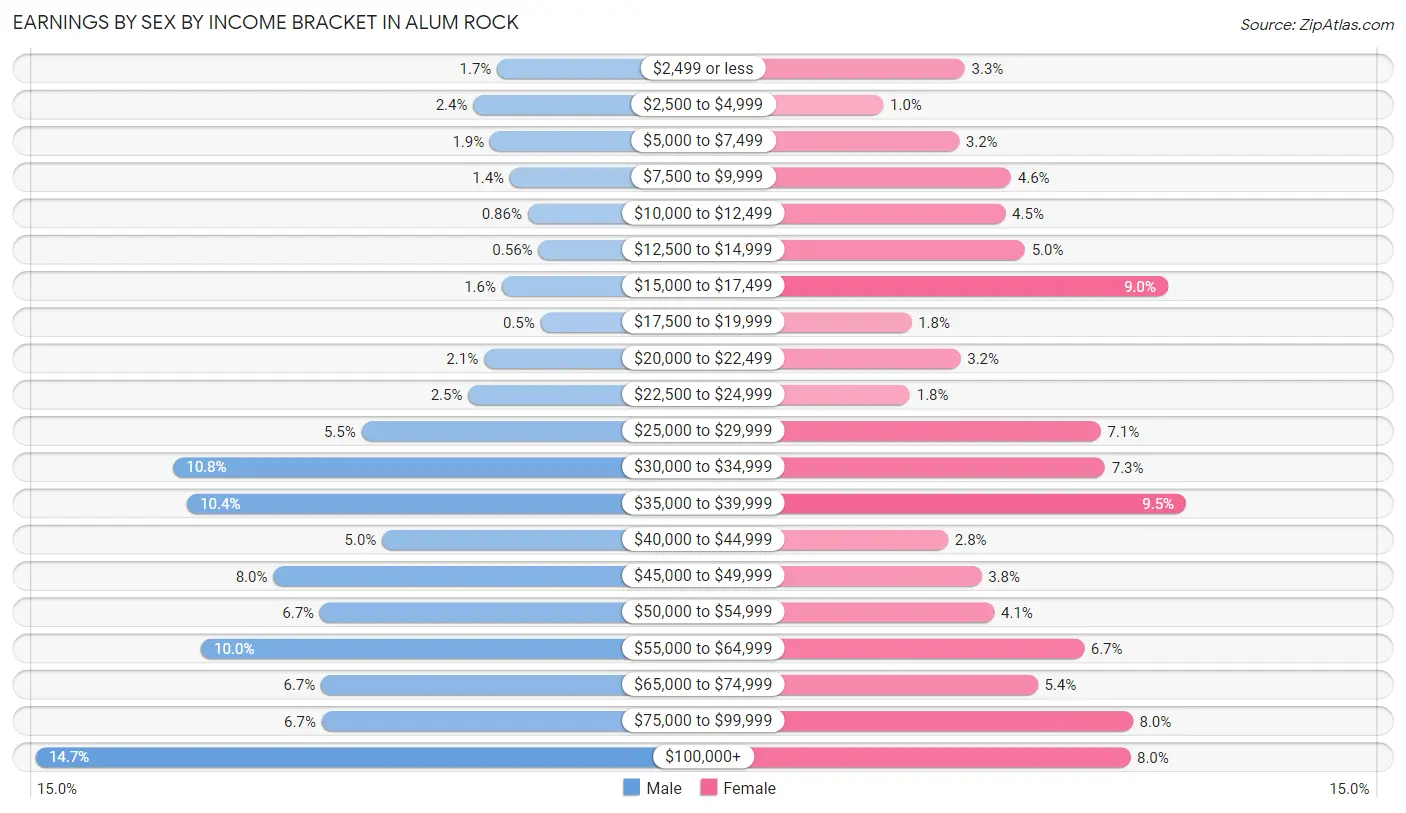
| Income | Male | Female |
| $2,499 or less | 62 (1.7%) | 84 (3.3%) |
| $2,500 to $4,999 | 86 (2.4%) | 26 (1.0%) |
| $5,000 to $7,499 | 69 (1.9%) | 80 (3.2%) |
| $7,500 to $9,999 | 49 (1.4%) | 117 (4.6%) |
| $10,000 to $12,499 | 31 (0.9%) | 113 (4.4%) |
| $12,500 to $14,999 | 20 (0.6%) | 127 (5.0%) |
| $15,000 to $17,499 | 57 (1.6%) | 229 (9.0%) |
| $17,500 to $19,999 | 18 (0.5%) | 46 (1.8%) |
| $20,000 to $22,499 | 75 (2.1%) | 81 (3.2%) |
| $22,500 to $24,999 | 91 (2.5%) | 45 (1.8%) |
| $25,000 to $29,999 | 199 (5.5%) | 181 (7.1%) |
| $30,000 to $34,999 | 389 (10.8%) | 184 (7.2%) |
| $35,000 to $39,999 | 375 (10.4%) | 242 (9.5%) |
| $40,000 to $44,999 | 178 (5.0%) | 72 (2.8%) |
| $45,000 to $49,999 | 288 (8.0%) | 96 (3.8%) |
| $50,000 to $54,999 | 241 (6.7%) | 105 (4.1%) |
| $55,000 to $64,999 | 361 (10.0%) | 169 (6.7%) |
| $65,000 to $74,999 | 240 (6.7%) | 136 (5.4%) |
| $75,000 to $99,999 | 239 (6.7%) | 204 (8.0%) |
| $100,000+ | 528 (14.7%) | 202 (8.0%) |
| Total | 3,596 (100.0%) | 2,539 (100.0%) |
Earnings by Sex by Educational Attainment in Alum Rock
Average earnings in Alum Rock are $50,013 for men and $39,319 for women, a difference of 21.4%. Men with an educational attainment of graduate degree enjoy the highest average annual earnings of $125,798, while those with less than high school education earn the least with $45,107. Women with an educational attainment of graduate degree earn the most with the average annual earnings of $100,556, while those with less than high school education have the smallest earnings of $31,538.
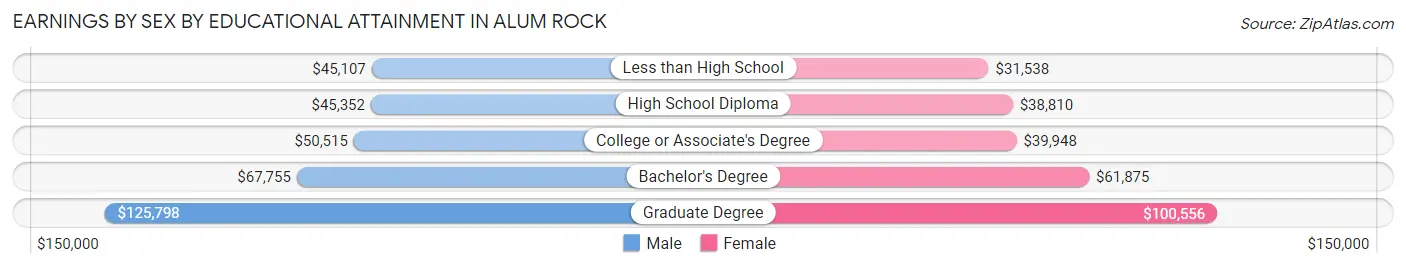
| Educational Attainment | Male Income | Female Income |
| Less than High School | $45,107 | $31,538 |
| High School Diploma | $45,352 | $38,810 |
| College or Associate's Degree | $50,515 | $39,948 |
| Bachelor's Degree | $67,755 | $61,875 |
| Graduate Degree | $125,798 | $100,556 |
| Total | $50,013 | $39,319 |
Family Income in Alum Rock
Family Income Brackets in Alum Rock
According to the Alum Rock family income data, there are 512 families falling into the $100,000 to $149,999 income range, which is the most common income bracket and makes up 22.3% of all families. Conversely, the less than $10,000 income bracket is the least frequent group with only 11 families (0.5%) belonging to this category.
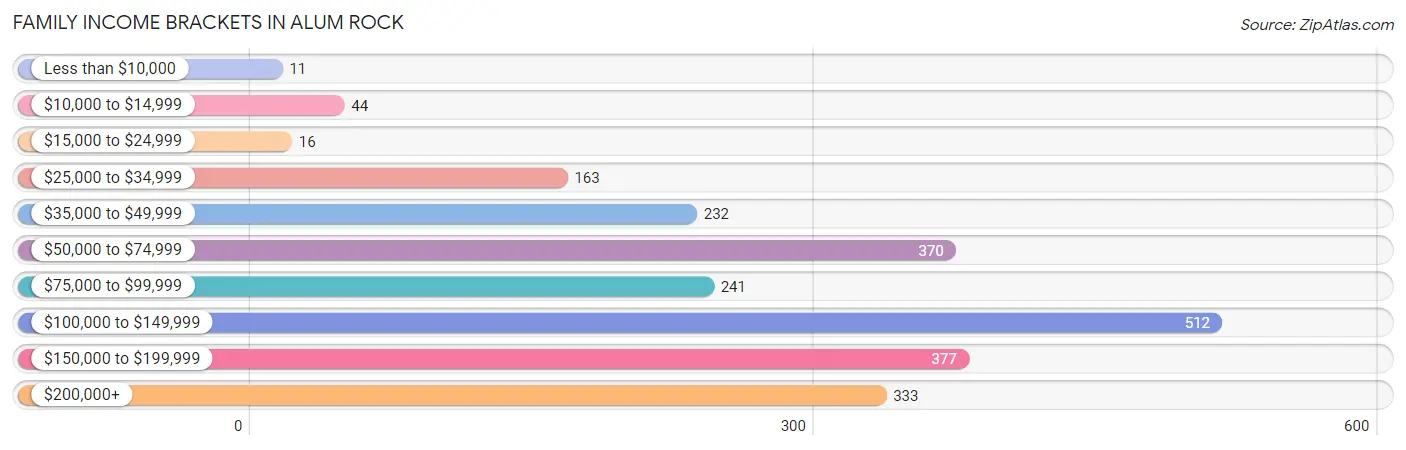
| Income Bracket | # Families | % Families |
| Less than $10,000 | 11 | 0.5% |
| $10,000 to $14,999 | 44 | 1.9% |
| $15,000 to $24,999 | 16 | 0.7% |
| $25,000 to $34,999 | 163 | 7.1% |
| $35,000 to $49,999 | 232 | 10.1% |
| $50,000 to $74,999 | 370 | 16.1% |
| $75,000 to $99,999 | 241 | 10.5% |
| $100,000 to $149,999 | 512 | 22.3% |
| $150,000 to $199,999 | 377 | 16.4% |
| $200,000+ | 333 | 14.5% |
Family Income by Famaliy Size in Alum Rock
6-person families (203 | 8.8%) account for the highest median family income in Alum Rock with $152,734 per family, while 3-person families (398 | 17.3%) have the highest median income of $35,067 per family member.
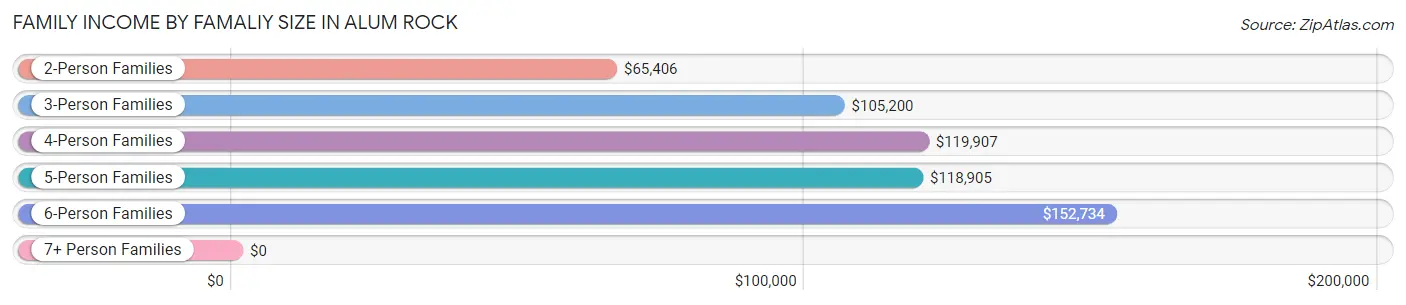
| Income Bracket | # Families | Median Income |
| 2-Person Families | 601 (26.2%) | $65,406 |
| 3-Person Families | 398 (17.3%) | $105,200 |
| 4-Person Families | 580 (25.3%) | $119,907 |
| 5-Person Families | 343 (14.9%) | $118,905 |
| 6-Person Families | 203 (8.8%) | $152,734 |
| 7+ Person Families | 171 (7.4%) | $0 |
| Total | 2,296 (100.0%) | $109,107 |
Family Income by Number of Earners in Alum Rock
The median family income in Alum Rock is $109,107, with families comprising 2 earners (626) having the highest median family income of $144,167, while families with no earners (272) have the lowest median family income of $39,470, accounting for 27.3% and 11.8% of families, respectively.
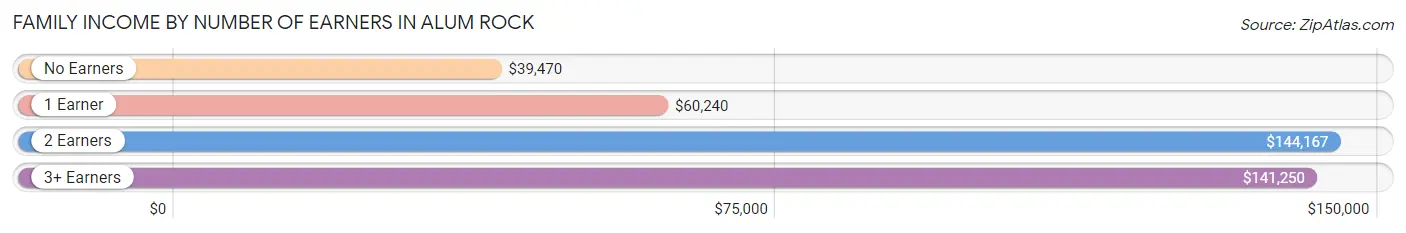
| Number of Earners | # Families | Median Income |
| No Earners | 272 (11.8%) | $39,470 |
| 1 Earner | 631 (27.5%) | $60,240 |
| 2 Earners | 626 (27.3%) | $144,167 |
| 3+ Earners | 767 (33.4%) | $141,250 |
| Total | 2,296 (100.0%) | $109,107 |
Household Income in Alum Rock
Household Income Brackets in Alum Rock
With 508 households falling in the category, the $100,000 to $149,999 income range is the most frequent in Alum Rock, accounting for 18.3% of all households. In contrast, only 25 households (0.9%) fall into the less than $10,000 income bracket, making it the least populous group.
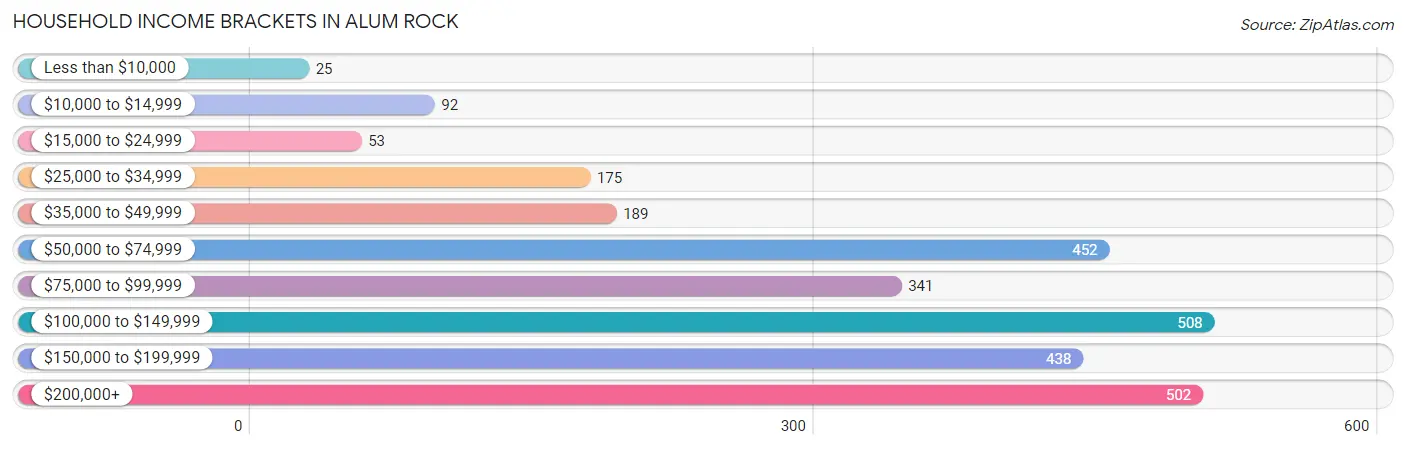
| Income Bracket | # Households | % Households |
| Less than $10,000 | 25 | 0.9% |
| $10,000 to $14,999 | 92 | 3.3% |
| $15,000 to $24,999 | 53 | 1.9% |
| $25,000 to $34,999 | 175 | 6.3% |
| $35,000 to $49,999 | 189 | 6.8% |
| $50,000 to $74,999 | 452 | 16.3% |
| $75,000 to $99,999 | 341 | 12.3% |
| $100,000 to $149,999 | 508 | 18.3% |
| $150,000 to $199,999 | 438 | 15.8% |
| $200,000+ | 502 | 18.1% |
Household Income by Householder Age in Alum Rock
The median household income in Alum Rock is $108,929, with the highest median household income of $150,553 found in the 45 to 64 years age bracket for the primary householder. A total of 1,129 households (40.7%) fall into this category. Meanwhile, the 15 to 24 years age bracket for the primary householder has the lowest median household income of $0, with 28 households (1.0%) in this group.
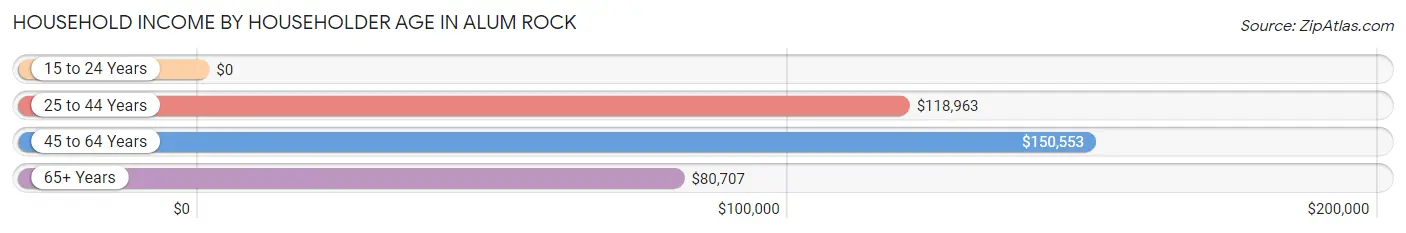
| Income Bracket | # Households | Median Income |
| 15 to 24 Years | 28 (1.0%) | $0 |
| 25 to 44 Years | 949 (34.2%) | $118,963 |
| 45 to 64 Years | 1,129 (40.7%) | $150,553 |
| 65+ Years | 668 (24.1%) | $80,707 |
| Total | 2,774 (100.0%) | $108,929 |
Poverty in Alum Rock
Income Below Poverty by Sex and Age in Alum Rock
With 8.3% poverty level for males and 11.4% for females among the residents of Alum Rock, 15 year old males and 16 and 17 year old females are the most vulnerable to poverty, with 51 males (78.5%) and 41 females (28.3%) in their respective age groups living below the poverty level.
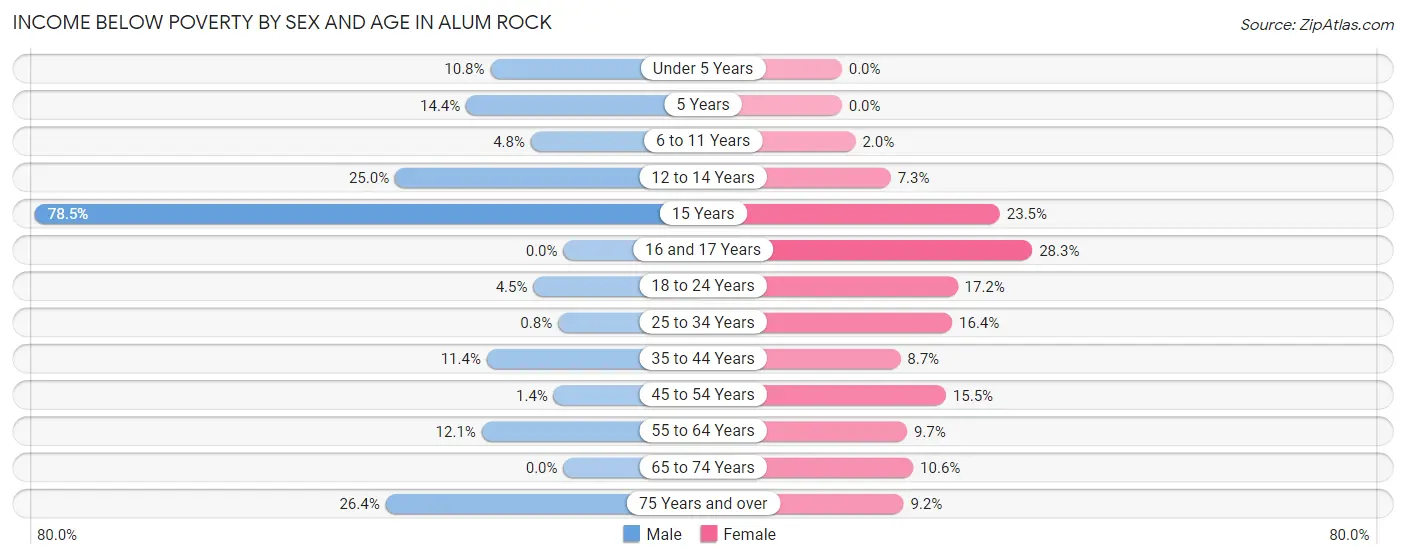
| Age Bracket | Male | Female |
| Under 5 Years | 40 (10.8%) | 0 (0.0%) |
| 5 Years | 26 (14.4%) | 0 (0.0%) |
| 6 to 11 Years | 15 (4.8%) | 6 (2.0%) |
| 12 to 14 Years | 54 (25.0%) | 26 (7.3%) |
| 15 Years | 51 (78.5%) | 23 (23.5%) |
| 16 and 17 Years | 0 (0.0%) | 41 (28.3%) |
| 18 to 24 Years | 29 (4.5%) | 107 (17.2%) |
| 25 to 34 Years | 7 (0.8%) | 134 (16.4%) |
| 35 to 44 Years | 89 (11.4%) | 73 (8.7%) |
| 45 to 54 Years | 12 (1.4%) | 117 (15.5%) |
| 55 to 64 Years | 78 (12.1%) | 48 (9.7%) |
| 65 to 74 Years | 0 (0.0%) | 51 (10.6%) |
| 75 Years and over | 75 (26.4%) | 40 (9.2%) |
| Total | 476 (8.3%) | 666 (11.4%) |
Income Above Poverty by Sex and Age in Alum Rock
According to the poverty statistics in Alum Rock, males aged 16 and 17 years and females aged under 5 years are the age groups that are most secure financially, with 100.0% of males and 100.0% of females in these age groups living above the poverty line.
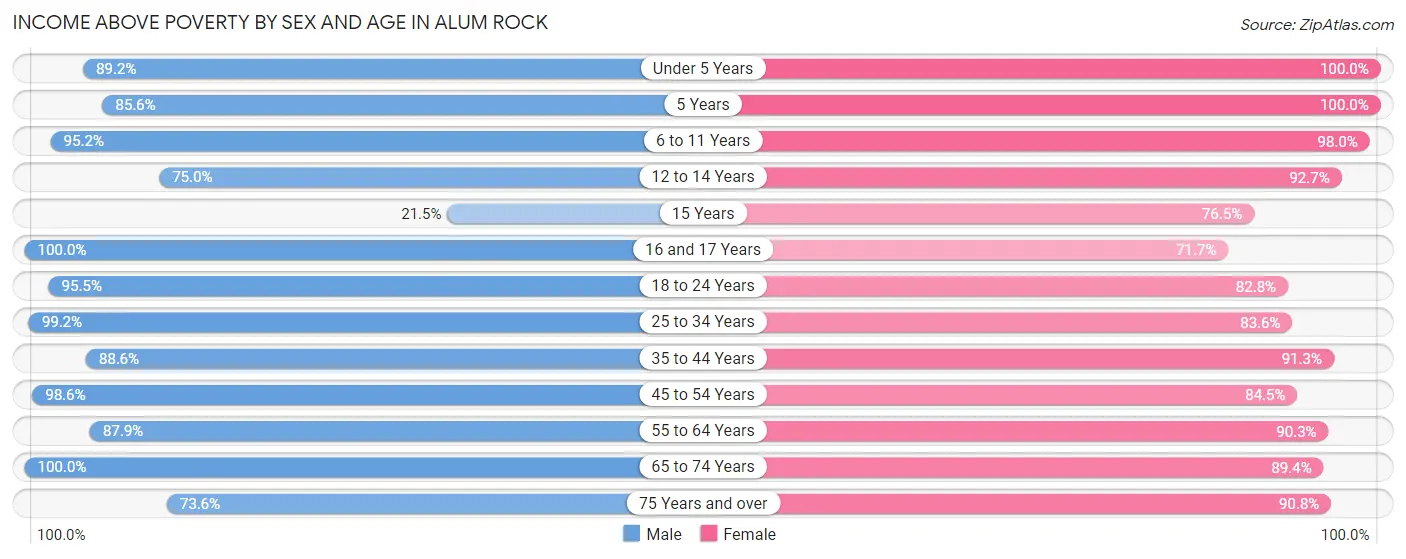
| Age Bracket | Male | Female |
| Under 5 Years | 329 (89.2%) | 331 (100.0%) |
| 5 Years | 154 (85.6%) | 152 (100.0%) |
| 6 to 11 Years | 295 (95.2%) | 289 (98.0%) |
| 12 to 14 Years | 162 (75.0%) | 332 (92.7%) |
| 15 Years | 14 (21.5%) | 75 (76.5%) |
| 16 and 17 Years | 39 (100.0%) | 104 (71.7%) |
| 18 to 24 Years | 621 (95.5%) | 515 (82.8%) |
| 25 to 34 Years | 871 (99.2%) | 684 (83.6%) |
| 35 to 44 Years | 693 (88.6%) | 767 (91.3%) |
| 45 to 54 Years | 820 (98.6%) | 640 (84.5%) |
| 55 to 64 Years | 565 (87.9%) | 448 (90.3%) |
| 65 to 74 Years | 512 (100.0%) | 430 (89.4%) |
| 75 Years and over | 209 (73.6%) | 396 (90.8%) |
| Total | 5,284 (91.7%) | 5,163 (88.6%) |
Income Below Poverty Among Married-Couple Families in Alum Rock
The poverty statistics for married-couple families in Alum Rock show that 3.7% or 56 of the total 1,502 families live below the poverty line. Families with no children have the highest poverty rate of 7.2%, comprising of 56 families. On the other hand, families with 1 or 2 children have the lowest poverty rate of 0.0%, which includes 0 families.
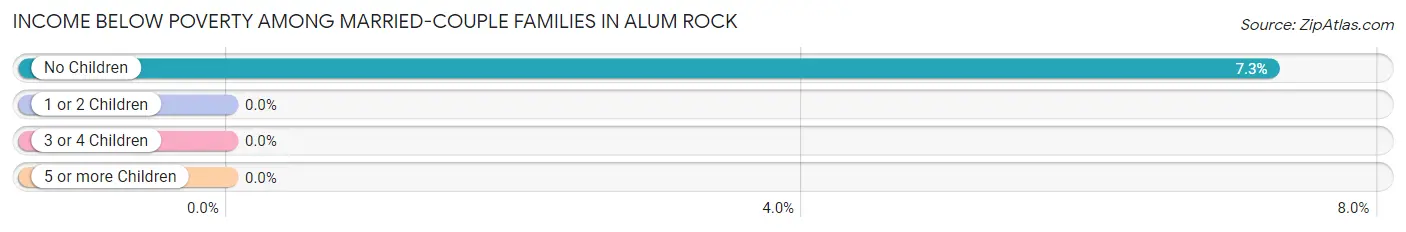
| Children | Above Poverty | Below Poverty |
| No Children | 716 (92.7%) | 56 (7.2%) |
| 1 or 2 Children | 572 (100.0%) | 0 (0.0%) |
| 3 or 4 Children | 158 (100.0%) | 0 (0.0%) |
| 5 or more Children | 0 (0.0%) | 0 (0.0%) |
| Total | 1,446 (96.3%) | 56 (3.7%) |
Income Below Poverty Among Single-Parent Households in Alum Rock
According to the poverty data in Alum Rock, 2.0% or 6 single-father households and 16.6% or 82 single-mother households are living below the poverty line. Among single-father households, those with 1 or 2 children have the highest poverty rate, with 6 households (6.2%) experiencing poverty. Likewise, among single-mother households, those with 3 or 4 children have the highest poverty rate, with 33 households (32.0%) falling below the poverty line.
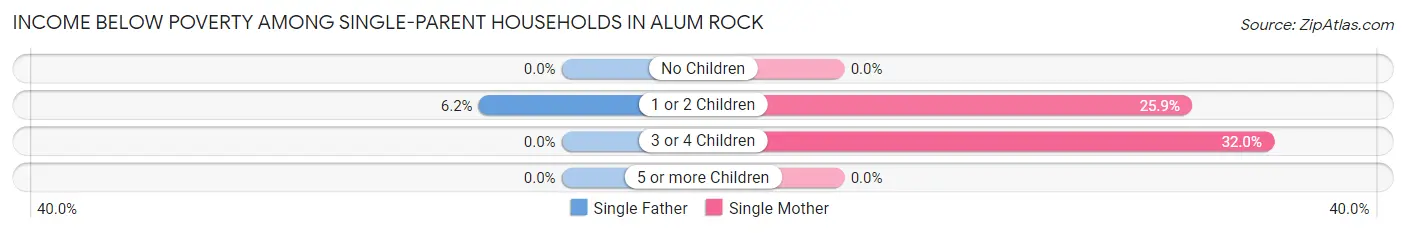
| Children | Single Father | Single Mother |
| No Children | 0 (0.0%) | 0 (0.0%) |
| 1 or 2 Children | 6 (6.2%) | 49 (25.9%) |
| 3 or 4 Children | 0 (0.0%) | 33 (32.0%) |
| 5 or more Children | 0 (0.0%) | 0 (0.0%) |
| Total | 6 (2.0%) | 82 (16.6%) |
Income Below Poverty Among Married-Couple vs Single-Parent Households in Alum Rock
The poverty data for Alum Rock shows that 56 of the married-couple family households (3.7%) and 88 of the single-parent households (11.1%) are living below the poverty level. Within the married-couple family households, those with no children have the highest poverty rate, with 56 households (7.2%) falling below the poverty line. Among the single-parent households, those with 3 or 4 children have the highest poverty rate, with 33 household (24.6%) living below poverty.
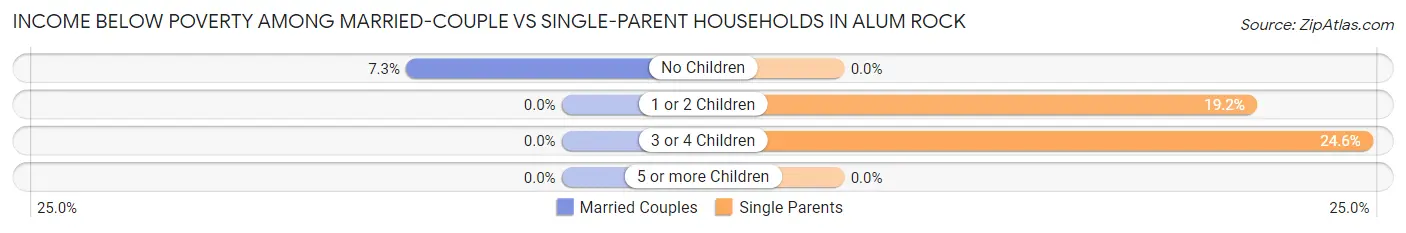
| Children | Married-Couple Families | Single-Parent Households |
| No Children | 56 (7.2%) | 0 (0.0%) |
| 1 or 2 Children | 0 (0.0%) | 55 (19.2%) |
| 3 or 4 Children | 0 (0.0%) | 33 (24.6%) |
| 5 or more Children | 0 (0.0%) | 0 (0.0%) |
| Total | 56 (3.7%) | 88 (11.1%) |
Race in Alum Rock
The most populous races in Alum Rock are Hispanic or Latino (8,343 | 70.5%), Some other Race (5,078 | 42.9%), and White / Caucasian (3,039 | 25.7%).
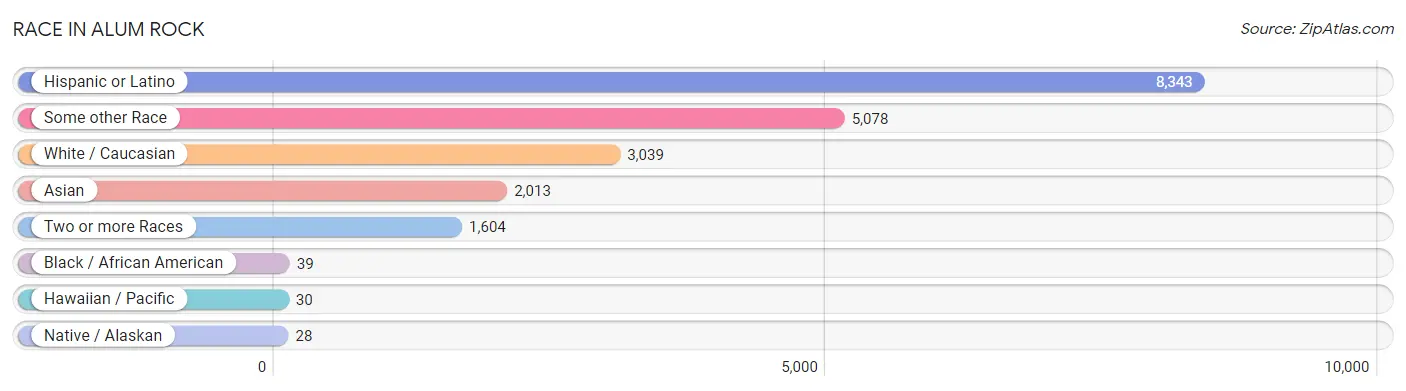
| Race | # Population | % Population |
| Asian | 2,013 | 17.0% |
| Black / African American | 39 | 0.3% |
| Hawaiian / Pacific | 30 | 0.3% |
| Hispanic or Latino | 8,343 | 70.5% |
| Native / Alaskan | 28 | 0.2% |
| White / Caucasian | 3,039 | 25.7% |
| Two or more Races | 1,604 | 13.6% |
| Some other Race | 5,078 | 42.9% |
| Total | 11,831 | 100.0% |
Ancestry in Alum Rock
The most populous ancestries reported in Alum Rock are Mexican (7,292 | 61.6%), Sri Lankan (1,202 | 10.2%), Indian (Asian) (537 | 4.5%), Korean (367 | 3.1%), and Central American (258 | 2.2%), together accounting for 81.6% of all Alum Rock residents.
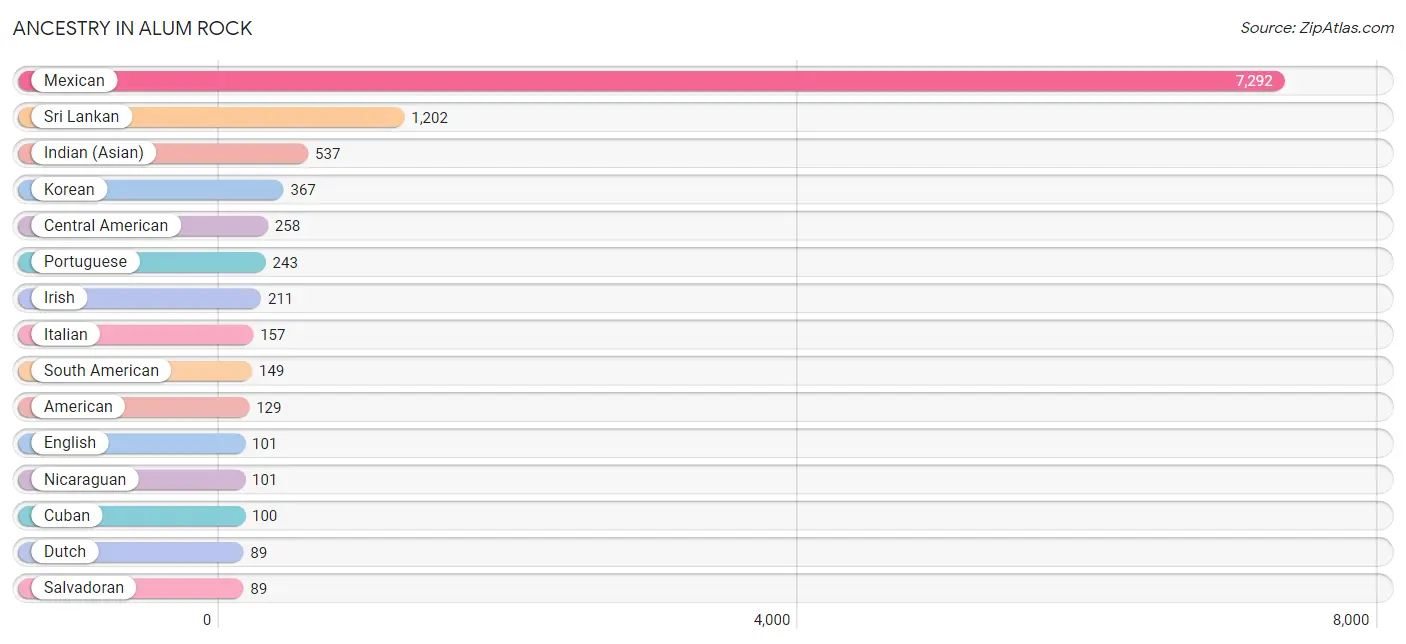
| Ancestry | # Population | % Population |
| American | 129 | 1.1% |
| Arab | 53 | 0.4% |
| Bhutanese | 35 | 0.3% |
| Bolivian | 10 | 0.1% |
| Burmese | 22 | 0.2% |
| Canadian | 21 | 0.2% |
| Central American | 258 | 2.2% |
| Central American Indian | 14 | 0.1% |
| Chilean | 44 | 0.4% |
| Colombian | 63 | 0.5% |
| Cuban | 100 | 0.9% |
| Danish | 25 | 0.2% |
| Dutch | 89 | 0.7% |
| Ecuadorian | 32 | 0.3% |
| English | 101 | 0.9% |
| European | 8 | 0.1% |
| Filipino | 16 | 0.1% |
| French | 47 | 0.4% |
| German | 59 | 0.5% |
| Guamanian / Chamorro | 13 | 0.1% |
| Guatemalan | 68 | 0.6% |
| Indian (Asian) | 537 | 4.5% |
| Iranian | 70 | 0.6% |
| Irish | 211 | 1.8% |
| Italian | 157 | 1.3% |
| Japanese | 5 | 0.0% |
| Korean | 367 | 3.1% |
| Lebanese | 53 | 0.4% |
| Malaysian | 28 | 0.2% |
| Mexican | 7,292 | 61.6% |
| Mexican American Indian | 33 | 0.3% |
| Nicaraguan | 101 | 0.9% |
| Northern European | 17 | 0.1% |
| Norwegian | 1 | 0.0% |
| Polish | 20 | 0.2% |
| Portuguese | 243 | 2.1% |
| Puerto Rican | 12 | 0.1% |
| Romanian | 40 | 0.3% |
| Salvadoran | 89 | 0.7% |
| Samoan | 17 | 0.1% |
| Scotch-Irish | 47 | 0.4% |
| Scottish | 50 | 0.4% |
| Sioux | 8 | 0.1% |
| Slovak | 11 | 0.1% |
| South American | 149 | 1.3% |
| Spaniard | 57 | 0.5% |
| Spanish | 35 | 0.3% |
| Sri Lankan | 1,202 | 10.2% |
| Thai | 30 | 0.3% |
| Tongan | 17 | 0.1% |
| Welsh | 20 | 0.2% | View All 51 Rows |
Immigrants in Alum Rock
The most numerous immigrant groups reported in Alum Rock came from Latin America (3,172 | 26.8%), Central America (3,101 | 26.2%), Mexico (3,012 | 25.5%), Asia (1,474 | 12.5%), and South Eastern Asia (1,096 | 9.3%), together accounting for 100.2% of all Alum Rock residents.
| Immigration Origin | # Population | % Population |
| Asia | 1,474 | 12.5% |
| Azores | 14 | 0.1% |
| Bolivia | 10 | 0.1% |
| Cambodia | 10 | 0.1% |
| Caribbean | 31 | 0.3% |
| Central America | 3,101 | 26.2% |
| China | 271 | 2.3% |
| Colombia | 30 | 0.3% |
| Cuba | 31 | 0.3% |
| Eastern Asia | 271 | 2.3% |
| Eastern Europe | 18 | 0.2% |
| El Salvador | 47 | 0.4% |
| England | 9 | 0.1% |
| Europe | 177 | 1.5% |
| Guatemala | 30 | 0.3% |
| Hong Kong | 45 | 0.4% |
| India | 15 | 0.1% |
| Iran | 50 | 0.4% |
| Israel | 24 | 0.2% |
| Italy | 35 | 0.3% |
| Laos | 28 | 0.2% |
| Latin America | 3,172 | 26.8% |
| Lebanon | 18 | 0.2% |
| Mexico | 3,012 | 25.5% |
| Netherlands | 26 | 0.2% |
| Nicaragua | 12 | 0.1% |
| Northern Europe | 9 | 0.1% |
| Philippines | 183 | 1.5% |
| Portugal | 89 | 0.7% |
| Romania | 18 | 0.2% |
| South America | 40 | 0.3% |
| South Central Asia | 65 | 0.5% |
| South Eastern Asia | 1,096 | 9.3% |
| Southern Europe | 124 | 1.1% |
| Taiwan | 104 | 0.9% |
| Vietnam | 875 | 7.4% |
| Western Asia | 42 | 0.4% |
| Western Europe | 26 | 0.2% | View All 38 Rows |
Sex and Age in Alum Rock
Sex and Age in Alum Rock
The most populous age groups in Alum Rock are 30 to 34 Years (559 | 9.5%) for men and 15 to 19 Years (486 | 8.2%) for women.
| Age Bracket | Male | Female |
| Under 5 Years | 404 (6.9%) | 331 (5.6%) |
| 5 to 9 Years | 365 (6.2%) | 329 (5.6%) |
| 10 to 14 Years | 341 (5.8%) | 480 (8.1%) |
| 15 to 19 Years | 261 (4.4%) | 486 (8.2%) |
| 20 to 24 Years | 495 (8.4%) | 379 (6.4%) |
| 25 to 29 Years | 320 (5.4%) | 415 (7.0%) |
| 30 to 34 Years | 559 (9.5%) | 404 (6.8%) |
| 35 to 39 Years | 395 (6.7%) | 386 (6.5%) |
| 40 to 44 Years | 387 (6.6%) | 464 (7.8%) |
| 45 to 49 Years | 439 (7.4%) | 334 (5.6%) |
| 50 to 54 Years | 423 (7.2%) | 428 (7.2%) |
| 55 to 59 Years | 323 (5.5%) | 284 (4.8%) |
| 60 to 64 Years | 335 (5.7%) | 234 (4.0%) |
| 65 to 69 Years | 238 (4.0%) | 303 (5.1%) |
| 70 to 74 Years | 289 (4.9%) | 197 (3.3%) |
| 75 to 79 Years | 160 (2.7%) | 173 (2.9%) |
| 80 to 84 Years | 92 (1.6%) | 161 (2.7%) |
| 85 Years and over | 74 (1.3%) | 143 (2.4%) |
| Total | 5,900 (100.0%) | 5,931 (100.0%) |
Families and Households in Alum Rock
Median Family Size in Alum Rock
The median family size in Alum Rock is 4.20 persons per family, with single female/mother families (493 | 21.5%) accounting for the largest median family size of 4.26 persons per family. On the other hand, single male/father families (301 | 13.1%) represent the smallest median family size with 4.06 persons per family.
| Family Type | # Families | Family Size |
| Married-Couple | 1,502 (65.4%) | 4.21 |
| Single Male/Father | 301 (13.1%) | 4.06 |
| Single Female/Mother | 493 (21.5%) | 4.26 |
| Total Families | 2,296 (100.0%) | 4.20 |
Median Household Size in Alum Rock
The median household size in Alum Rock is 4.12 persons per household, with single female/mother households (493 | 17.8%) accounting for the largest median household size of 4.87 persons per household. non-family households (478 | 17.2%) represent the smallest median household size with 1.42 persons per household.
| Household Type | # Households | Household Size |
| Married-Couple | 1,502 (54.1%) | 4.63 |
| Single Male/Father | 301 (10.8%) | 4.68 |
| Single Female/Mother | 493 (17.8%) | 4.87 |
| Non-family | 478 (17.2%) | 1.42 |
| Total Households | 2,774 (100.0%) | 4.12 |
Household Size by Marriage Status in Alum Rock
Out of a total of 2,774 households in Alum Rock, 2,296 (82.8%) are family households, while 478 (17.2%) are nonfamily households. The most numerous type of family households are 2-person households, comprising 486, and the most common type of nonfamily households are 1-person households, comprising 363.
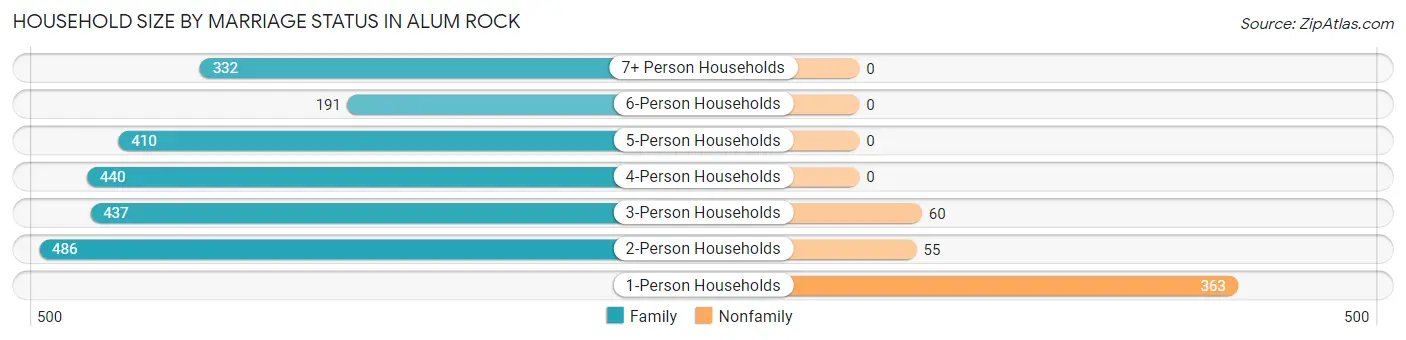
| Household Size | Family Households | Nonfamily Households |
| 1-Person Households | - | 363 (13.1%) |
| 2-Person Households | 486 (17.5%) | 55 (2.0%) |
| 3-Person Households | 437 (15.8%) | 60 (2.2%) |
| 4-Person Households | 440 (15.9%) | 0 (0.0%) |
| 5-Person Households | 410 (14.8%) | 0 (0.0%) |
| 6-Person Households | 191 (6.9%) | 0 (0.0%) |
| 7+ Person Households | 332 (12.0%) | 0 (0.0%) |
| Total | 2,296 (82.8%) | 478 (17.2%) |
Female Fertility in Alum Rock
Fertility by Age in Alum Rock
Average fertility rate in Alum Rock is 46.0 births per 1,000 women. Women in the age bracket of 20 to 34 years have the highest fertility rate with 102.0 births per 1,000 women. Women in the age bracket of 20 to 34 years acount for 90.4% of all women with births.
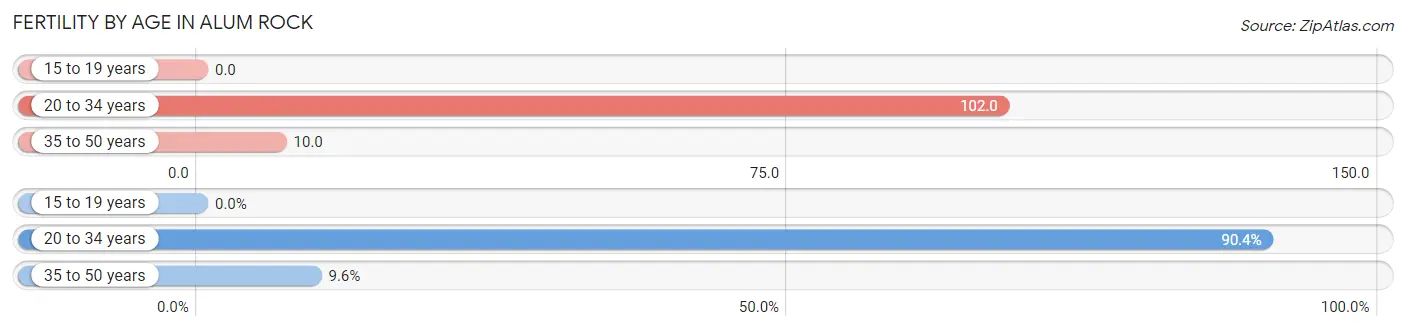
| Age Bracket | Women with Births | Births / 1,000 Women |
| 15 to 19 years | 0 (0.0%) | 0.0 |
| 20 to 34 years | 122 (90.4%) | 102.0 |
| 35 to 50 years | 13 (9.6%) | 10.0 |
| Total | 135 (100.0%) | 46.0 |
Fertility by Age by Marriage Status in Alum Rock
85.9% of women with births (135) in Alum Rock are married. The highest percentage of unmarried women with births falls into 35 to 50 years age bracket with 100.0% of them unmarried at the time of birth, while the lowest percentage of unmarried women with births belong to 20 to 34 years age bracket with 4.9% of them unmarried.
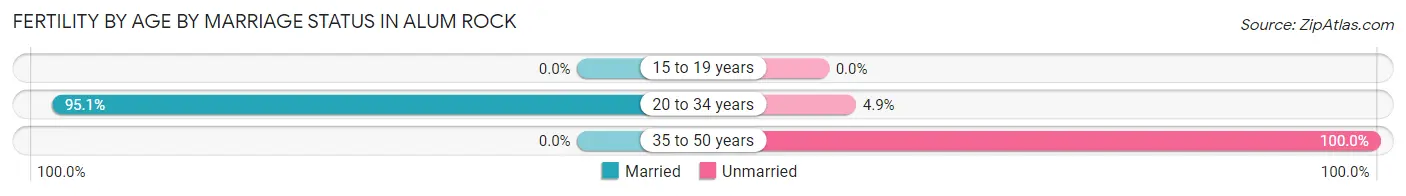
| Age Bracket | Married | Unmarried |
| 15 to 19 years | 0 (0.0%) | 0 (0.0%) |
| 20 to 34 years | 116 (95.1%) | 6 (4.9%) |
| 35 to 50 years | 0 (0.0%) | 13 (100.0%) |
| Total | 116 (85.9%) | 19 (14.1%) |
Fertility by Education in Alum Rock
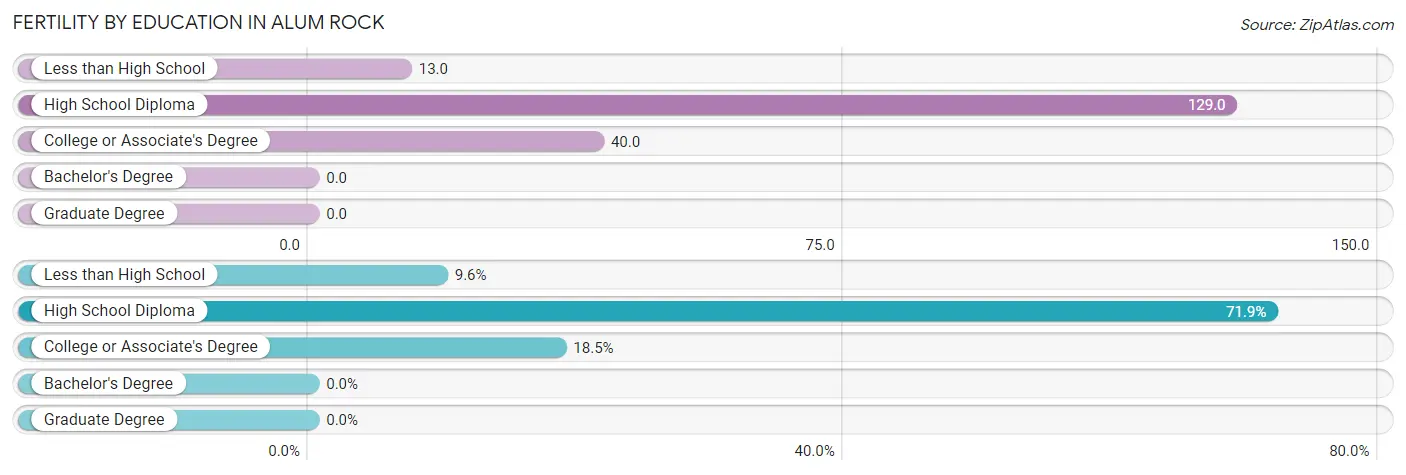
| Educational Attainment | Women with Births | Births / 1,000 Women |
| Less than High School | 13 (9.6%) | 13.0 |
| High School Diploma | 97 (71.9%) | 129.0 |
| College or Associate's Degree | 25 (18.5%) | 40.0 |
| Bachelor's Degree | 0 (0.0%) | 0.0 |
| Graduate Degree | 0 (0.0%) | 0.0 |
| Total | 135 (100.0%) | 46.0 |
Fertility by Education by Marriage Status in Alum Rock
14.1% of women with births in Alum Rock are unmarried. Women with the educational attainment of college or associate's degree are most likely to be married with 100.0% of them married at childbirth, while women with the educational attainment of less than high school are least likely to be married with 100.0% of them unmarried at childbirth.
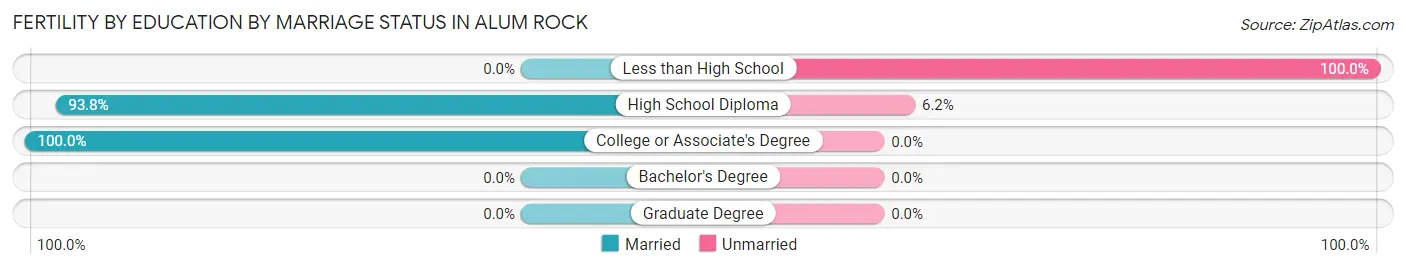
| Educational Attainment | Married | Unmarried |
| Less than High School | 0 (0.0%) | 13 (100.0%) |
| High School Diploma | 91 (93.8%) | 6 (6.2%) |
| College or Associate's Degree | 25 (100.0%) | 0 (0.0%) |
| Bachelor's Degree | 0 (0.0%) | 0 (0.0%) |
| Graduate Degree | 0 (0.0%) | 0 (0.0%) |
| Total | 116 (85.9%) | 19 (14.1%) |
Employment Characteristics in Alum Rock
Employment by Class of Employer in Alum Rock
Among the 5,760 employed individuals in Alum Rock, private company employees (4,263 | 74.0%), local government employees (464 | 8.1%), and self-employed (not incorporated) (444 | 7.7%) make up the most common classes of employment.
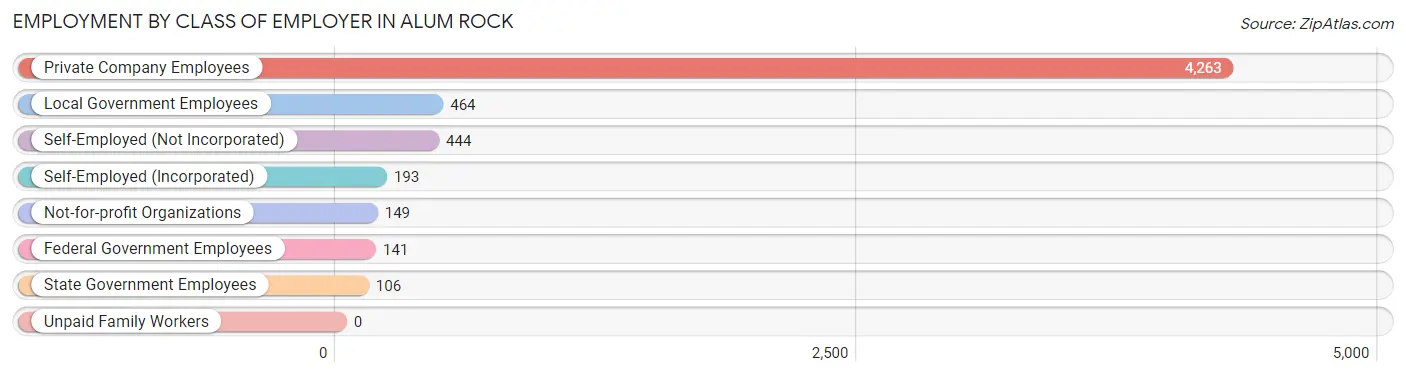
| Employer Class | # Employees | % Employees |
| Private Company Employees | 4,263 | 74.0% |
| Self-Employed (Incorporated) | 193 | 3.4% |
| Self-Employed (Not Incorporated) | 444 | 7.7% |
| Not-for-profit Organizations | 149 | 2.6% |
| Local Government Employees | 464 | 8.1% |
| State Government Employees | 106 | 1.8% |
| Federal Government Employees | 141 | 2.5% |
| Unpaid Family Workers | 0 | 0.0% |
| Total | 5,760 | 100.0% |
Employment Status by Age in Alum Rock
According to the labor force statistics for Alum Rock, out of the total population over 16 years of age (9,418), 65.6% or 6,178 individuals are in the labor force, with 5.3% or 327 of them unemployed. The age group with the highest labor force participation rate is 35 to 44 years, with 87.5% or 1,428 individuals in the labor force. Within the labor force, the 55 to 59 years age range has the highest percentage of unemployed individuals, with 14.8% or 55 of them being unemployed.
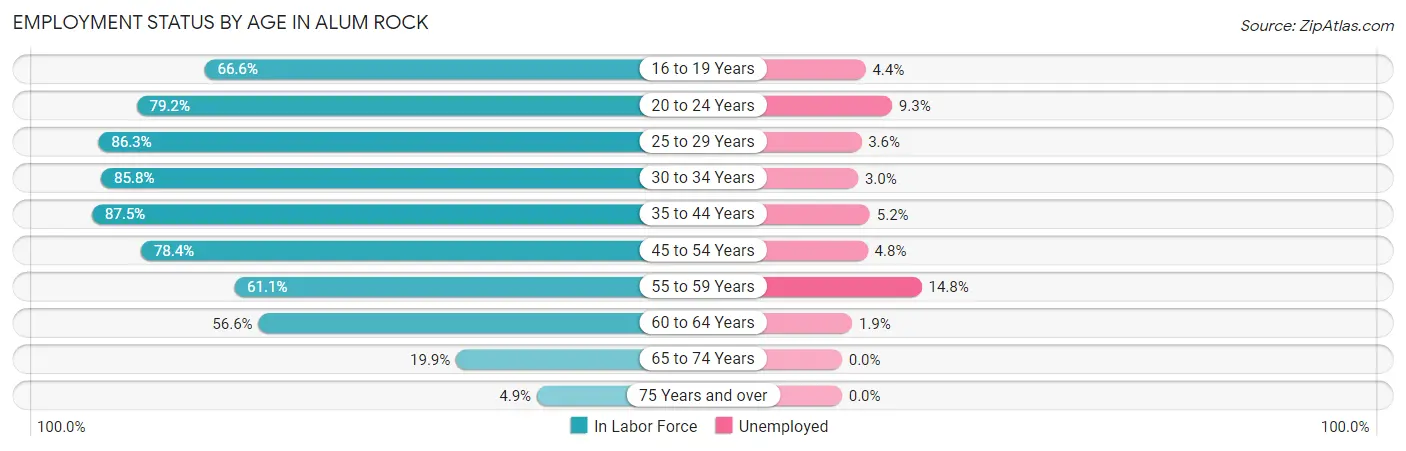
| Age Bracket | In Labor Force | Unemployed |
| 16 to 19 Years | 389 (66.6%) | 17 (4.4%) |
| 20 to 24 Years | 692 (79.2%) | 64 (9.3%) |
| 25 to 29 Years | 634 (86.3%) | 23 (3.6%) |
| 30 to 34 Years | 826 (85.8%) | 25 (3.0%) |
| 35 to 44 Years | 1,428 (87.5%) | 74 (5.2%) |
| 45 to 54 Years | 1,273 (78.4%) | 61 (4.8%) |
| 55 to 59 Years | 371 (61.1%) | 55 (14.8%) |
| 60 to 64 Years | 322 (56.6%) | 6 (1.9%) |
| 65 to 74 Years | 204 (19.9%) | 0 (0.0%) |
| 75 Years and over | 39 (4.9%) | 0 (0.0%) |
| Total | 6,178 (65.6%) | 327 (5.3%) |
Employment Status by Educational Attainment in Alum Rock
According to labor force statistics for Alum Rock, 79.2% of individuals (4,855) out of the total population between 25 and 64 years of age (6,130) are in the labor force, with 5.1% or 248 of them being unemployed. The group with the highest labor force participation rate are those with the educational attainment of bachelor's degree or higher, with 88.9% or 1,118 individuals in the labor force. Within the labor force, individuals with college / associate degree education have the highest percentage of unemployment, with 8.1% or 77 of them being unemployed.
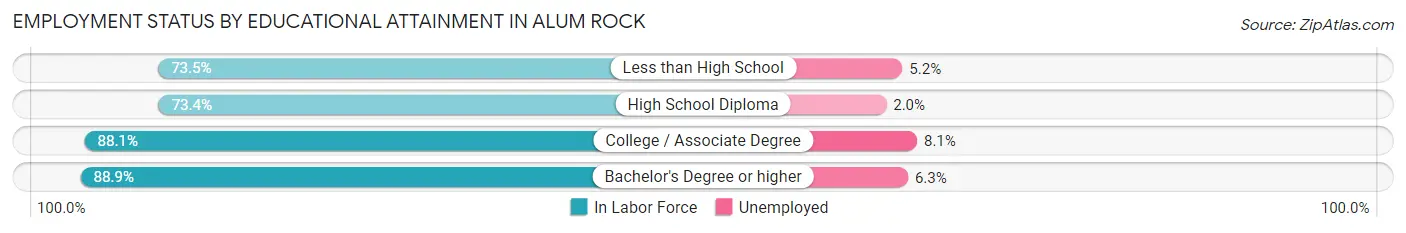
| Educational Attainment | In Labor Force | Unemployed |
| Less than High School | 1,318 (73.5%) | 93 (5.2%) |
| High School Diploma | 1,472 (73.4%) | 40 (2.0%) |
| College / Associate Degree | 946 (88.1%) | 87 (8.1%) |
| Bachelor's Degree or higher | 1,118 (88.9%) | 79 (6.3%) |
| Total | 4,855 (79.2%) | 313 (5.1%) |
Employment Occupations by Sex in Alum Rock
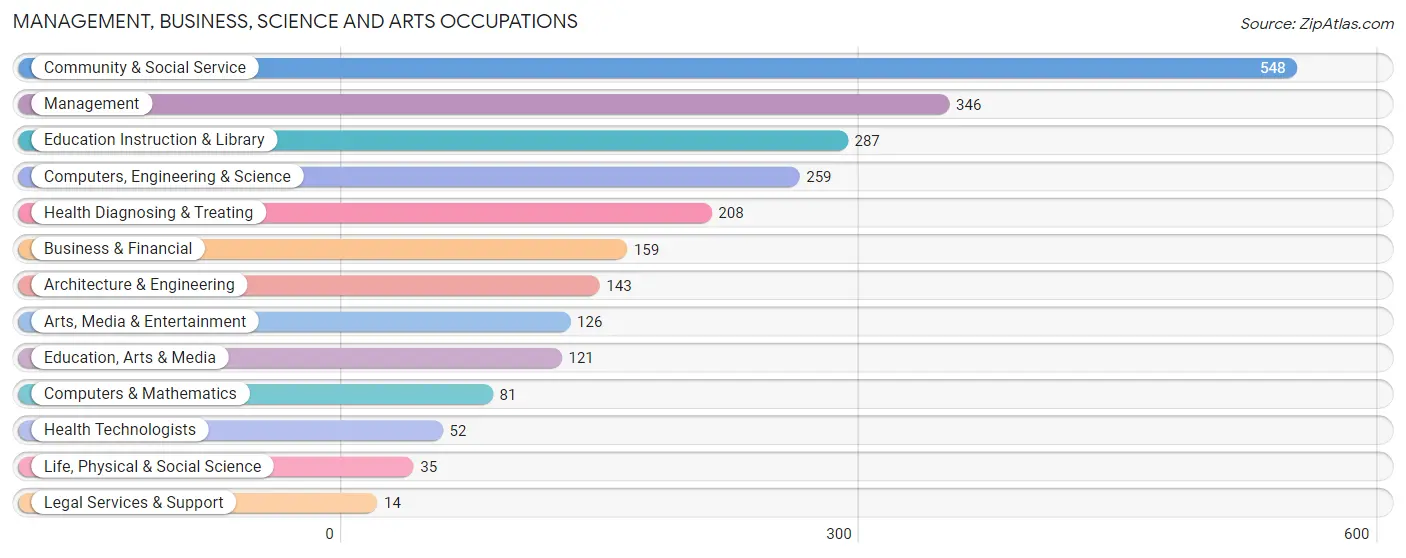
Management, Business, Science and Arts Occupations
The most common Management, Business, Science and Arts occupations in Alum Rock are Community & Social Service (548 | 9.5%), Management (346 | 6.0%), Education Instruction & Library (287 | 5.0%), Computers, Engineering & Science (259 | 4.5%), and Health Diagnosing & Treating (208 | 3.6%).
Management, Business, Science and Arts Occupations by Sex
Within the Management, Business, Science and Arts occupations in Alum Rock, the most male-oriented occupations are Architecture & Engineering (100.0%), Computers, Engineering & Science (79.1%), and Health Technologists (78.8%), while the most female-oriented occupations are Life, Physical & Social Science (100.0%), Legal Services & Support (100.0%), and Education Instruction & Library (67.9%).
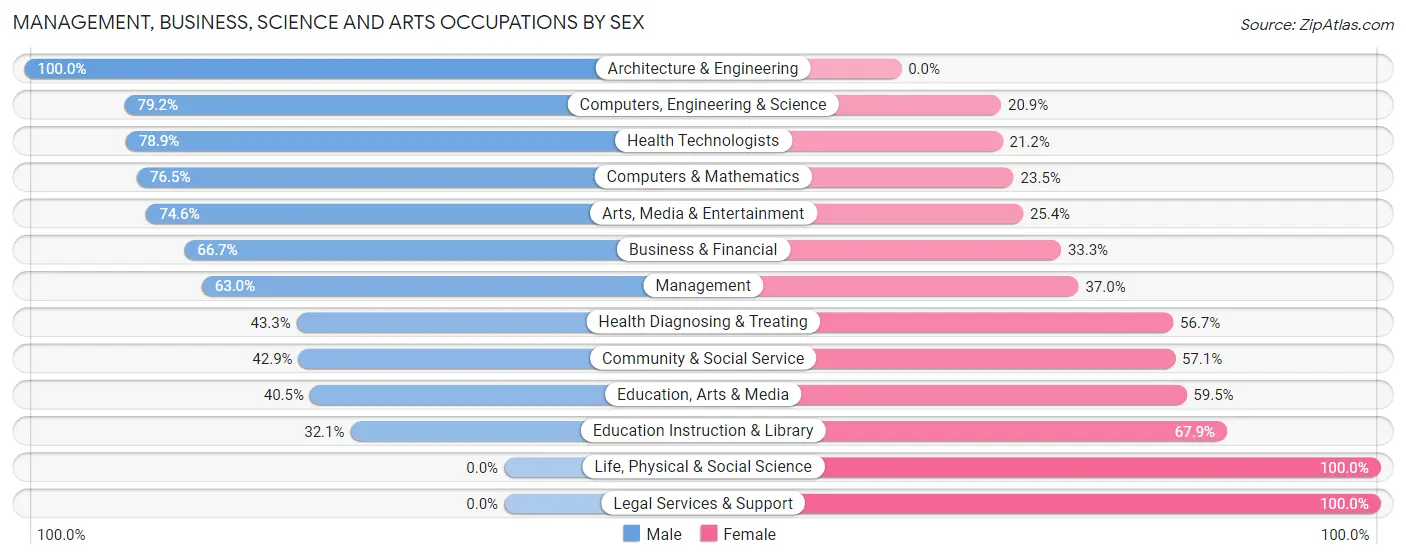
| Occupation | Male | Female |
| Management | 218 (63.0%) | 128 (37.0%) |
| Business & Financial | 106 (66.7%) | 53 (33.3%) |
| Computers, Engineering & Science | 205 (79.1%) | 54 (20.8%) |
| Computers & Mathematics | 62 (76.5%) | 19 (23.5%) |
| Architecture & Engineering | 143 (100.0%) | 0 (0.0%) |
| Life, Physical & Social Science | 0 (0.0%) | 35 (100.0%) |
| Community & Social Service | 235 (42.9%) | 313 (57.1%) |
| Education, Arts & Media | 49 (40.5%) | 72 (59.5%) |
| Legal Services & Support | 0 (0.0%) | 14 (100.0%) |
| Education Instruction & Library | 92 (32.1%) | 195 (67.9%) |
| Arts, Media & Entertainment | 94 (74.6%) | 32 (25.4%) |
| Health Diagnosing & Treating | 90 (43.3%) | 118 (56.7%) |
| Health Technologists | 41 (78.8%) | 11 (21.1%) |
| Total (Category) | 854 (56.2%) | 666 (43.8%) |
| Total (Overall) | 3,406 (59.1%) | 2,361 (40.9%) |
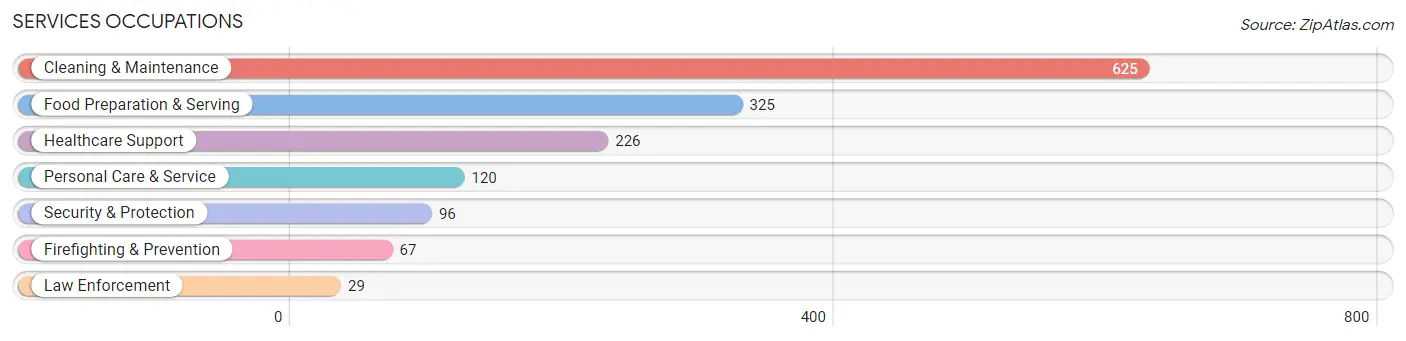
Services Occupations
The most common Services occupations in Alum Rock are Cleaning & Maintenance (625 | 10.8%), Food Preparation & Serving (325 | 5.6%), Healthcare Support (226 | 3.9%), Personal Care & Service (120 | 2.1%), and Security & Protection (96 | 1.7%).
Services Occupations by Sex
Within the Services occupations in Alum Rock, the most male-oriented occupations are Law Enforcement (72.4%), Personal Care & Service (70.0%), and Food Preparation & Serving (60.9%), while the most female-oriented occupations are Healthcare Support (86.3%), Firefighting & Prevention (73.1%), and Cleaning & Maintenance (67.7%).
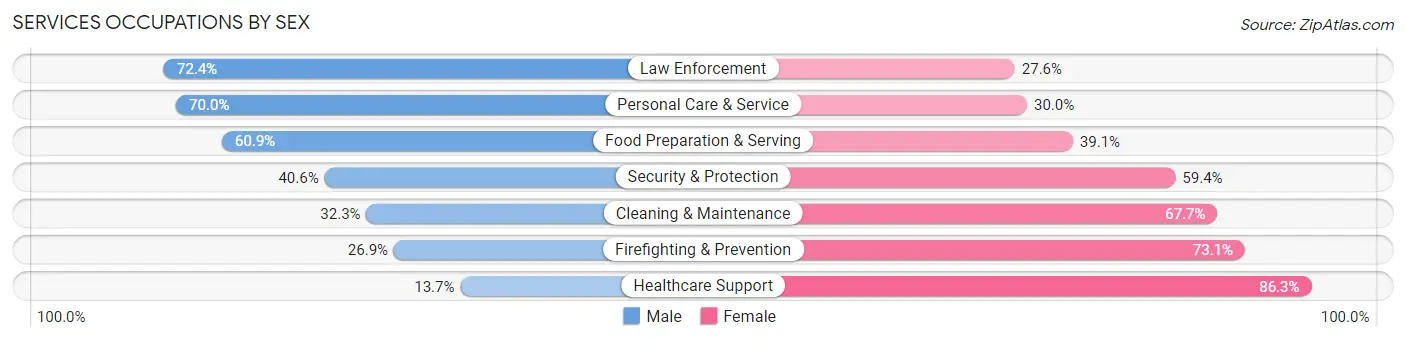
| Occupation | Male | Female |
| Healthcare Support | 31 (13.7%) | 195 (86.3%) |
| Security & Protection | 39 (40.6%) | 57 (59.4%) |
| Firefighting & Prevention | 18 (26.9%) | 49 (73.1%) |
| Law Enforcement | 21 (72.4%) | 8 (27.6%) |
| Food Preparation & Serving | 198 (60.9%) | 127 (39.1%) |
| Cleaning & Maintenance | 202 (32.3%) | 423 (67.7%) |
| Personal Care & Service | 84 (70.0%) | 36 (30.0%) |
| Total (Category) | 554 (39.8%) | 838 (60.2%) |
| Total (Overall) | 3,406 (59.1%) | 2,361 (40.9%) |
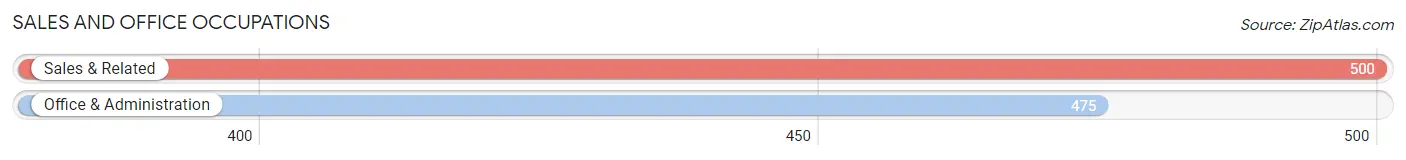
Sales and Office Occupations
The most common Sales and Office occupations in Alum Rock are Sales & Related (500 | 8.7%), and Office & Administration (475 | 8.2%).
Sales and Office Occupations by Sex
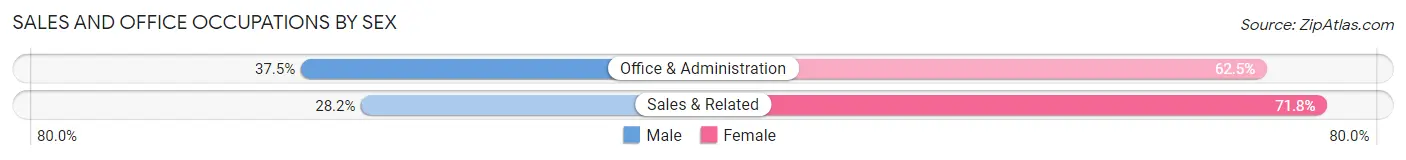
| Occupation | Male | Female |
| Sales & Related | 141 (28.2%) | 359 (71.8%) |
| Office & Administration | 178 (37.5%) | 297 (62.5%) |
| Total (Category) | 319 (32.7%) | 656 (67.3%) |
| Total (Overall) | 3,406 (59.1%) | 2,361 (40.9%) |
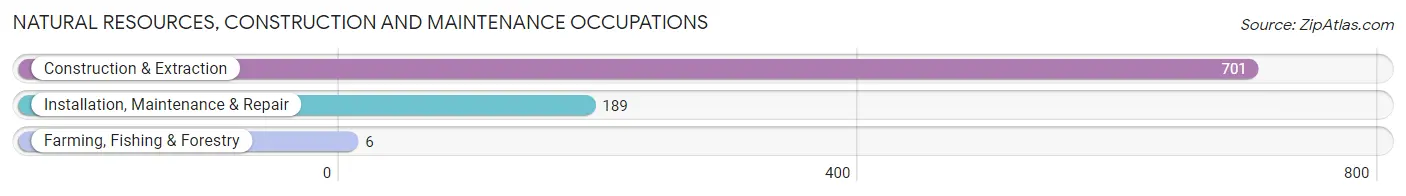
Natural Resources, Construction and Maintenance Occupations
The most common Natural Resources, Construction and Maintenance occupations in Alum Rock are Construction & Extraction (701 | 12.2%), Installation, Maintenance & Repair (189 | 3.3%), and Farming, Fishing & Forestry (6 | 0.1%).
Natural Resources, Construction and Maintenance Occupations by Sex
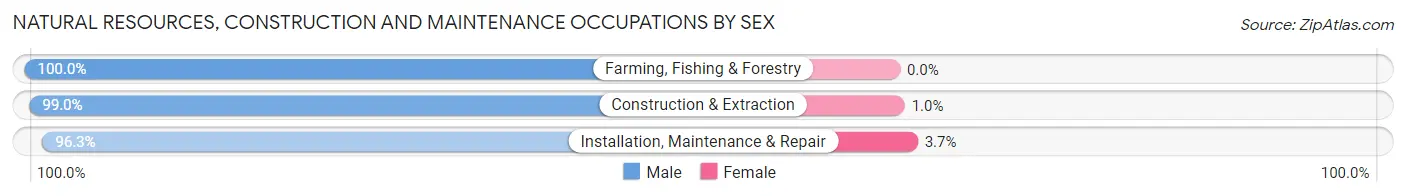
| Occupation | Male | Female |
| Farming, Fishing & Forestry | 6 (100.0%) | 0 (0.0%) |
| Construction & Extraction | 694 (99.0%) | 7 (1.0%) |
| Installation, Maintenance & Repair | 182 (96.3%) | 7 (3.7%) |
| Total (Category) | 882 (98.4%) | 14 (1.6%) |
| Total (Overall) | 3,406 (59.1%) | 2,361 (40.9%) |
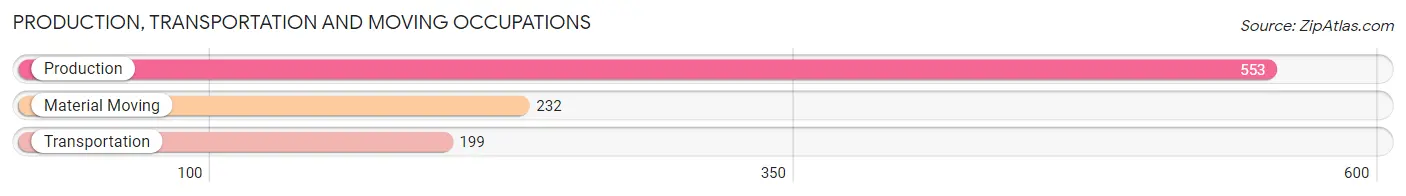
Production, Transportation and Moving Occupations
The most common Production, Transportation and Moving occupations in Alum Rock are Production (553 | 9.6%), Material Moving (232 | 4.0%), and Transportation (199 | 3.5%).
Production, Transportation and Moving Occupations by Sex
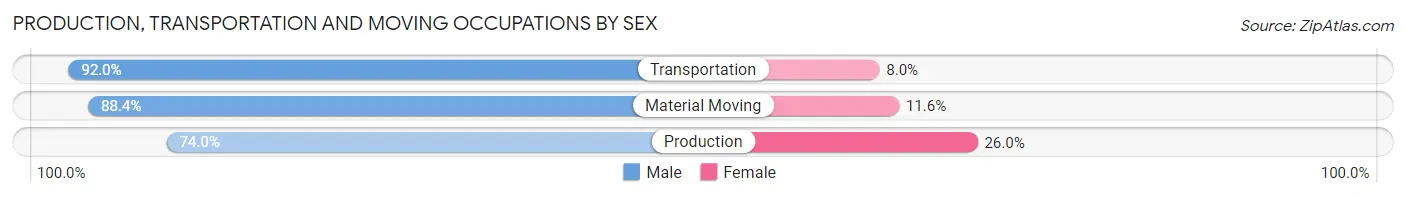
| Occupation | Male | Female |
| Production | 409 (74.0%) | 144 (26.0%) |
| Transportation | 183 (92.0%) | 16 (8.0%) |
| Material Moving | 205 (88.4%) | 27 (11.6%) |
| Total (Category) | 797 (81.0%) | 187 (19.0%) |
| Total (Overall) | 3,406 (59.1%) | 2,361 (40.9%) |
Employment Industries by Sex in Alum Rock
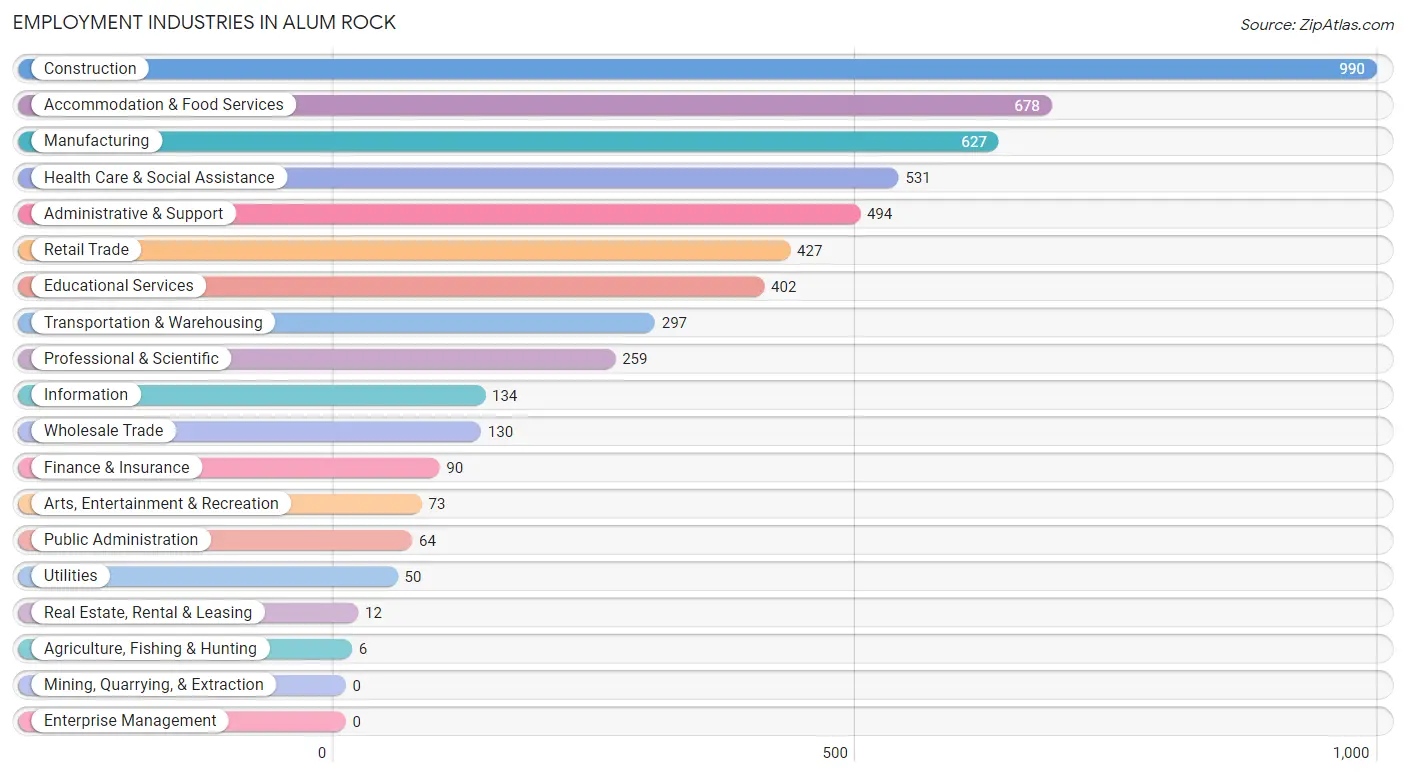
Employment Industries in Alum Rock
The major employment industries in Alum Rock include Construction (990 | 17.2%), Accommodation & Food Services (678 | 11.8%), Manufacturing (627 | 10.9%), Health Care & Social Assistance (531 | 9.2%), and Administrative & Support (494 | 8.6%).
Employment Industries by Sex in Alum Rock
The Alum Rock industries that see more men than women are Agriculture, Fishing & Hunting (100.0%), Utilities (100.0%), and Construction (93.8%), whereas the industries that tend to have a higher number of women are Real Estate, Rental & Leasing (100.0%), Finance & Insurance (68.9%), and Health Care & Social Assistance (67.4%).
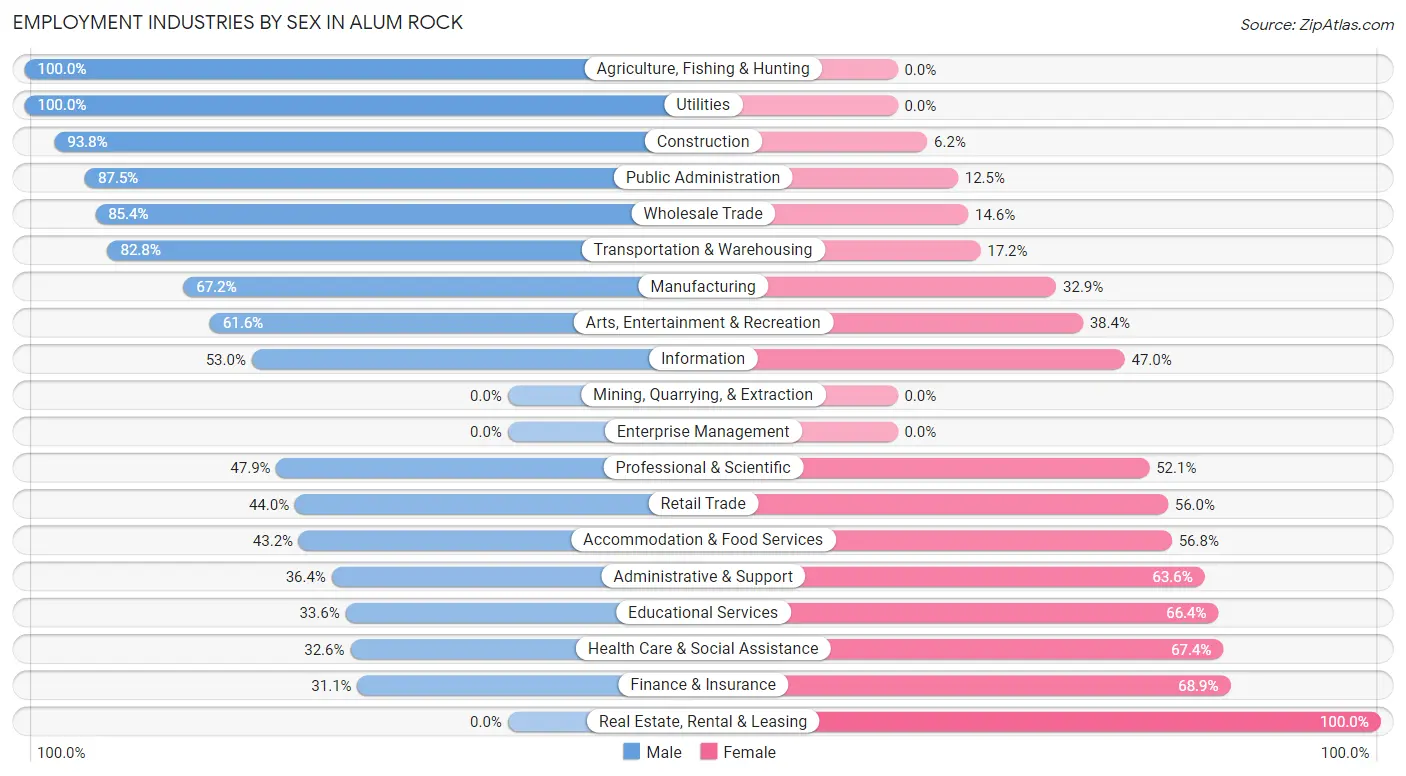
| Industry | Male | Female |
| Agriculture, Fishing & Hunting | 6 (100.0%) | 0 (0.0%) |
| Mining, Quarrying, & Extraction | 0 (0.0%) | 0 (0.0%) |
| Construction | 929 (93.8%) | 61 (6.2%) |
| Manufacturing | 421 (67.1%) | 206 (32.9%) |
| Wholesale Trade | 111 (85.4%) | 19 (14.6%) |
| Retail Trade | 188 (44.0%) | 239 (56.0%) |
| Transportation & Warehousing | 246 (82.8%) | 51 (17.2%) |
| Utilities | 50 (100.0%) | 0 (0.0%) |
| Information | 71 (53.0%) | 63 (47.0%) |
| Finance & Insurance | 28 (31.1%) | 62 (68.9%) |
| Real Estate, Rental & Leasing | 0 (0.0%) | 12 (100.0%) |
| Professional & Scientific | 124 (47.9%) | 135 (52.1%) |
| Enterprise Management | 0 (0.0%) | 0 (0.0%) |
| Administrative & Support | 180 (36.4%) | 314 (63.6%) |
| Educational Services | 135 (33.6%) | 267 (66.4%) |
| Health Care & Social Assistance | 173 (32.6%) | 358 (67.4%) |
| Arts, Entertainment & Recreation | 45 (61.6%) | 28 (38.4%) |
| Accommodation & Food Services | 293 (43.2%) | 385 (56.8%) |
| Public Administration | 56 (87.5%) | 8 (12.5%) |
| Total | 3,406 (59.1%) | 2,361 (40.9%) |
Education in Alum Rock
School Enrollment in Alum Rock
The most common levels of schooling among the 2,922 students in Alum Rock are college / undergraduate (851 | 29.1%), high school (728 | 24.9%), and middle school (456 | 15.6%).
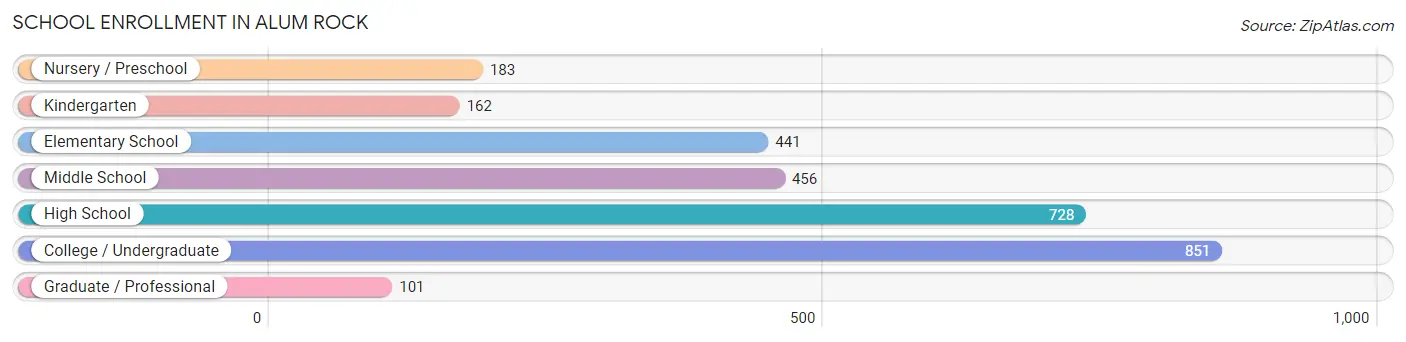
| School Level | # Students | % Students |
| Nursery / Preschool | 183 | 6.3% |
| Kindergarten | 162 | 5.5% |
| Elementary School | 441 | 15.1% |
| Middle School | 456 | 15.6% |
| High School | 728 | 24.9% |
| College / Undergraduate | 851 | 29.1% |
| Graduate / Professional | 101 | 3.5% |
| Total | 2,922 | 100.0% |
School Enrollment by Age by Funding Source in Alum Rock
Out of a total of 2,922 students who are enrolled in schools in Alum Rock, 286 (9.8%) attend a private institution, while the remaining 2,636 (90.2%) are enrolled in public schools. The age group of 3 to 4 year olds has the highest likelihood of being enrolled in private schools, with 72 (52.9% in the age bracket) enrolled. Conversely, the age group of 18 to 19 year olds has the lowest likelihood of being enrolled in a private school, with 278 (100.0% in the age bracket) attending a public institution.
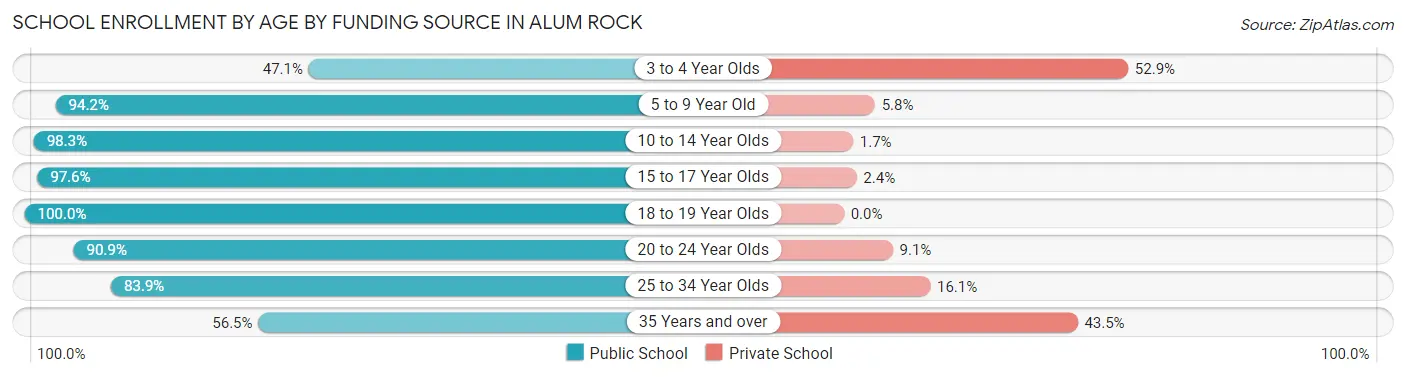
| Age Bracket | Public School | Private School |
| 3 to 4 Year Olds | 64 (47.1%) | 72 (52.9%) |
| 5 to 9 Year Old | 538 (94.2%) | 33 (5.8%) |
| 10 to 14 Year Olds | 807 (98.3%) | 14 (1.7%) |
| 15 to 17 Year Olds | 329 (97.6%) | 8 (2.4%) |
| 18 to 19 Year Olds | 278 (100.0%) | 0 (0.0%) |
| 20 to 24 Year Olds | 309 (90.9%) | 31 (9.1%) |
| 25 to 34 Year Olds | 193 (83.9%) | 37 (16.1%) |
| 35 Years and over | 118 (56.5%) | 91 (43.5%) |
| Total | 2,636 (90.2%) | 286 (9.8%) |
Educational Attainment by Field of Study in Alum Rock
Engineering (357 | 23.9%), arts & humanities (264 | 17.7%), business (193 | 12.9%), communications (103 | 6.9%), and education (84 | 5.6%) are the most common fields of study among 1,491 individuals in Alum Rock who have obtained a bachelor's degree or higher.
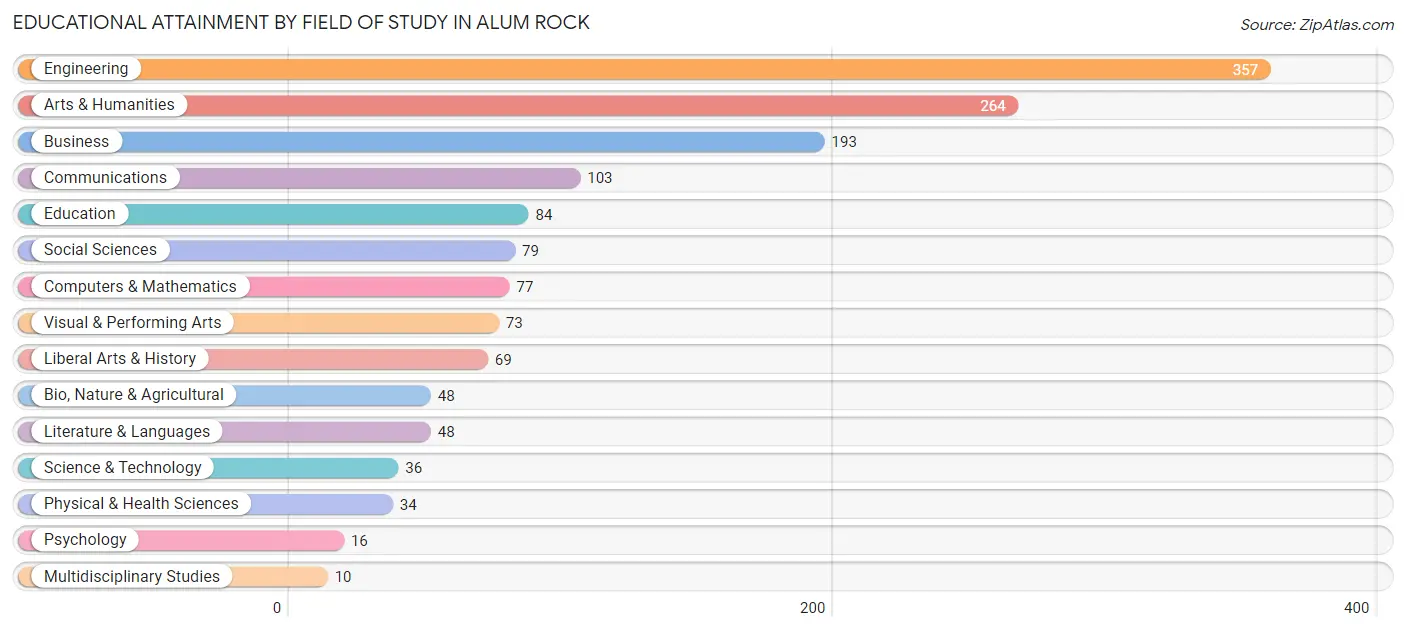
| Field of Study | # Graduates | % Graduates |
| Computers & Mathematics | 77 | 5.2% |
| Bio, Nature & Agricultural | 48 | 3.2% |
| Physical & Health Sciences | 34 | 2.3% |
| Psychology | 16 | 1.1% |
| Social Sciences | 79 | 5.3% |
| Engineering | 357 | 23.9% |
| Multidisciplinary Studies | 10 | 0.7% |
| Science & Technology | 36 | 2.4% |
| Business | 193 | 12.9% |
| Education | 84 | 5.6% |
| Literature & Languages | 48 | 3.2% |
| Liberal Arts & History | 69 | 4.6% |
| Visual & Performing Arts | 73 | 4.9% |
| Communications | 103 | 6.9% |
| Arts & Humanities | 264 | 17.7% |
| Total | 1,491 | 100.0% |
Transportation & Commute in Alum Rock
Vehicle Availability by Sex in Alum Rock
The most prevalent vehicle ownership categories in Alum Rock are males with 4 vehicles (1,182, accounting for 35.2%) and females with 4 vehicles (850, making up 50.5%).
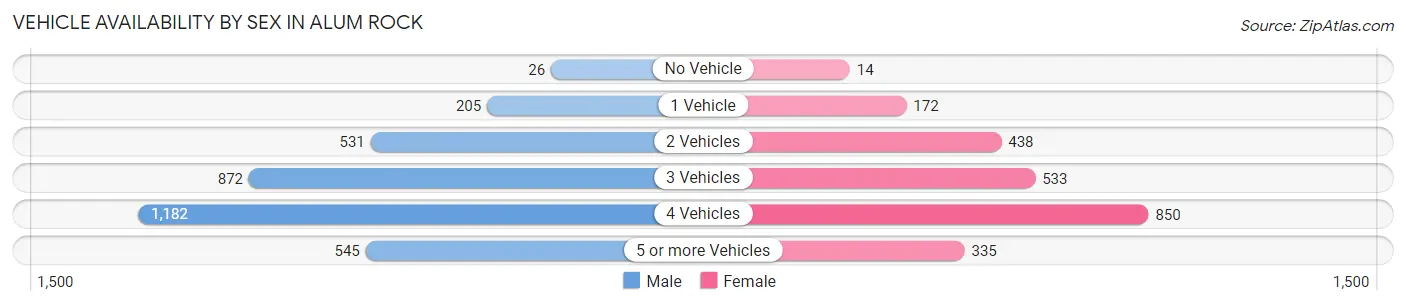
| Vehicles Available | Male | Female |
| No Vehicle | 26 (0.8%) | 14 (0.6%) |
| 1 Vehicle | 205 (6.1%) | 172 (7.3%) |
| 2 Vehicles | 531 (15.8%) | 438 (18.7%) |
| 3 Vehicles | 872 (25.9%) | 533 (22.8%) |
| 4 Vehicles | 1,182 (35.2%) | 850 (36.3%) |
| 5 or more Vehicles | 545 (16.2%) | 335 (14.3%) |
| Total | 3,361 (100.0%) | 2,342 (100.0%) |
Commute Time in Alum Rock
The most frequently occuring commute durations in Alum Rock are 30 to 34 minutes (1,249 commuters, 22.6%), 20 to 24 minutes (1,073 commuters, 19.4%), and 15 to 19 minutes (936 commuters, 17.0%).
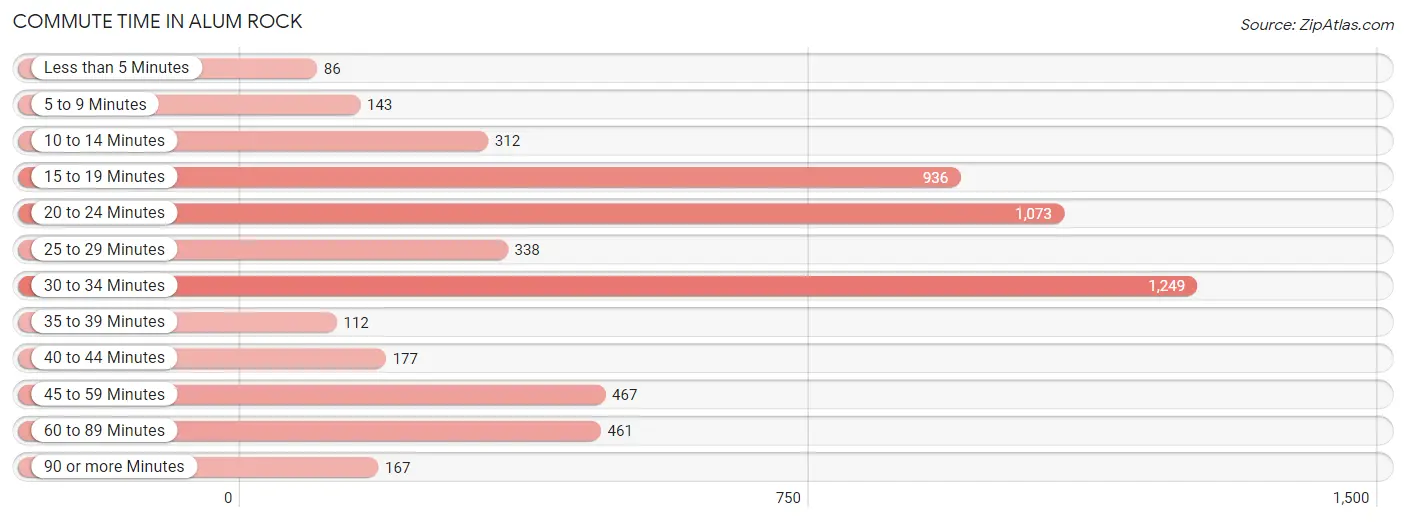
| Commute Time | # Commuters | % Commuters |
| Less than 5 Minutes | 86 | 1.6% |
| 5 to 9 Minutes | 143 | 2.6% |
| 10 to 14 Minutes | 312 | 5.7% |
| 15 to 19 Minutes | 936 | 17.0% |
| 20 to 24 Minutes | 1,073 | 19.4% |
| 25 to 29 Minutes | 338 | 6.1% |
| 30 to 34 Minutes | 1,249 | 22.6% |
| 35 to 39 Minutes | 112 | 2.0% |
| 40 to 44 Minutes | 177 | 3.2% |
| 45 to 59 Minutes | 467 | 8.5% |
| 60 to 89 Minutes | 461 | 8.4% |
| 90 or more Minutes | 167 | 3.0% |
Commute Time by Sex in Alum Rock
The most common commute times in Alum Rock are 15 to 19 minutes (637 commuters, 19.7%) for males and 30 to 34 minutes (614 commuters, 26.9%) for females.
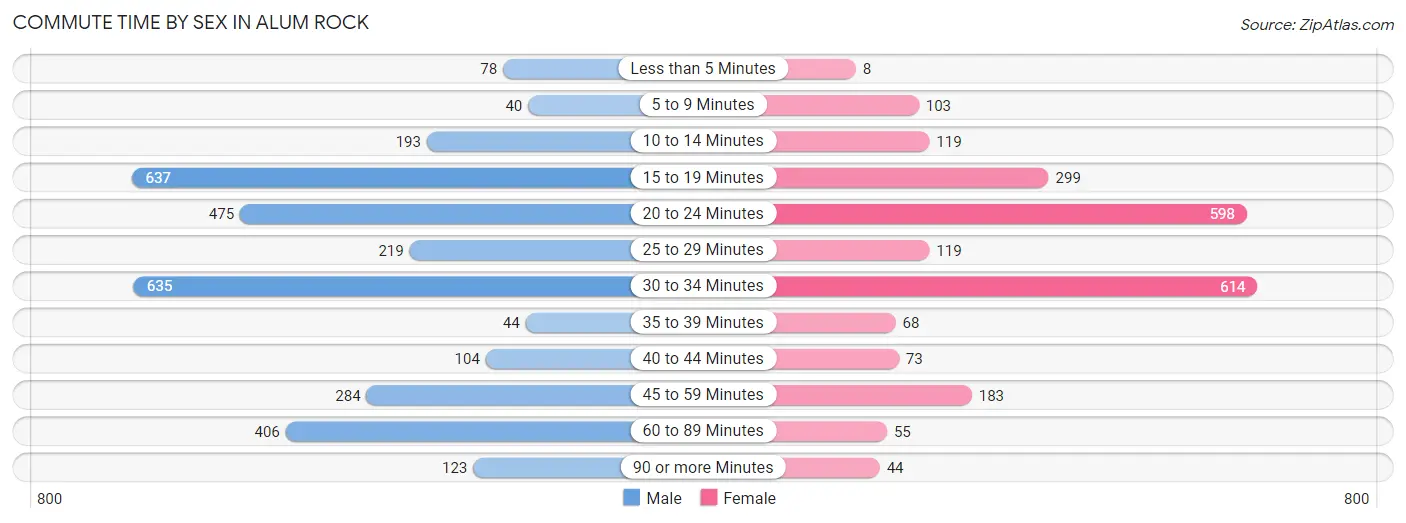
| Commute Time | Male | Female |
| Less than 5 Minutes | 78 (2.4%) | 8 (0.4%) |
| 5 to 9 Minutes | 40 (1.2%) | 103 (4.5%) |
| 10 to 14 Minutes | 193 (6.0%) | 119 (5.2%) |
| 15 to 19 Minutes | 637 (19.7%) | 299 (13.1%) |
| 20 to 24 Minutes | 475 (14.7%) | 598 (26.2%) |
| 25 to 29 Minutes | 219 (6.8%) | 119 (5.2%) |
| 30 to 34 Minutes | 635 (19.6%) | 614 (26.9%) |
| 35 to 39 Minutes | 44 (1.4%) | 68 (3.0%) |
| 40 to 44 Minutes | 104 (3.2%) | 73 (3.2%) |
| 45 to 59 Minutes | 284 (8.8%) | 183 (8.0%) |
| 60 to 89 Minutes | 406 (12.5%) | 55 (2.4%) |
| 90 or more Minutes | 123 (3.8%) | 44 (1.9%) |
Time of Departure to Work by Sex in Alum Rock
The most frequent times of departure to work in Alum Rock are 7:00 AM to 7:29 AM (517, 16.0%) for males and 7:00 AM to 7:29 AM (462, 20.2%) for females.
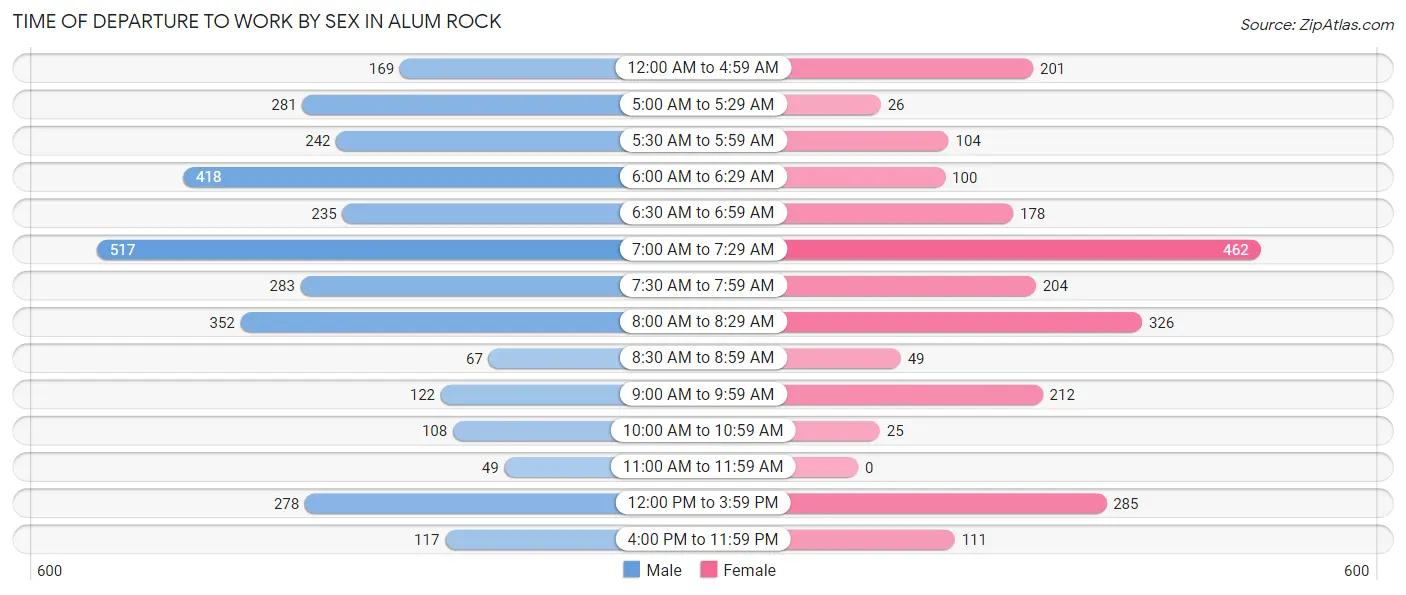
| Time of Departure | Male | Female |
| 12:00 AM to 4:59 AM | 169 (5.2%) | 201 (8.8%) |
| 5:00 AM to 5:29 AM | 281 (8.7%) | 26 (1.1%) |
| 5:30 AM to 5:59 AM | 242 (7.5%) | 104 (4.6%) |
| 6:00 AM to 6:29 AM | 418 (12.9%) | 100 (4.4%) |
| 6:30 AM to 6:59 AM | 235 (7.3%) | 178 (7.8%) |
| 7:00 AM to 7:29 AM | 517 (16.0%) | 462 (20.2%) |
| 7:30 AM to 7:59 AM | 283 (8.7%) | 204 (8.9%) |
| 8:00 AM to 8:29 AM | 352 (10.9%) | 326 (14.3%) |
| 8:30 AM to 8:59 AM | 67 (2.1%) | 49 (2.1%) |
| 9:00 AM to 9:59 AM | 122 (3.8%) | 212 (9.3%) |
| 10:00 AM to 10:59 AM | 108 (3.3%) | 25 (1.1%) |
| 11:00 AM to 11:59 AM | 49 (1.5%) | 0 (0.0%) |
| 12:00 PM to 3:59 PM | 278 (8.6%) | 285 (12.5%) |
| 4:00 PM to 11:59 PM | 117 (3.6%) | 111 (4.9%) |
| Total | 3,238 (100.0%) | 2,283 (100.0%) |
Housing Occupancy in Alum Rock
Occupancy by Ownership in Alum Rock
Of the total 2,774 dwellings in Alum Rock, owner-occupied units account for 1,960 (70.7%), while renter-occupied units make up 814 (29.3%).
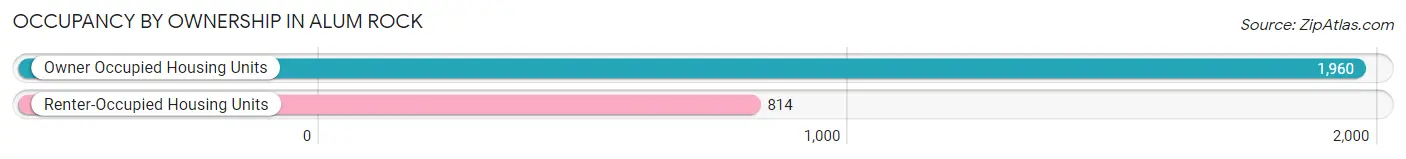
| Occupancy | # Housing Units | % Housing Units |
| Owner Occupied Housing Units | 1,960 | 70.7% |
| Renter-Occupied Housing Units | 814 | 29.3% |
| Total Occupied Housing Units | 2,774 | 100.0% |
Occupancy by Household Size in Alum Rock
| Household Size | # Housing Units | % Housing Units |
| 1-Person Household | 363 | 13.1% |
| 2-Person Household | 541 | 19.5% |
| 3-Person Household | 497 | 17.9% |
| 4+ Person Household | 1,373 | 49.5% |
| Total Housing Units | 2,774 | 100.0% |
Occupancy by Ownership by Household Size in Alum Rock
| Household Size | Owner-occupied | Renter-occupied |
| 1-Person Household | 290 (79.9%) | 73 (20.1%) |
| 2-Person Household | 374 (69.1%) | 167 (30.9%) |
| 3-Person Household | 407 (81.9%) | 90 (18.1%) |
| 4+ Person Household | 889 (64.7%) | 484 (35.2%) |
| Total Housing Units | 1,960 (70.7%) | 814 (29.3%) |
Occupancy by Educational Attainment in Alum Rock
| Household Size | Owner-occupied | Renter-occupied |
| Less than High School | 545 (65.6%) | 286 (34.4%) |
| High School Diploma | 323 (55.3%) | 261 (44.7%) |
| College/Associate Degree | 496 (76.7%) | 151 (23.3%) |
| Bachelor's Degree or higher | 596 (83.7%) | 116 (16.3%) |
Occupancy by Age of Householder in Alum Rock
| Age Bracket | # Households | % Households |
| Under 35 Years | 290 | 10.4% |
| 35 to 44 Years | 687 | 24.8% |
| 45 to 54 Years | 660 | 23.8% |
| 55 to 64 Years | 469 | 16.9% |
| 65 to 74 Years | 357 | 12.9% |
| 75 to 84 Years | 249 | 9.0% |
| 85 Years and Over | 62 | 2.2% |
| Total | 2,774 | 100.0% |
Housing Finances in Alum Rock
Median Income by Occupancy in Alum Rock
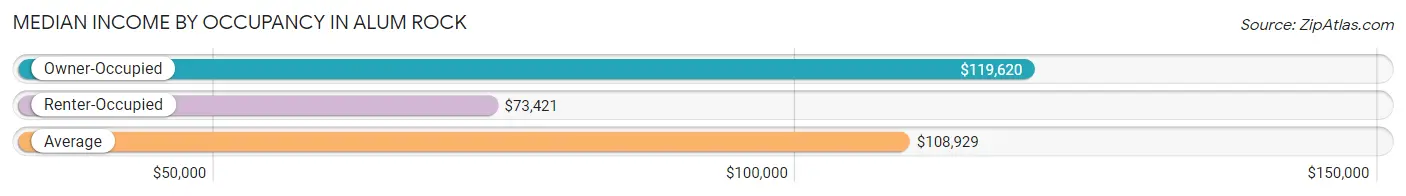
| Occupancy Type | # Households | Median Income |
| Owner-Occupied | 1,960 (70.7%) | $119,620 |
| Renter-Occupied | 814 (29.3%) | $73,421 |
| Average | 2,774 (100.0%) | $108,929 |
Occupancy by Householder Income Bracket in Alum Rock
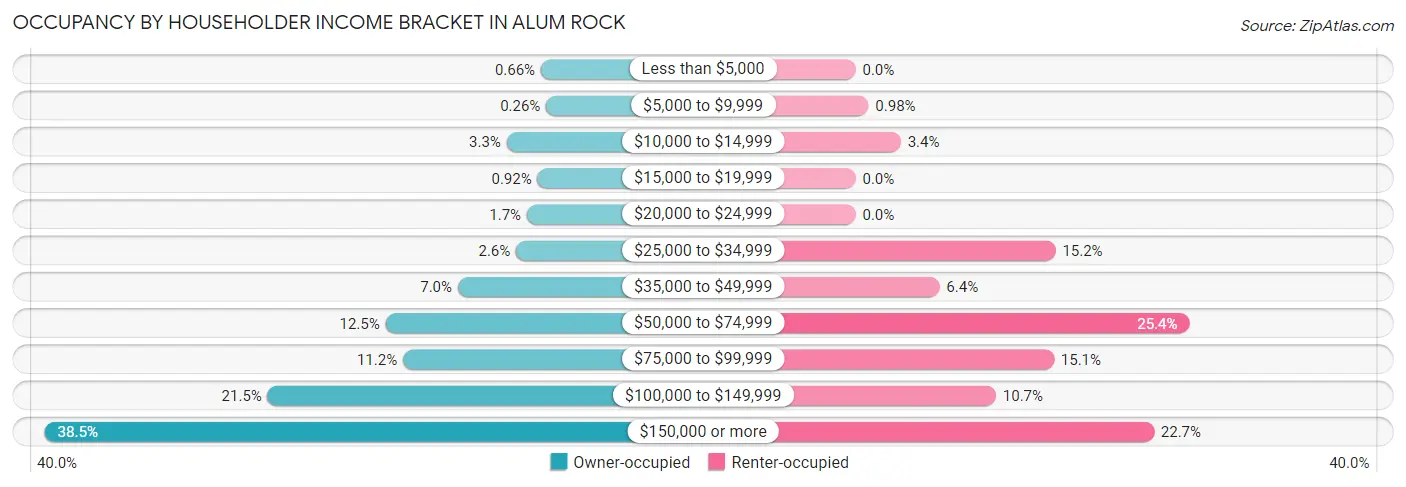
| Income Bracket | Owner-occupied | Renter-occupied |
| Less than $5,000 | 13 (0.7%) | 0 (0.0%) |
| $5,000 to $9,999 | 5 (0.3%) | 8 (1.0%) |
| $10,000 to $14,999 | 64 (3.3%) | 28 (3.4%) |
| $15,000 to $19,999 | 18 (0.9%) | 0 (0.0%) |
| $20,000 to $24,999 | 34 (1.7%) | 0 (0.0%) |
| $25,000 to $34,999 | 50 (2.5%) | 124 (15.2%) |
| $35,000 to $49,999 | 137 (7.0%) | 52 (6.4%) |
| $50,000 to $74,999 | 245 (12.5%) | 207 (25.4%) |
| $75,000 to $99,999 | 219 (11.2%) | 123 (15.1%) |
| $100,000 to $149,999 | 421 (21.5%) | 87 (10.7%) |
| $150,000 or more | 754 (38.5%) | 185 (22.7%) |
| Total | 1,960 (100.0%) | 814 (100.0%) |
Monthly Housing Cost Tiers in Alum Rock
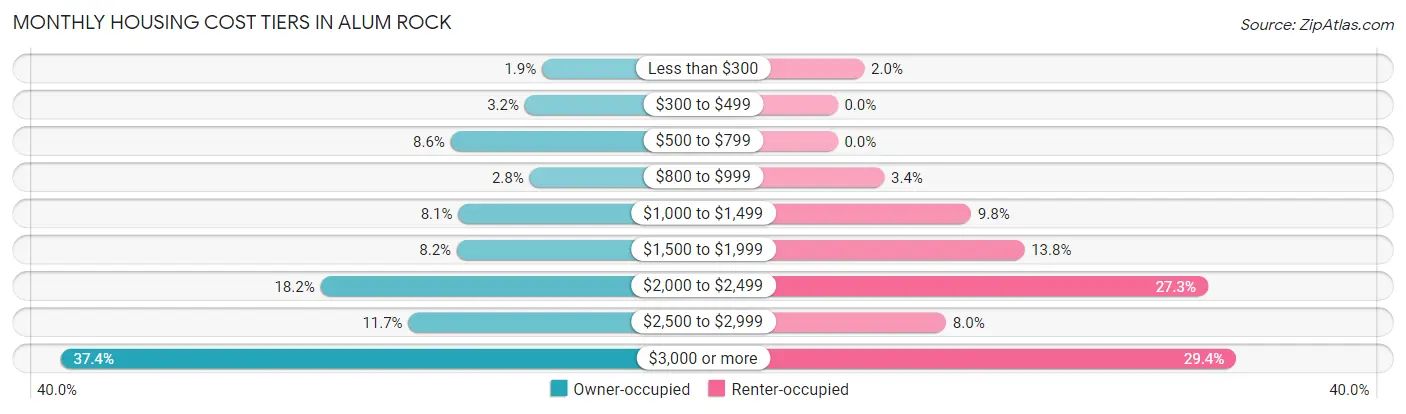
| Monthly Cost | Owner-occupied | Renter-occupied |
| Less than $300 | 37 (1.9%) | 16 (2.0%) |
| $300 to $499 | 62 (3.2%) | 0 (0.0%) |
| $500 to $799 | 169 (8.6%) | 0 (0.0%) |
| $800 to $999 | 55 (2.8%) | 28 (3.4%) |
| $1,000 to $1,499 | 158 (8.1%) | 80 (9.8%) |
| $1,500 to $1,999 | 160 (8.2%) | 112 (13.8%) |
| $2,000 to $2,499 | 357 (18.2%) | 222 (27.3%) |
| $2,500 to $2,999 | 230 (11.7%) | 65 (8.0%) |
| $3,000 or more | 732 (37.3%) | 239 (29.4%) |
| Total | 1,960 (100.0%) | 814 (100.0%) |
Physical Housing Characteristics in Alum Rock
Housing Structures in Alum Rock
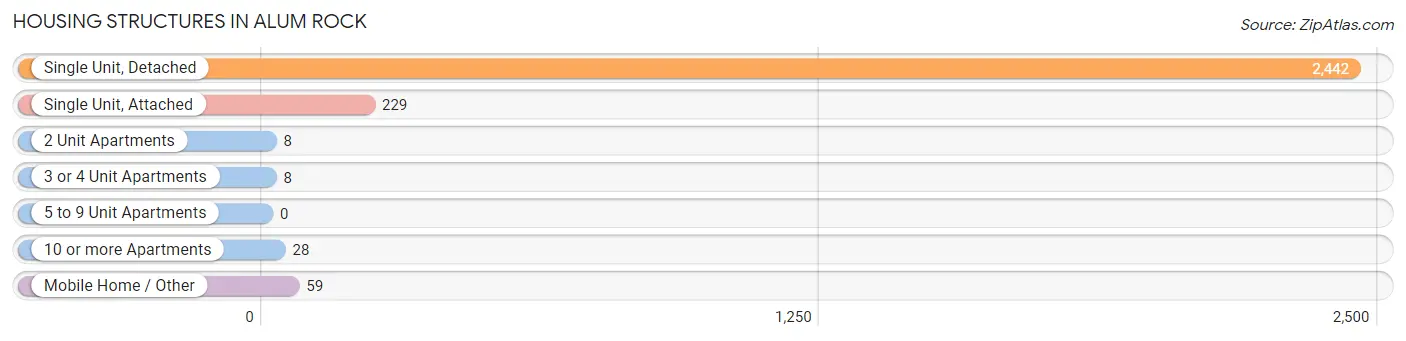
| Structure Type | # Housing Units | % Housing Units |
| Single Unit, Detached | 2,442 | 88.0% |
| Single Unit, Attached | 229 | 8.3% |
| 2 Unit Apartments | 8 | 0.3% |
| 3 or 4 Unit Apartments | 8 | 0.3% |
| 5 to 9 Unit Apartments | 0 | 0.0% |
| 10 or more Apartments | 28 | 1.0% |
| Mobile Home / Other | 59 | 2.1% |
| Total | 2,774 | 100.0% |
Housing Structures by Occupancy in Alum Rock
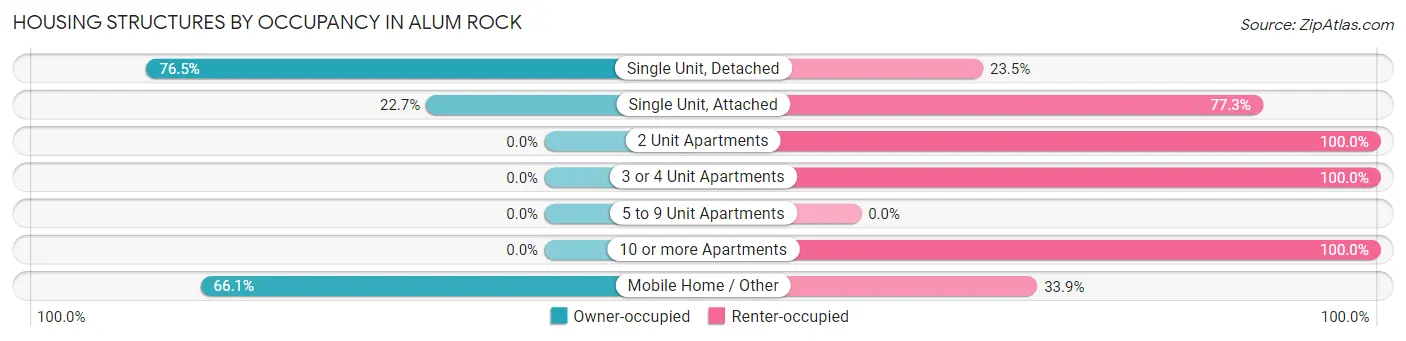
| Structure Type | Owner-occupied | Renter-occupied |
| Single Unit, Detached | 1,869 (76.5%) | 573 (23.5%) |
| Single Unit, Attached | 52 (22.7%) | 177 (77.3%) |
| 2 Unit Apartments | 0 (0.0%) | 8 (100.0%) |
| 3 or 4 Unit Apartments | 0 (0.0%) | 8 (100.0%) |
| 5 to 9 Unit Apartments | 0 (0.0%) | 0 (0.0%) |
| 10 or more Apartments | 0 (0.0%) | 28 (100.0%) |
| Mobile Home / Other | 39 (66.1%) | 20 (33.9%) |
| Total | 1,960 (70.7%) | 814 (29.3%) |
Housing Structures by Number of Rooms in Alum Rock
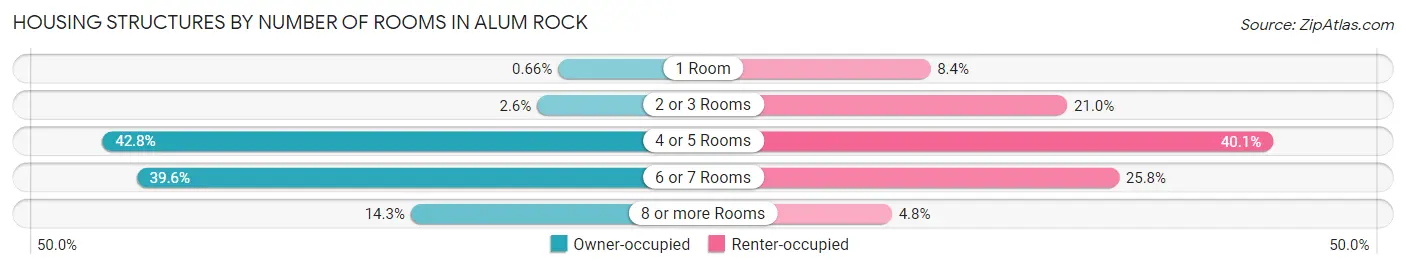
| Number of Rooms | Owner-occupied | Renter-occupied |
| 1 Room | 13 (0.7%) | 68 (8.4%) |
| 2 or 3 Rooms | 51 (2.6%) | 171 (21.0%) |
| 4 or 5 Rooms | 839 (42.8%) | 326 (40.1%) |
| 6 or 7 Rooms | 777 (39.6%) | 210 (25.8%) |
| 8 or more Rooms | 280 (14.3%) | 39 (4.8%) |
| Total | 1,960 (100.0%) | 814 (100.0%) |
Housing Structure by Heating Type in Alum Rock
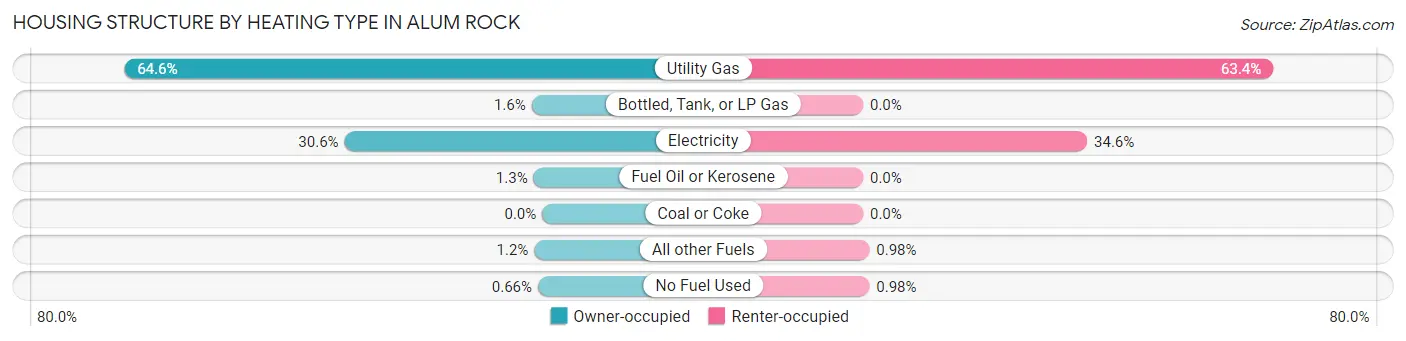
| Heating Type | Owner-occupied | Renter-occupied |
| Utility Gas | 1,266 (64.6%) | 516 (63.4%) |
| Bottled, Tank, or LP Gas | 32 (1.6%) | 0 (0.0%) |
| Electricity | 599 (30.6%) | 282 (34.6%) |
| Fuel Oil or Kerosene | 26 (1.3%) | 0 (0.0%) |
| Coal or Coke | 0 (0.0%) | 0 (0.0%) |
| All other Fuels | 24 (1.2%) | 8 (1.0%) |
| No Fuel Used | 13 (0.7%) | 8 (1.0%) |
| Total | 1,960 (100.0%) | 814 (100.0%) |
Household Vehicle Usage in Alum Rock
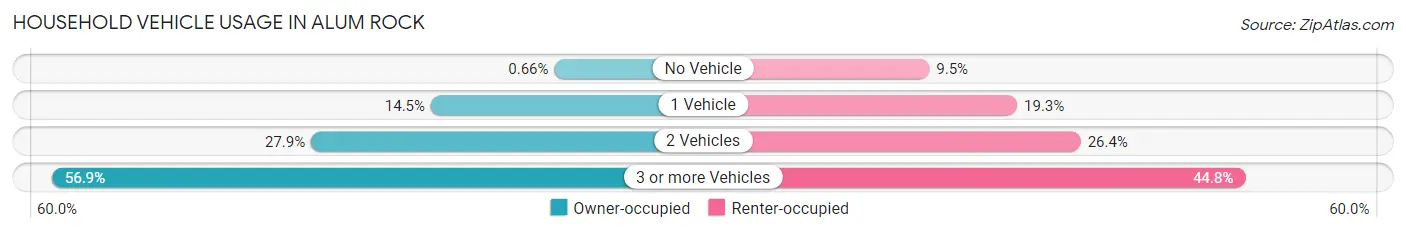
| Vehicles per Household | Owner-occupied | Renter-occupied |
| No Vehicle | 13 (0.7%) | 77 (9.5%) |
| 1 Vehicle | 284 (14.5%) | 157 (19.3%) |
| 2 Vehicles | 547 (27.9%) | 215 (26.4%) |
| 3 or more Vehicles | 1,116 (56.9%) | 365 (44.8%) |
| Total | 1,960 (100.0%) | 814 (100.0%) |
Real Estate & Mortgages in Alum Rock
Real Estate and Mortgage Overview in Alum Rock
| Characteristic | Without Mortgage | With Mortgage |
| Housing Units | 397 | 1,563 |
| Median Property Value | $793,300 | $828,300 |
| Median Household Income | $62,411 | $675 |
| Monthly Housing Costs | $646 | $732 |
| Real Estate Taxes | $3,070 | $30 |
Property Value by Mortgage Status in Alum Rock
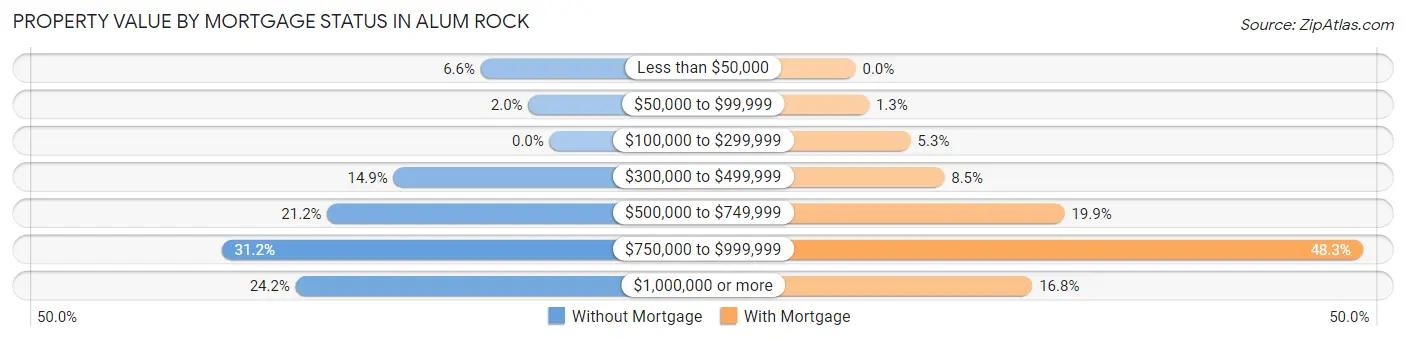
| Property Value | Without Mortgage | With Mortgage |
| Less than $50,000 | 26 (6.6%) | 0 (0.0%) |
| $50,000 to $99,999 | 8 (2.0%) | 20 (1.3%) |
| $100,000 to $299,999 | 0 (0.0%) | 82 (5.2%) |
| $300,000 to $499,999 | 59 (14.9%) | 132 (8.5%) |
| $500,000 to $749,999 | 84 (21.2%) | 311 (19.9%) |
| $750,000 to $999,999 | 124 (31.2%) | 755 (48.3%) |
| $1,000,000 or more | 96 (24.2%) | 263 (16.8%) |
| Total | 397 (100.0%) | 1,563 (100.0%) |
Household Income by Mortgage Status in Alum Rock
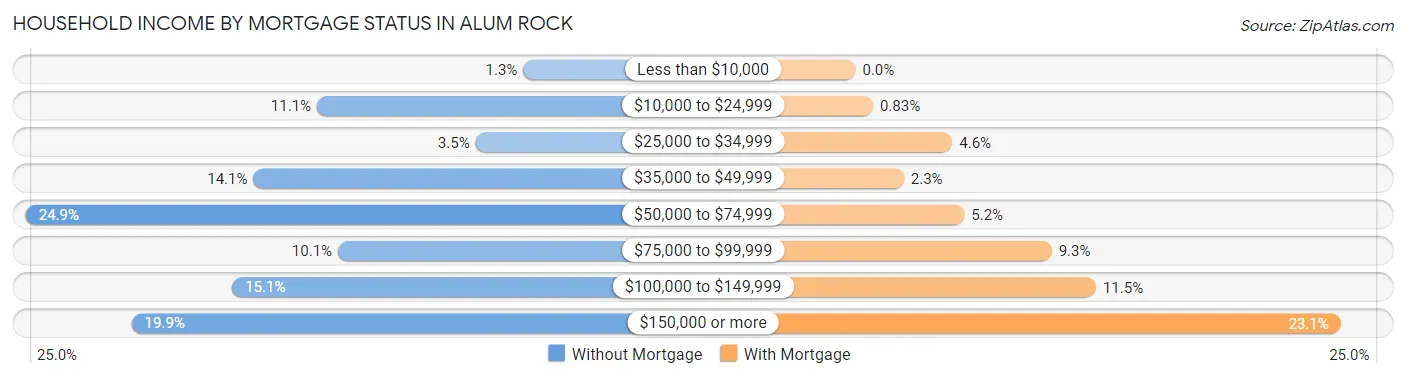
| Household Income | Without Mortgage | With Mortgage |
| Less than $10,000 | 5 (1.3%) | 0 (0.0%) |
| $10,000 to $24,999 | 44 (11.1%) | 13 (0.8%) |
| $25,000 to $34,999 | 14 (3.5%) | 72 (4.6%) |
| $35,000 to $49,999 | 56 (14.1%) | 36 (2.3%) |
| $50,000 to $74,999 | 99 (24.9%) | 81 (5.2%) |
| $75,000 to $99,999 | 40 (10.1%) | 146 (9.3%) |
| $100,000 to $149,999 | 60 (15.1%) | 179 (11.5%) |
| $150,000 or more | 79 (19.9%) | 361 (23.1%) |
| Total | 397 (100.0%) | 1,563 (100.0%) |
Property Value to Household Income Ratio in Alum Rock
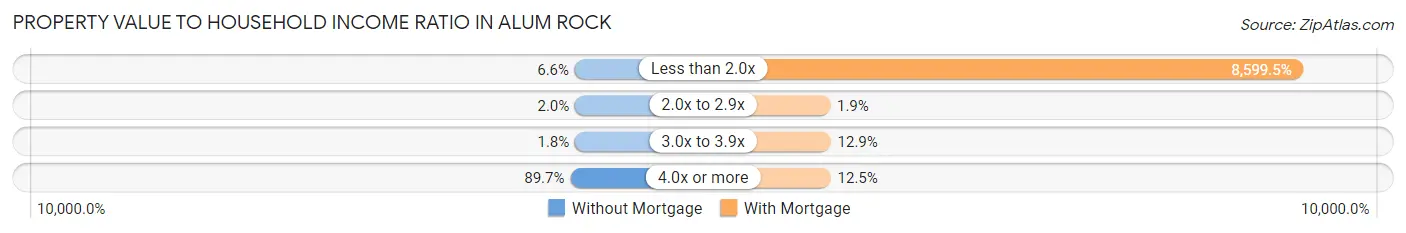
| Value-to-Income Ratio | Without Mortgage | With Mortgage |
| Less than 2.0x | 26 (6.6%) | 134,410 (8,599.5%) |
| 2.0x to 2.9x | 8 (2.0%) | 30 (1.9%) |
| 3.0x to 3.9x | 7 (1.8%) | 201 (12.9%) |
| 4.0x or more | 356 (89.7%) | 195 (12.5%) |
| Total | 397 (100.0%) | 1,563 (100.0%) |
Real Estate Taxes by Mortgage Status in Alum Rock
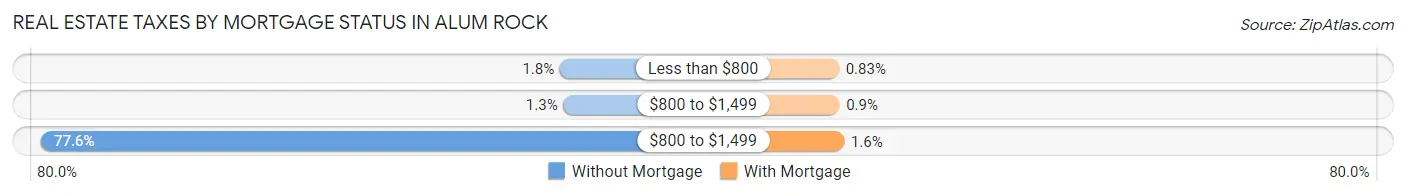
| Property Taxes | Without Mortgage | With Mortgage |
| Less than $800 | 7 (1.8%) | 13 (0.8%) |
| $800 to $1,499 | 5 (1.3%) | 14 (0.9%) |
| $800 to $1,499 | 308 (77.6%) | 25 (1.6%) |
| Total | 397 (100.0%) | 1,563 (100.0%) |
Health & Disability in Alum Rock
Health Insurance Coverage by Age in Alum Rock
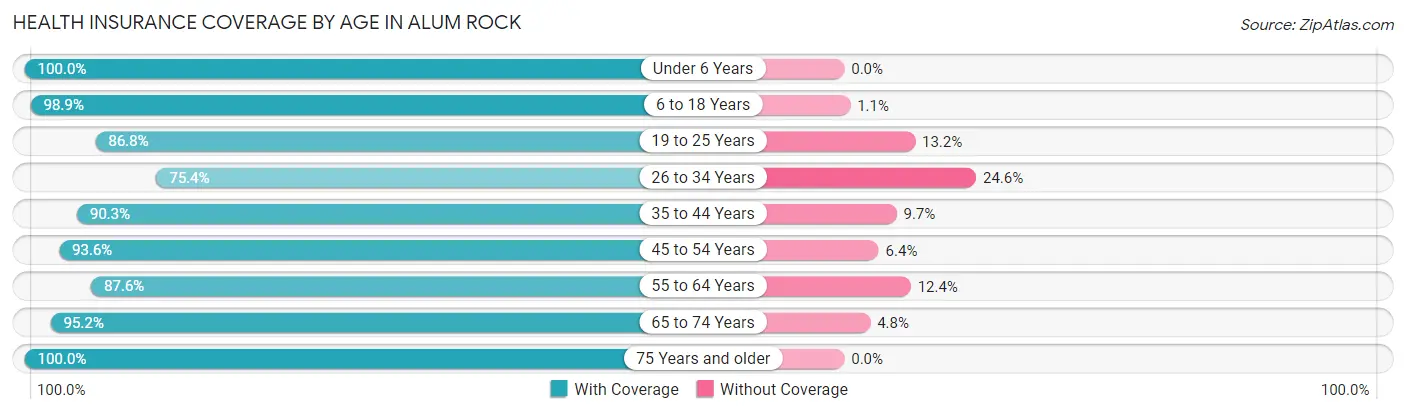
| Age Bracket | With Coverage | Without Coverage |
| Under 6 Years | 1,067 (100.0%) | 0 (0.0%) |
| 6 to 18 Years | 1,613 (98.9%) | 18 (1.1%) |
| 19 to 25 Years | 1,172 (86.8%) | 178 (13.2%) |
| 26 to 34 Years | 1,099 (75.4%) | 358 (24.6%) |
| 35 to 44 Years | 1,464 (90.3%) | 158 (9.7%) |
| 45 to 54 Years | 1,459 (93.6%) | 100 (6.4%) |
| 55 to 64 Years | 998 (87.6%) | 141 (12.4%) |
| 65 to 74 Years | 945 (95.2%) | 48 (4.8%) |
| 75 Years and older | 720 (100.0%) | 0 (0.0%) |
| Total | 10,537 (91.3%) | 1,001 (8.7%) |
Health Insurance Coverage by Citizenship Status in Alum Rock

| Citizenship Status | With Coverage | Without Coverage |
| Native Born | 1,067 (100.0%) | 0 (0.0%) |
| Foreign Born, Citizen | 1,613 (98.9%) | 18 (1.1%) |
| Foreign Born, not a Citizen | 1,172 (86.8%) | 178 (13.2%) |
Health Insurance Coverage by Household Income in Alum Rock
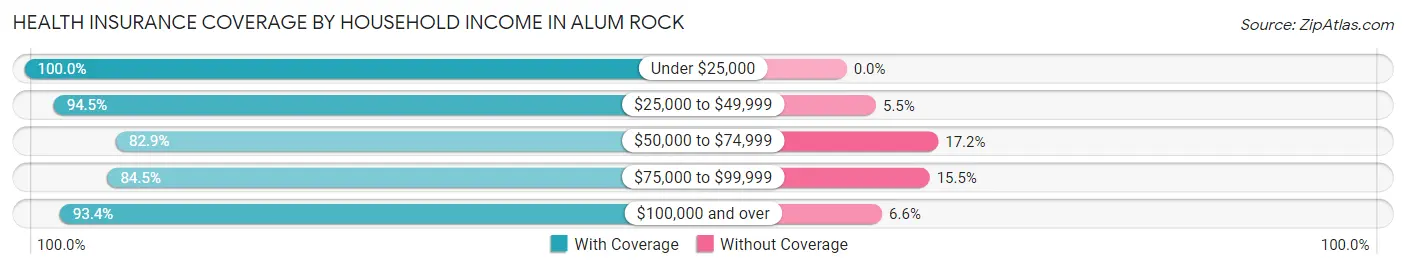
| Household Income | With Coverage | Without Coverage |
| Under $25,000 | 305 (100.0%) | 0 (0.0%) |
| $25,000 to $49,999 | 1,070 (94.5%) | 62 (5.5%) |
| $50,000 to $74,999 | 1,541 (82.9%) | 319 (17.2%) |
| $75,000 to $99,999 | 821 (84.5%) | 151 (15.5%) |
| $100,000 and over | 6,613 (93.4%) | 469 (6.6%) |
Public vs Private Health Insurance Coverage by Age in Alum Rock
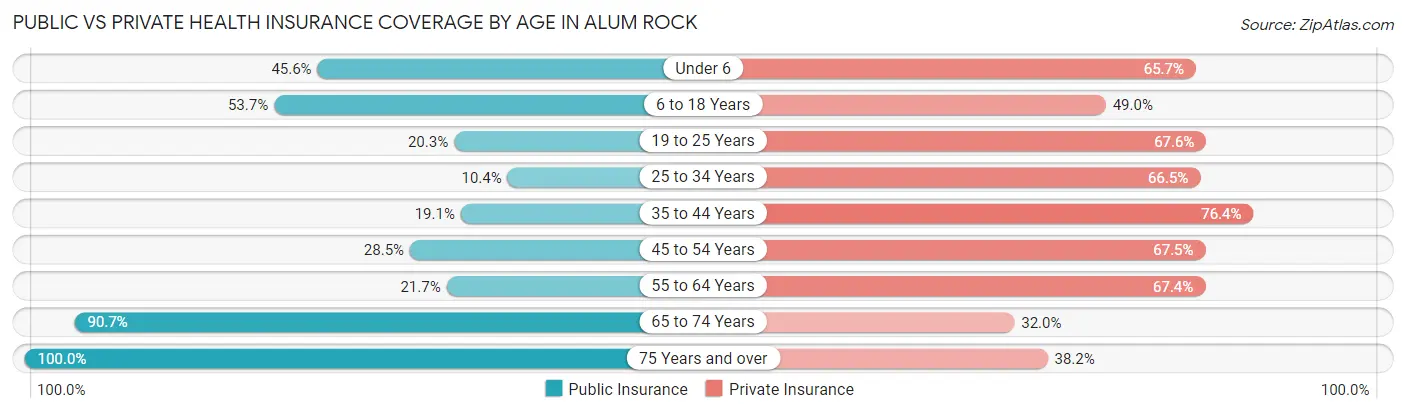
| Age Bracket | Public Insurance | Private Insurance |
| Under 6 | 487 (45.6%) | 701 (65.7%) |
| 6 to 18 Years | 876 (53.7%) | 799 (49.0%) |
| 19 to 25 Years | 274 (20.3%) | 913 (67.6%) |
| 25 to 34 Years | 151 (10.4%) | 969 (66.5%) |
| 35 to 44 Years | 309 (19.1%) | 1,239 (76.4%) |
| 45 to 54 Years | 444 (28.5%) | 1,052 (67.5%) |
| 55 to 64 Years | 247 (21.7%) | 768 (67.4%) |
| 65 to 74 Years | 901 (90.7%) | 318 (32.0%) |
| 75 Years and over | 720 (100.0%) | 275 (38.2%) |
| Total | 4,409 (38.2%) | 7,034 (61.0%) |
Disability Status by Sex by Age in Alum Rock
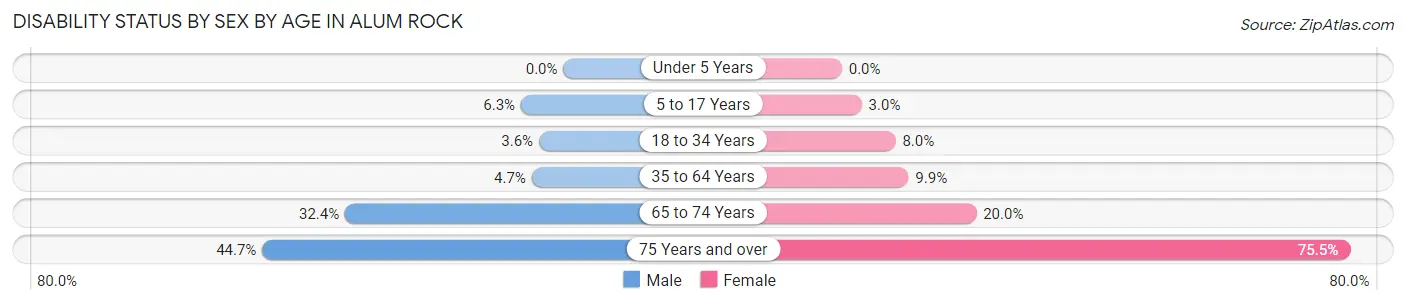
| Age Bracket | Male | Female |
| Under 5 Years | 0 (0.0%) | 0 (0.0%) |
| 5 to 17 Years | 51 (6.3%) | 31 (2.9%) |
| 18 to 34 Years | 54 (3.6%) | 113 (8.0%) |
| 35 to 64 Years | 106 (4.7%) | 204 (9.9%) |
| 65 to 74 Years | 166 (32.4%) | 96 (20.0%) |
| 75 Years and over | 127 (44.7%) | 329 (75.5%) |
Disability Class by Sex by Age in Alum Rock
Disability Class: Hearing Difficulty
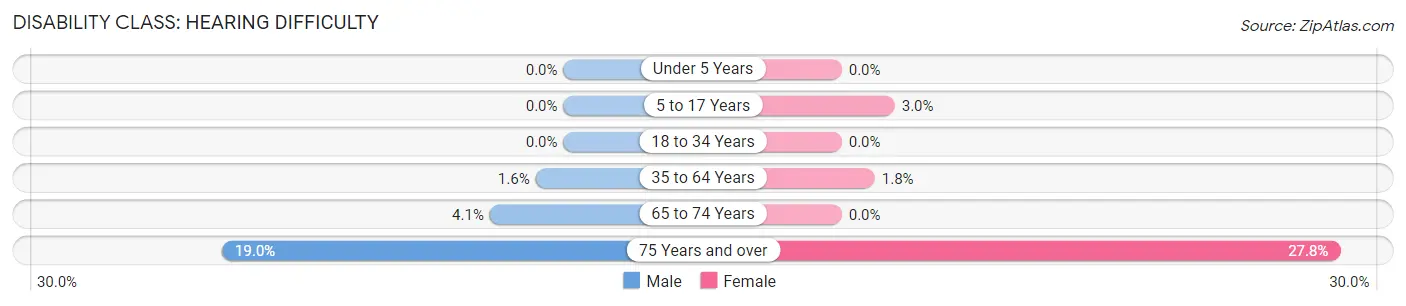
| Age Bracket | Male | Female |
| Under 5 Years | 0 (0.0%) | 0 (0.0%) |
| 5 to 17 Years | 0 (0.0%) | 31 (2.9%) |
| 18 to 34 Years | 0 (0.0%) | 0 (0.0%) |
| 35 to 64 Years | 35 (1.5%) | 38 (1.8%) |
| 65 to 74 Years | 21 (4.1%) | 0 (0.0%) |
| 75 Years and over | 54 (19.0%) | 121 (27.8%) |
Disability Class: Vision Difficulty
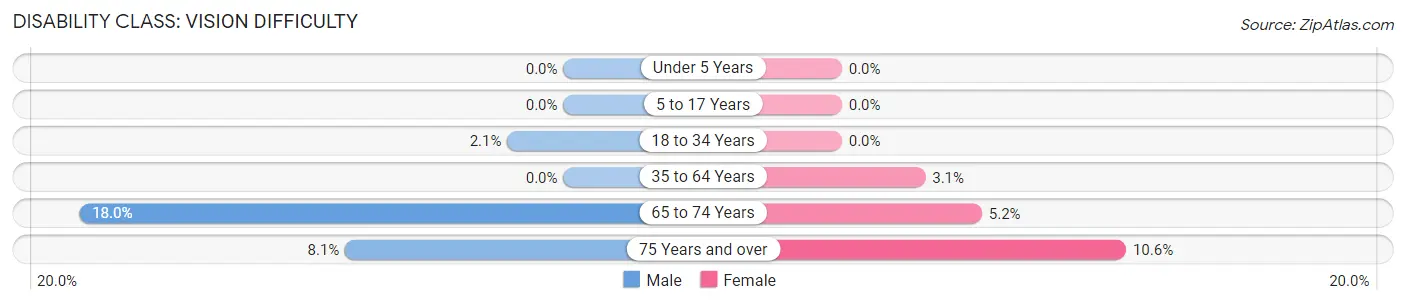
| Age Bracket | Male | Female |
| Under 5 Years | 0 (0.0%) | 0 (0.0%) |
| 5 to 17 Years | 0 (0.0%) | 0 (0.0%) |
| 18 to 34 Years | 31 (2.1%) | 0 (0.0%) |
| 35 to 64 Years | 0 (0.0%) | 64 (3.1%) |
| 65 to 74 Years | 92 (18.0%) | 25 (5.2%) |
| 75 Years and over | 23 (8.1%) | 46 (10.5%) |
Disability Class: Cognitive Difficulty
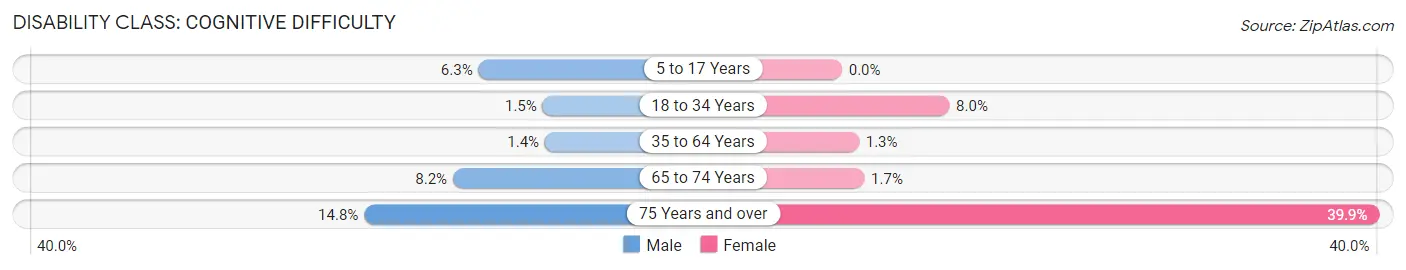
| Age Bracket | Male | Female |
| 5 to 17 Years | 51 (6.3%) | 0 (0.0%) |
| 18 to 34 Years | 23 (1.5%) | 113 (8.0%) |
| 35 to 64 Years | 31 (1.4%) | 26 (1.3%) |
| 65 to 74 Years | 42 (8.2%) | 8 (1.7%) |
| 75 Years and over | 42 (14.8%) | 174 (39.9%) |
Disability Class: Ambulatory Difficulty
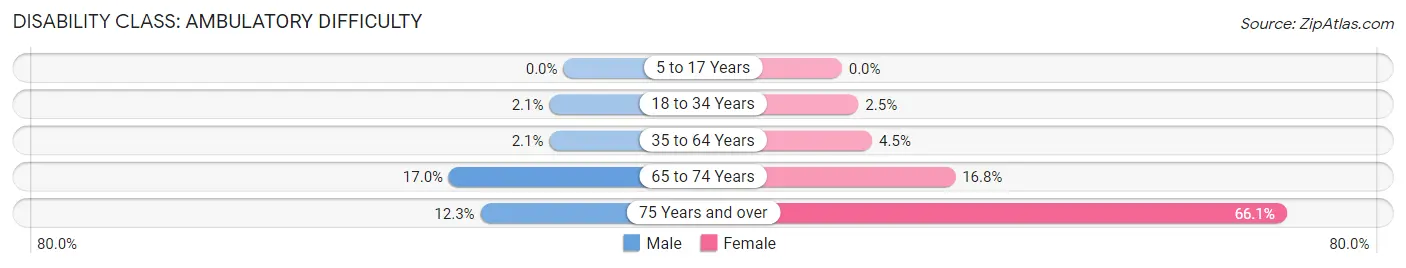
| Age Bracket | Male | Female |
| 5 to 17 Years | 0 (0.0%) | 0 (0.0%) |
| 18 to 34 Years | 31 (2.1%) | 35 (2.5%) |
| 35 to 64 Years | 47 (2.1%) | 93 (4.5%) |
| 65 to 74 Years | 87 (17.0%) | 81 (16.8%) |
| 75 Years and over | 35 (12.3%) | 288 (66.1%) |
Disability Class: Self-Care Difficulty
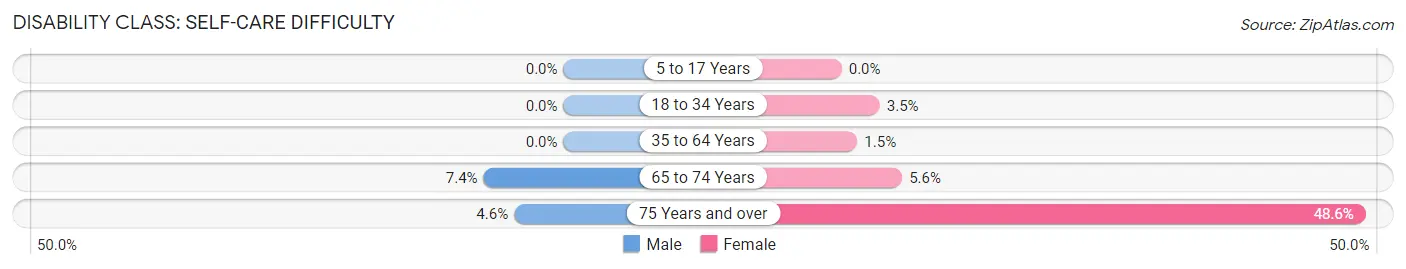
| Age Bracket | Male | Female |
| 5 to 17 Years | 0 (0.0%) | 0 (0.0%) |
| 18 to 34 Years | 0 (0.0%) | 50 (3.5%) |
| 35 to 64 Years | 0 (0.0%) | 30 (1.5%) |
| 65 to 74 Years | 38 (7.4%) | 27 (5.6%) |
| 75 Years and over | 13 (4.6%) | 212 (48.6%) |
Technology Access in Alum Rock
Computing Device Access in Alum Rock
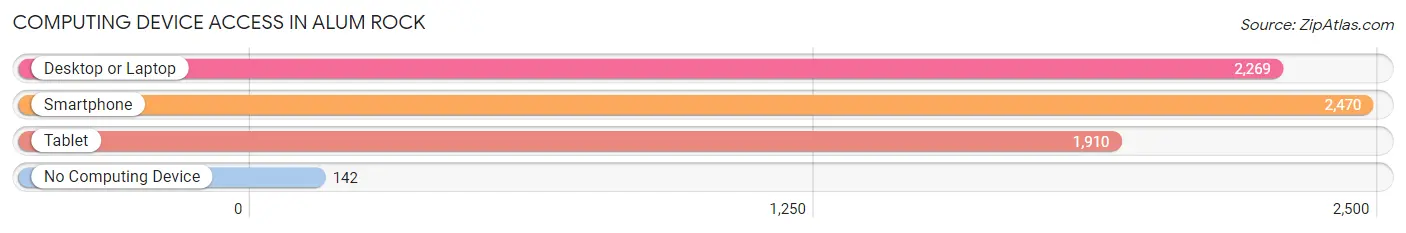
| Device Type | # Households | % Households |
| Desktop or Laptop | 2,269 | 81.8% |
| Smartphone | 2,470 | 89.0% |
| Tablet | 1,910 | 68.9% |
| No Computing Device | 142 | 5.1% |
| Total | 2,774 | 100.0% |
Internet Access in Alum Rock
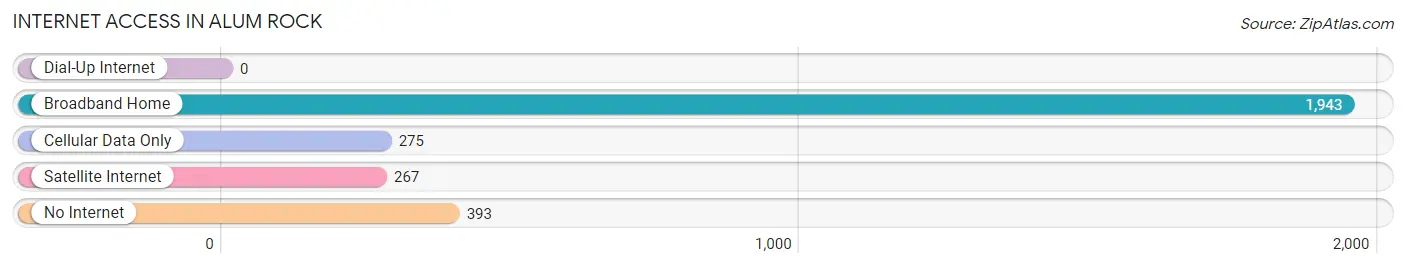
| Internet Type | # Households | % Households |
| Dial-Up Internet | 0 | 0.0% |
| Broadband Home | 1,943 | 70.0% |
| Cellular Data Only | 275 | 9.9% |
| Satellite Internet | 267 | 9.6% |
| No Internet | 393 | 14.2% |
| Total | 2,774 | 100.0% |
Alum Rock Summary
Alum Rock is a census-designated place (CDP) located in Santa Clara County, California, United States. It is situated in the foothills of the Santa Cruz Mountains, approximately 8 miles east of downtown San Jose. As of the 2010 census, the population of Alum Rock was 15,536.
History
The area now known as Alum Rock was originally inhabited by the Ohlone people, who were the first inhabitants of the San Francisco Bay Area. The Ohlone people lived in the area for thousands of years, and were known for their basket-weaving and fishing skills.
In the late 1700s, Spanish explorers arrived in the area and began to settle the land. The area was eventually named after the Alum Rock, a large rock formation located in the area. The rock was used by the Spanish to make alum, a type of salt used in tanning leather.
In the mid-1800s, the area was settled by American settlers, who established farms and ranches in the area. The area was also home to a number of Chinese immigrants, who worked in the area’s mines and on the farms.
In the late 1800s, the area was annexed by the city of San Jose. The area was then developed into a residential neighborhood, and the first homes were built in the area in the early 1900s.
Geography
Alum Rock is located at 37°19'25"N 121°51'17"W (37.323607, -121.854722). It is situated in the foothills of the Santa Cruz Mountains, approximately 8 miles east of downtown San Jose. The area is bordered by the cities of San Jose and Milpitas to the west, and the city of Santa Clara to the south.
The area has a total area of 2.2 square miles, all of which is land. The terrain is mostly flat, with some rolling hills. The area is home to a number of creeks and streams, including Alum Rock Creek, which flows through the area.
Economy
The economy of Alum Rock is largely based on the service industry. The area is home to a number of restaurants, retail stores, and other businesses. The area is also home to a number of light industrial businesses, including a number of technology companies.
The area is also home to a number of educational institutions, including the Alum Rock Union School District, which serves the area’s public schools. The area is also home to a number of private schools, including the Alum Rock Christian School.
Demographics
As of the 2010 census, the population of Alum Rock was 15,536. The population is largely Hispanic, with a large percentage of the population being of Mexican descent. The median age of the population is 33.7 years, and the median household income is $60,945.
Conclusion
Alum Rock is a census-designated place located in Santa Clara County, California. It is situated in the foothills of the Santa Cruz Mountains, approximately 8 miles east of downtown San Jose. The area was originally inhabited by the Ohlone people, and was later settled by Spanish explorers and American settlers. The economy of Alum Rock is largely based on the service industry, and the population is largely Hispanic.
Common Questions
What is Per Capita Income in Alum Rock?
Per Capita income in Alum Rock is $31,891.
What is the Median Family Income in Alum Rock?
Median Family Income in Alum Rock is $109,107.
What is the Median Household income in Alum Rock?
Median Household Income in Alum Rock is $108,929.
What is Income or Wage Gap in Alum Rock?
Income or Wage Gap in Alum Rock is 28.1%.
Women in Alum Rock earn 71.9 cents for every dollar earned by a man.
What is Inequality or Gini Index in Alum Rock?
Inequality or Gini Index in Alum Rock is 0.39.
What is the Total Population of Alum Rock?
Total Population of Alum Rock is 11,831.
What is the Total Male Population of Alum Rock?
Total Male Population of Alum Rock is 5,900.
What is the Total Female Population of Alum Rock?
Total Female Population of Alum Rock is 5,931.
What is the Ratio of Males per 100 Females in Alum Rock?
There are 99.48 Males per 100 Females in Alum Rock.
What is the Ratio of Females per 100 Males in Alum Rock?
There are 100.53 Females per 100 Males in Alum Rock.
What is the Median Population Age in Alum Rock?
Median Population Age in Alum Rock is 38.0 Years.
What is the Average Family Size in Alum Rock
Average Family Size in Alum Rock is 4.2 People.
What is the Average Household Size in Alum Rock
Average Household Size in Alum Rock is 4.1 People.
How Large is the Labor Force in Alum Rock?
There are 6,178 People in the Labor Forcein in Alum Rock.
What is the Percentage of People in the Labor Force in Alum Rock?
65.6% of People are in the Labor Force in Alum Rock.
What is the Unemployment Rate in Alum Rock?
Unemployment Rate in Alum Rock is 5.3%.