Cities with the Highest Percentage of Population with a Degree in Engineering in Vermont
RELATED REPORTS & OPTIONS
Engineering
Vermont
Compare Cities
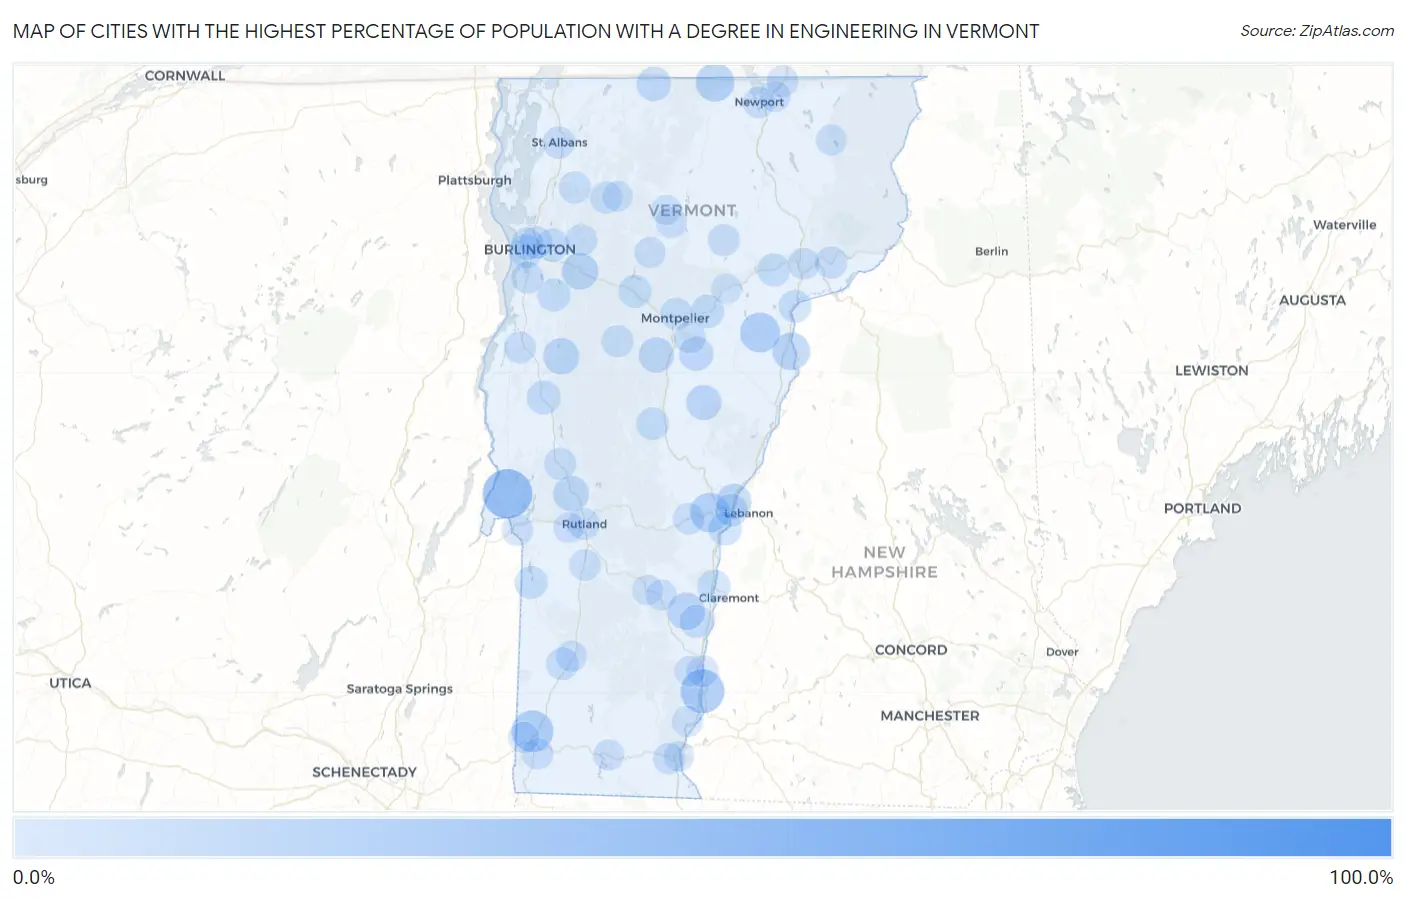
Map of Cities with the Highest Percentage of Population with a Degree in Engineering in Vermont
0.0%
100.0%
Cities with the Highest Percentage of Population with a Degree in Engineering in Vermont
| City | % Graduates | vs State | vs National | |
| 1. | Pownal | 100.0% | 5.3%(+94.7)#1 | 7.6%(+92.4)#7 |
| 2. | Benson | 40.0% | 5.3%(+34.7)#2 | 7.6%(+32.4)#266 |
| 3. | South Londonderry | 28.6% | 5.3%(+23.3)#3 | 7.6%(+20.9)#492 |
| 4. | Westminster | 28.3% | 5.3%(+23.0)#4 | 7.6%(+20.7)#511 |
| 5. | West Charlotte | 25.0% | 5.3%(+19.7)#5 | 7.6%(+17.4)#656 |
| 6. | South Shaftsbury | 23.8% | 5.3%(+18.5)#6 | 7.6%(+16.2)#732 |
| 7. | Groton | 20.0% | 5.3%(+14.7)#7 | 7.6%(+12.4)#1,036 |
| 8. | Quechee | 19.3% | 5.3%(+14.0)#8 | 7.6%(+11.6)#1,135 |
| 9. | Pawlet | 18.8% | 5.3%(+13.5)#9 | 7.6%(+11.2)#1,185 |
| 10. | North Troy | 17.0% | 5.3%(+11.7)#10 | 7.6%(+9.40)#1,436 |
| 11. | Hanksville | 15.8% | 5.3%(+10.5)#11 | 7.6%(+8.14)#1,712 |
| 12. | Bakersfield | 15.6% | 5.3%(+10.3)#12 | 7.6%(+7.98)#1,750 |
| 13. | Hartford | 15.0% | 5.3%(+9.75)#13 | 7.6%(+7.40)#1,863 |
| 14. | Wells River | 15.0% | 5.3%(+9.70)#14 | 7.6%(+7.35)#1,876 |
| 15. | North Springfield | 14.5% | 5.3%(+9.25)#15 | 7.6%(+6.90)#1,971 |
| 16. | West Woodstock | 13.8% | 5.3%(+8.47)#16 | 7.6%(+6.12)#2,228 |
| 17. | Richmond | 13.2% | 5.3%(+7.95)#17 | 7.6%(+5.59)#2,397 |
| 18. | Killington | 13.1% | 5.3%(+7.84)#18 | 7.6%(+5.49)#2,433 |
| 19. | Bristol | 12.5% | 5.3%(+7.18)#19 | 7.6%(+4.83)#2,714 |
| 20. | Townshend | 12.2% | 5.3%(+6.87)#20 | 7.6%(+4.51)#2,824 |
| 21. | Pittsford | 11.1% | 5.3%(+5.81)#21 | 7.6%(+3.46)#3,329 |
| 22. | Northfield | 10.4% | 5.3%(+5.11)#22 | 7.6%(+2.76)#3,786 |
| 23. | Chelsea | 10.3% | 5.3%(+5.05)#23 | 7.6%(+2.70)#3,831 |
| 24. | Wilder | 10.3% | 5.3%(+5.01)#24 | 7.6%(+2.65)#3,868 |
| 25. | Pownal Center | 10.2% | 5.3%(+4.94)#25 | 7.6%(+2.59)#3,913 |
| 26. | Gilman | 10.0% | 5.3%(+4.70)#26 | 7.6%(+2.35)#4,093 |
| 27. | Chittenden | 10.0% | 5.3%(+4.70)#27 | 7.6%(+2.35)#4,097 |
| 28. | Peacham | 9.9% | 5.3%(+4.56)#28 | 7.6%(+2.21)#4,208 |
| 29. | Stamford | 9.8% | 5.3%(+4.49)#29 | 7.6%(+2.14)#4,260 |
| 30. | South Lincoln | 9.4% | 5.3%(+4.14)#30 | 7.6%(+1.79)#4,527 |
| 31. | Huntington | 9.4% | 5.3%(+4.11)#31 | 7.6%(+1.76)#4,543 |
| 32. | Richford | 8.7% | 5.3%(+3.42)#32 | 7.6%(+1.07)#5,181 |
| 33. | Graniteville | 8.7% | 5.3%(+3.40)#33 | 7.6%(+1.05)#5,211 |
| 34. | East Dorset | 7.8% | 5.3%(+2.46)#34 | 7.6%(+0.111)#6,263 |
| 35. | Middlebury | 7.7% | 5.3%(+2.40)#35 | 7.6%(+0.051)#6,324 |
| 36. | South Burlington | 7.2% | 5.3%(+1.88)#36 | 7.6%(-0.472)#7,016 |
| 37. | Plainfield | 6.6% | 5.3%(+1.30)#37 | 7.6%(-1.05)#7,859 |
| 38. | North Hartland | 6.6% | 5.3%(+1.26)#38 | 7.6%(-1.09)#7,904 |
| 39. | Hinesburg | 6.4% | 5.3%(+1.11)#39 | 7.6%(-1.24)#8,137 |
| 40. | Springfield | 6.2% | 5.3%(+0.936)#40 | 7.6%(-1.42)#8,445 |
| 41. | Waterbury | 6.2% | 5.3%(+0.904)#41 | 7.6%(-1.45)#8,491 |
| 42. | Essex Junction | 6.1% | 5.3%(+0.769)#42 | 7.6%(-1.58)#8,727 |
| 43. | Ascutney | 6.0% | 5.3%(+0.704)#43 | 7.6%(-1.65)#8,839 |
| 44. | South Hero | 6.0% | 5.3%(+0.704)#44 | 7.6%(-1.65)#8,841 |
| 45. | Wells | 5.9% | 5.3%(+0.586)#45 | 7.6%(-1.77)#9,033 |
| 46. | Castleton Four Corners | 5.8% | 5.3%(+0.493)#46 | 7.6%(-1.86)#9,167 |
| 47. | Danville | 5.6% | 5.3%(+0.353)#47 | 7.6%(-2.00)#9,422 |
| 48. | Randolph | 5.6% | 5.3%(+0.308)#48 | 7.6%(-2.04)#9,487 |
| 49. | White River Junction | 5.5% | 5.3%(+0.242)#49 | 7.6%(-2.11)#9,602 |
| 50. | Manchester | 5.3% | 5.3%(-0.017)#50 | 7.6%(-2.37)#10,046 |
| 51. | Barnet | 5.0% | 5.3%(-0.296)#51 | 7.6%(-2.65)#10,556 |
| 52. | Winooski | 4.8% | 5.3%(-0.521)#52 | 7.6%(-2.87)#10,952 |
| 53. | Cambridge | 4.8% | 5.3%(-0.534)#53 | 7.6%(-2.89)#10,993 |
| 54. | Burlington | 4.7% | 5.3%(-0.643)#54 | 7.6%(-2.99)#11,144 |
| 55. | Concord | 4.7% | 5.3%(-0.645)#55 | 7.6%(-3.00)#11,165 |
| 56. | St Albans | 4.6% | 5.3%(-0.713)#56 | 7.6%(-3.06)#11,276 |
| 57. | Middletown Springs | 4.5% | 5.3%(-0.751)#57 | 7.6%(-3.10)#11,366 |
| 58. | St. George | 4.4% | 5.3%(-0.852)#58 | 7.6%(-3.20)#11,524 |
| 59. | Fairfax | 4.4% | 5.3%(-0.868)#59 | 7.6%(-3.22)#11,555 |
| 60. | Westford | 4.3% | 5.3%(-0.948)#60 | 7.6%(-3.30)#11,713 |
| 61. | Hardwick | 4.3% | 5.3%(-1.03)#61 | 7.6%(-3.38)#11,823 |
| 62. | Montpelier | 4.3% | 5.3%(-1.04)#62 | 7.6%(-3.39)#11,837 |
| 63. | Waitsfield | 4.2% | 5.3%(-1.10)#63 | 7.6%(-3.46)#11,964 |
| 64. | Brandon | 4.2% | 5.3%(-1.11)#64 | 7.6%(-3.46)#11,974 |
| 65. | Rutland | 4.1% | 5.3%(-1.20)#65 | 7.6%(-3.55)#12,152 |
| 66. | Shelburne | 4.1% | 5.3%(-1.22)#66 | 7.6%(-3.57)#12,176 |
| 67. | Jericho | 3.9% | 5.3%(-1.43)#67 | 7.6%(-3.78)#12,522 |
| 68. | Barre | 3.8% | 5.3%(-1.52)#68 | 7.6%(-3.87)#12,693 |
| 69. | Vergennes | 3.6% | 5.3%(-1.70)#69 | 7.6%(-4.05)#13,046 |
| 70. | Proctor | 3.4% | 5.3%(-1.85)#70 | 7.6%(-4.20)#13,299 |
| 71. | Lincoln | 3.4% | 5.3%(-1.85)#71 | 7.6%(-4.20)#13,314 |
| 72. | Bellows Falls | 3.4% | 5.3%(-1.86)#72 | 7.6%(-4.22)#13,334 |
| 73. | Woodstock | 3.4% | 5.3%(-1.94)#73 | 7.6%(-4.29)#13,466 |
| 74. | Derby Line | 3.2% | 5.3%(-2.06)#74 | 7.6%(-4.41)#13,646 |
| 75. | St Johnsbury | 3.2% | 5.3%(-2.07)#75 | 7.6%(-4.42)#13,692 |
| 76. | Newport | 3.2% | 5.3%(-2.13)#76 | 7.6%(-4.48)#13,783 |
| 77. | Wallingford | 3.0% | 5.3%(-2.29)#77 | 7.6%(-4.64)#14,059 |
| 78. | Bennington | 2.9% | 5.3%(-2.36)#78 | 7.6%(-4.71)#14,203 |
| 79. | West Brattleboro | 2.8% | 5.3%(-2.45)#79 | 7.6%(-4.80)#14,359 |
| 80. | Fair Haven | 2.8% | 5.3%(-2.53)#80 | 7.6%(-4.88)#14,471 |
| 81. | Bolton Valley | 2.5% | 5.3%(-2.80)#81 | 7.6%(-5.15)#14,914 |
| 82. | Morrisville | 2.4% | 5.3%(-2.89)#82 | 7.6%(-5.24)#15,038 |
| 83. | North Bennington | 2.3% | 5.3%(-3.03)#83 | 7.6%(-5.38)#15,256 |
| 84. | Putney | 2.1% | 5.3%(-3.20)#84 | 7.6%(-5.55)#15,522 |
| 85. | Manchester Center | 2.1% | 5.3%(-3.23)#85 | 7.6%(-5.58)#15,574 |
| 86. | Stowe | 2.0% | 5.3%(-3.29)#86 | 7.6%(-5.64)#15,666 |
| 87. | Wilmington | 2.0% | 5.3%(-3.30)#87 | 7.6%(-5.65)#15,686 |
| 88. | Proctorsville | 2.0% | 5.3%(-3.34)#88 | 7.6%(-5.69)#15,746 |
| 89. | Derby Center | 1.9% | 5.3%(-3.44)#89 | 7.6%(-5.80)#15,921 |
| 90. | Island Pond | 1.7% | 5.3%(-3.61)#90 | 7.6%(-5.96)#16,151 |
| 91. | West Rutland | 1.6% | 5.3%(-3.68)#91 | 7.6%(-6.03)#16,241 |
| 92. | Saxtons River | 1.5% | 5.3%(-3.77)#92 | 7.6%(-6.12)#16,375 |
| 93. | Jeffersonville | 1.5% | 5.3%(-3.84)#93 | 7.6%(-6.19)#16,473 |
| 94. | Marshfield | 0.88% | 5.3%(-4.41)#94 | 7.6%(-6.76)#17,103 |
| 95. | Ludlow | 0.88% | 5.3%(-4.42)#95 | 7.6%(-6.77)#17,105 |
| 96. | Brattleboro | 0.84% | 5.3%(-4.45)#96 | 7.6%(-6.80)#17,142 |
| 97. | Hyde Park | 0.67% | 5.3%(-4.63)#97 | 7.6%(-6.98)#17,259 |
1
2Common Questions
What are the Top 10 Cities with the Highest Percentage of Population with a Degree in Engineering in Vermont?
Top 10 Cities with the Highest Percentage of Population with a Degree in Engineering in Vermont are:
#1
40.0%
#2
28.3%
#3
23.8%
#4
20.0%
#5
19.3%
#6
17.0%
#7
15.0%
#8
14.5%
#9
13.2%
#10
12.5%
What city has the Highest Percentage of Population with a Degree in Engineering in Vermont?
Benson has the Highest Percentage of Population with a Degree in Engineering in Vermont with 40.0%.
What is the Percentage of Population with a Degree in Engineering in the State of Vermont?
Percentage of Population with a Degree in Engineering in Vermont is 5.3%.
What is the Percentage of Population with a Degree in Engineering in the United States?
Percentage of Population with a Degree in Engineering in the United States is 7.6%.