Cities with the Highest Percentage of Population with a Degree in Engineering in Arkansas
RELATED REPORTS & OPTIONS
Engineering
Arkansas
Compare Cities
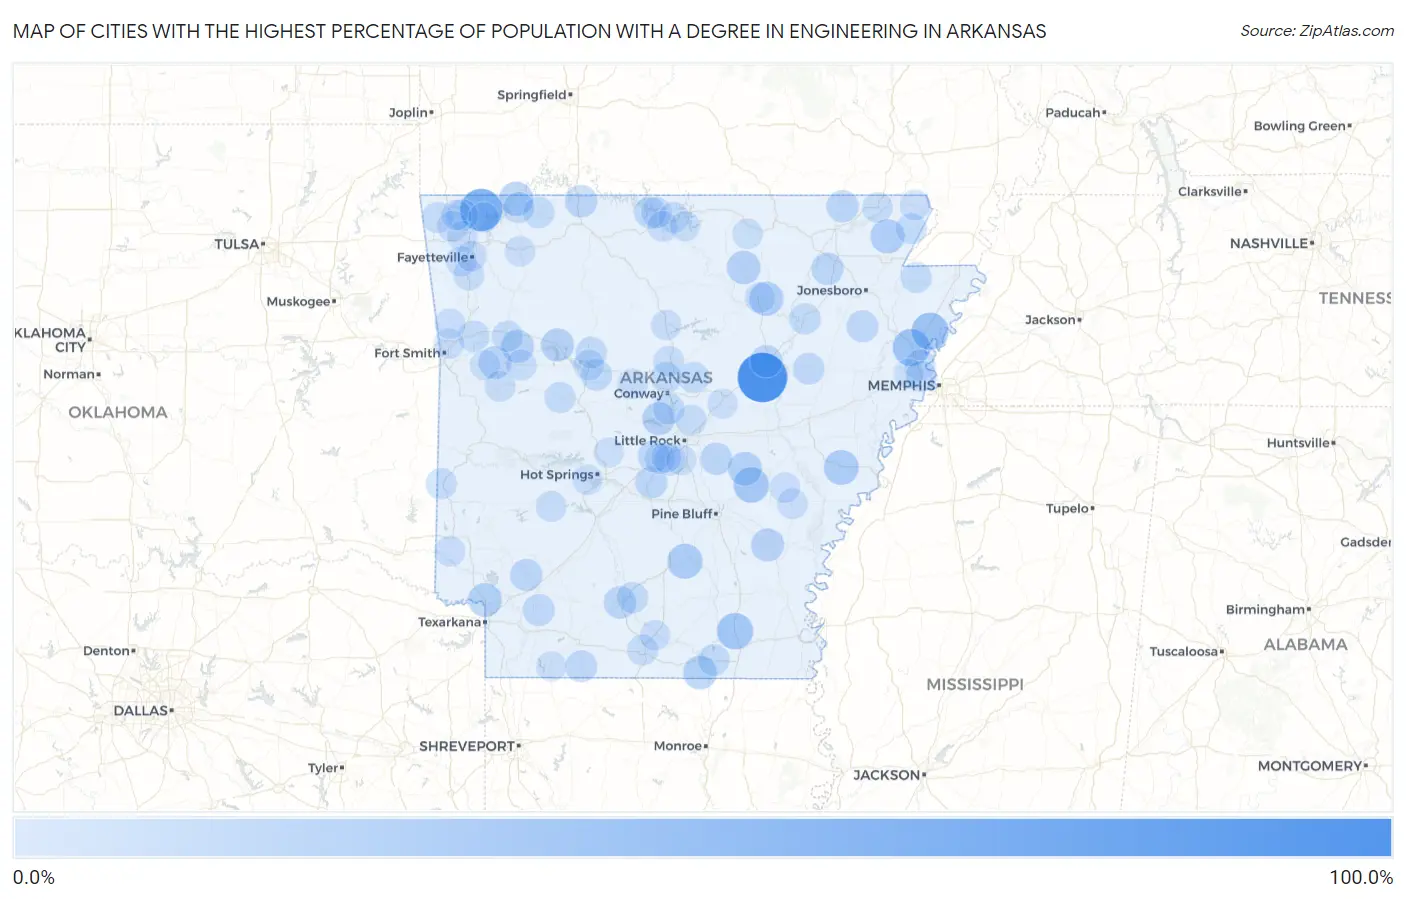
Map of Cities with the Highest Percentage of Population with a Degree in Engineering in Arkansas
0.0%
100.0%
Cities with the Highest Percentage of Population with a Degree in Engineering in Arkansas
| City | % Graduates | vs State | vs National | |
| 1. | West Point | 86.7% | 4.7%(+82.0)#1 | 7.6%(+79.0)#63 |
| 2. | Avoca | 55.2% | 4.7%(+50.6)#2 | 7.6%(+47.6)#141 |
| 3. | Batavia | 41.8% | 4.7%(+37.1)#3 | 7.6%(+34.1)#248 |
| 4. | Gilmore | 33.3% | 4.7%(+28.7)#4 | 7.6%(+25.7)#363 |
| 5. | Bassett | 33.3% | 4.7%(+28.7)#5 | 7.6%(+25.7)#367 |
| 6. | Desha | 32.5% | 4.7%(+27.8)#6 | 7.6%(+24.9)#385 |
| 7. | Fountain Hill | 30.0% | 4.7%(+25.3)#7 | 7.6%(+22.4)#447 |
| 8. | Genoa | 27.1% | 4.7%(+22.4)#8 | 7.6%(+19.5)#557 |
| 9. | Floyd | 27.1% | 4.7%(+22.4)#9 | 7.6%(+19.5)#558 |
| 10. | Humphrey | 26.7% | 4.7%(+22.0)#10 | 7.6%(+19.0)#573 |
| 11. | Ozark Acres | 26.1% | 4.7%(+21.4)#11 | 7.6%(+18.4)#593 |
| 12. | Kingsland | 25.0% | 4.7%(+20.3)#12 | 7.6%(+17.4)#647 |
| 13. | Marvell | 23.8% | 4.7%(+19.1)#13 | 7.6%(+16.1)#736 |
| 14. | Lafe | 21.7% | 4.7%(+17.1)#14 | 7.6%(+14.1)#868 |
| 15. | Moorefield | 21.4% | 4.7%(+16.8)#15 | 7.6%(+13.8)#901 |
| 16. | Beaver | 21.1% | 4.7%(+16.4)#16 | 7.6%(+13.4)#941 |
| 17. | Ogden | 20.0% | 4.7%(+15.3)#17 | 7.6%(+12.4)#1,051 |
| 18. | Humnoke | 20.0% | 4.7%(+15.3)#18 | 7.6%(+12.4)#1,058 |
| 19. | Felsenthal | 20.0% | 4.7%(+15.3)#19 | 7.6%(+12.4)#1,072 |
| 20. | Mount Pleasant | 19.0% | 4.7%(+14.4)#20 | 7.6%(+11.4)#1,157 |
| 21. | Lamar | 17.2% | 4.7%(+12.5)#21 | 7.6%(+9.57)#1,408 |
| 22. | Roland | 16.9% | 4.7%(+12.3)#22 | 7.6%(+9.29)#1,457 |
| 23. | Gould | 16.7% | 4.7%(+12.0)#23 | 7.6%(+9.02)#1,508 |
| 24. | Branch | 16.7% | 4.7%(+12.0)#24 | 7.6%(+9.02)#1,515 |
| 25. | Denning | 16.7% | 4.7%(+12.0)#25 | 7.6%(+9.02)#1,521 |
| 26. | Camden | 14.6% | 4.7%(+9.88)#26 | 7.6%(+6.91)#1,964 |
| 27. | Bald Knob | 14.4% | 4.7%(+9.67)#27 | 7.6%(+6.70)#2,007 |
| 28. | Omaha | 14.3% | 4.7%(+9.61)#28 | 7.6%(+6.64)#2,055 |
| 29. | Minturn | 14.3% | 4.7%(+9.61)#29 | 7.6%(+6.64)#2,068 |
| 30. | Keo | 13.8% | 4.7%(+9.17)#30 | 7.6%(+6.20)#2,206 |
| 31. | Maynard | 13.8% | 4.7%(+9.12)#31 | 7.6%(+6.15)#2,218 |
| 32. | Washington | 13.6% | 4.7%(+8.96)#32 | 7.6%(+5.99)#2,263 |
| 33. | Tull | 12.9% | 4.7%(+8.23)#33 | 7.6%(+5.26)#2,531 |
| 34. | Patmos | 12.5% | 4.7%(+7.82)#34 | 7.6%(+4.85)#2,710 |
| 35. | Harrisburg | 12.3% | 4.7%(+7.64)#35 | 7.6%(+4.67)#2,770 |
| 36. | Emerson | 12.1% | 4.7%(+7.44)#36 | 7.6%(+4.47)#2,846 |
| 37. | Salem | 12.0% | 4.7%(+7.34)#37 | 7.6%(+4.37)#2,879 |
| 38. | Mccrory | 11.6% | 4.7%(+6.96)#38 | 7.6%(+3.99)#3,058 |
| 39. | Bull Shoals | 11.5% | 4.7%(+6.80)#39 | 7.6%(+3.83)#3,129 |
| 40. | Mayflower | 10.9% | 4.7%(+6.26)#40 | 7.6%(+3.29)#3,440 |
| 41. | West Crossett | 10.7% | 4.7%(+6.04)#41 | 7.6%(+3.07)#3,576 |
| 42. | Pottsville | 10.7% | 4.7%(+5.97)#42 | 7.6%(+3.00)#3,616 |
| 43. | Bentonville | 10.5% | 4.7%(+5.83)#43 | 7.6%(+2.86)#3,717 |
| 44. | Newport | 10.4% | 4.7%(+5.74)#44 | 7.6%(+2.77)#3,772 |
| 45. | Dover | 10.1% | 4.7%(+5.47)#45 | 7.6%(+2.50)#3,975 |
| 46. | Berryville | 10.0% | 4.7%(+5.36)#46 | 7.6%(+2.39)#4,039 |
| 47. | East Camden | 9.8% | 4.7%(+5.13)#47 | 7.6%(+2.16)#4,245 |
| 48. | Dyer | 9.8% | 4.7%(+5.13)#48 | 7.6%(+2.16)#4,248 |
| 49. | Cove | 9.7% | 4.7%(+5.00)#49 | 7.6%(+2.03)#4,331 |
| 50. | Rector | 9.4% | 4.7%(+4.68)#50 | 7.6%(+1.71)#4,587 |
| 51. | Danville | 9.3% | 4.7%(+4.57)#51 | 7.6%(+1.60)#4,678 |
| 52. | Eureka Springs | 9.2% | 4.7%(+4.49)#52 | 7.6%(+1.52)#4,748 |
| 53. | Leachville | 9.1% | 4.7%(+4.47)#53 | 7.6%(+1.50)#4,762 |
| 54. | Enola | 9.1% | 4.7%(+4.41)#54 | 7.6%(+1.44)#4,804 |
| 55. | Ozark | 8.8% | 4.7%(+4.15)#55 | 7.6%(+1.18)#5,088 |
| 56. | Wooster | 8.8% | 4.7%(+4.12)#56 | 7.6%(+1.15)#5,115 |
| 57. | Clarkedale | 8.7% | 4.7%(+4.06)#57 | 7.6%(+1.09)#5,170 |
| 58. | Decatur | 8.6% | 4.7%(+3.87)#58 | 7.6%(+0.905)#5,353 |
| 59. | Lakeview | 8.6% | 4.7%(+3.87)#59 | 7.6%(+0.905)#5,355 |
| 60. | Shannon Hills | 8.4% | 4.7%(+3.73)#60 | 7.6%(+0.765)#5,479 |
| 61. | West Fork | 8.4% | 4.7%(+3.69)#61 | 7.6%(+0.716)#5,519 |
| 62. | Mountain Home | 8.3% | 4.7%(+3.63)#62 | 7.6%(+0.661)#5,610 |
| 63. | El Dorado | 8.3% | 4.7%(+3.59)#63 | 7.6%(+0.624)#5,642 |
| 64. | Russellville | 8.3% | 4.7%(+3.58)#64 | 7.6%(+0.609)#5,657 |
| 65. | Marion | 8.1% | 4.7%(+3.38)#65 | 7.6%(+0.406)#5,899 |
| 66. | Amity | 7.9% | 4.7%(+3.22)#66 | 7.6%(+0.247)#6,100 |
| 67. | Paris | 7.8% | 4.7%(+3.11)#67 | 7.6%(+0.139)#6,226 |
| 68. | Gibson | 7.8% | 4.7%(+3.09)#68 | 7.6%(+0.118)#6,252 |
| 69. | Booneville | 7.7% | 4.7%(+3.01)#69 | 7.6%(+0.045)#6,334 |
| 70. | Twin Groves | 7.7% | 4.7%(+3.01)#70 | 7.6%(+0.045)#6,362 |
| 71. | Bryant | 7.6% | 4.7%(+2.96)#71 | 7.6%(-0.005)#6,426 |
| 72. | Highfill | 7.6% | 4.7%(+2.91)#72 | 7.6%(-0.057)#6,490 |
| 73. | Elm Springs | 7.3% | 4.7%(+2.65)#73 | 7.6%(-0.324)#6,817 |
| 74. | Farmington | 7.3% | 4.7%(+2.63)#74 | 7.6%(-0.342)#6,848 |
| 75. | Fayetteville | 7.3% | 4.7%(+2.62)#75 | 7.6%(-0.347)#6,860 |
| 76. | Horatio | 7.3% | 4.7%(+2.61)#76 | 7.6%(-0.356)#6,873 |
| 77. | Centerton | 7.1% | 4.7%(+2.40)#77 | 7.6%(-0.569)#7,168 |
| 78. | Dewitt | 7.1% | 4.7%(+2.39)#78 | 7.6%(-0.584)#7,194 |
| 79. | Calion | 7.0% | 4.7%(+2.30)#79 | 7.6%(-0.671)#7,304 |
| 80. | Huntsville | 6.8% | 4.7%(+2.16)#80 | 7.6%(-0.810)#7,497 |
| 81. | Corning | 6.8% | 4.7%(+2.12)#81 | 7.6%(-0.851)#7,554 |
| 82. | Prairie Creek | 6.7% | 4.7%(+2.02)#82 | 7.6%(-0.954)#7,689 |
| 83. | Batesville | 6.7% | 4.7%(+2.00)#83 | 7.6%(-0.973)#7,711 |
| 84. | Van Buren | 6.7% | 4.7%(+1.99)#84 | 7.6%(-0.979)#7,716 |
| 85. | Clinton | 6.5% | 4.7%(+1.85)#85 | 7.6%(-1.12)#7,945 |
| 86. | Rockwell | 6.3% | 4.7%(+1.65)#86 | 7.6%(-1.32)#8,253 |
| 87. | Gassville | 6.3% | 4.7%(+1.60)#87 | 7.6%(-1.37)#8,333 |
| 88. | Landmark | 6.3% | 4.7%(+1.60)#88 | 7.6%(-1.37)#8,349 |
| 89. | Pollard | 6.2% | 4.7%(+1.57)#89 | 7.6%(-1.40)#8,414 |
| 90. | Almyra | 6.2% | 4.7%(+1.57)#90 | 7.6%(-1.40)#8,415 |
| 91. | Morrilton | 6.2% | 4.7%(+1.56)#91 | 7.6%(-1.41)#8,429 |
| 92. | Cedarville | 6.1% | 4.7%(+1.43)#92 | 7.6%(-1.54)#8,662 |
| 93. | Alexander | 6.1% | 4.7%(+1.39)#93 | 7.6%(-1.58)#8,721 |
| 94. | Horseshoe Bend | 6.1% | 4.7%(+1.39)#94 | 7.6%(-1.58)#8,722 |
| 95. | Charleston | 5.8% | 4.7%(+1.15)#95 | 7.6%(-1.82)#9,109 |
| 96. | Taylor | 5.8% | 4.7%(+1.12)#96 | 7.6%(-1.85)#9,155 |
| 97. | Crawfordsville | 5.7% | 4.7%(+1.00)#97 | 7.6%(-1.97)#9,361 |
| 98. | Briarcliff | 5.6% | 4.7%(+0.878)#98 | 7.6%(-2.09)#9,576 |
| 99. | Ward | 5.5% | 4.7%(+0.828)#99 | 7.6%(-2.14)#9,652 |
| 100. | Hot Springs Village | 5.4% | 4.7%(+0.690)#100 | 7.6%(-2.28)#9,891 |
Common Questions
What are the Top 10 Cities with the Highest Percentage of Population with a Degree in Engineering in Arkansas?
Top 10 Cities with the Highest Percentage of Population with a Degree in Engineering in Arkansas are:
#1
86.7%
#2
55.2%
#3
33.3%
#4
33.3%
#5
30.0%
#6
26.7%
#7
25.0%
#8
23.8%
#9
21.7%
#10
21.4%
What city has the Highest Percentage of Population with a Degree in Engineering in Arkansas?
West Point has the Highest Percentage of Population with a Degree in Engineering in Arkansas with 86.7%.
What is the Percentage of Population with a Degree in Engineering in the State of Arkansas?
Percentage of Population with a Degree in Engineering in Arkansas is 4.7%.
What is the Percentage of Population with a Degree in Engineering in the United States?
Percentage of Population with a Degree in Engineering in the United States is 7.6%.