Las Lomas, CA Map & Demographics
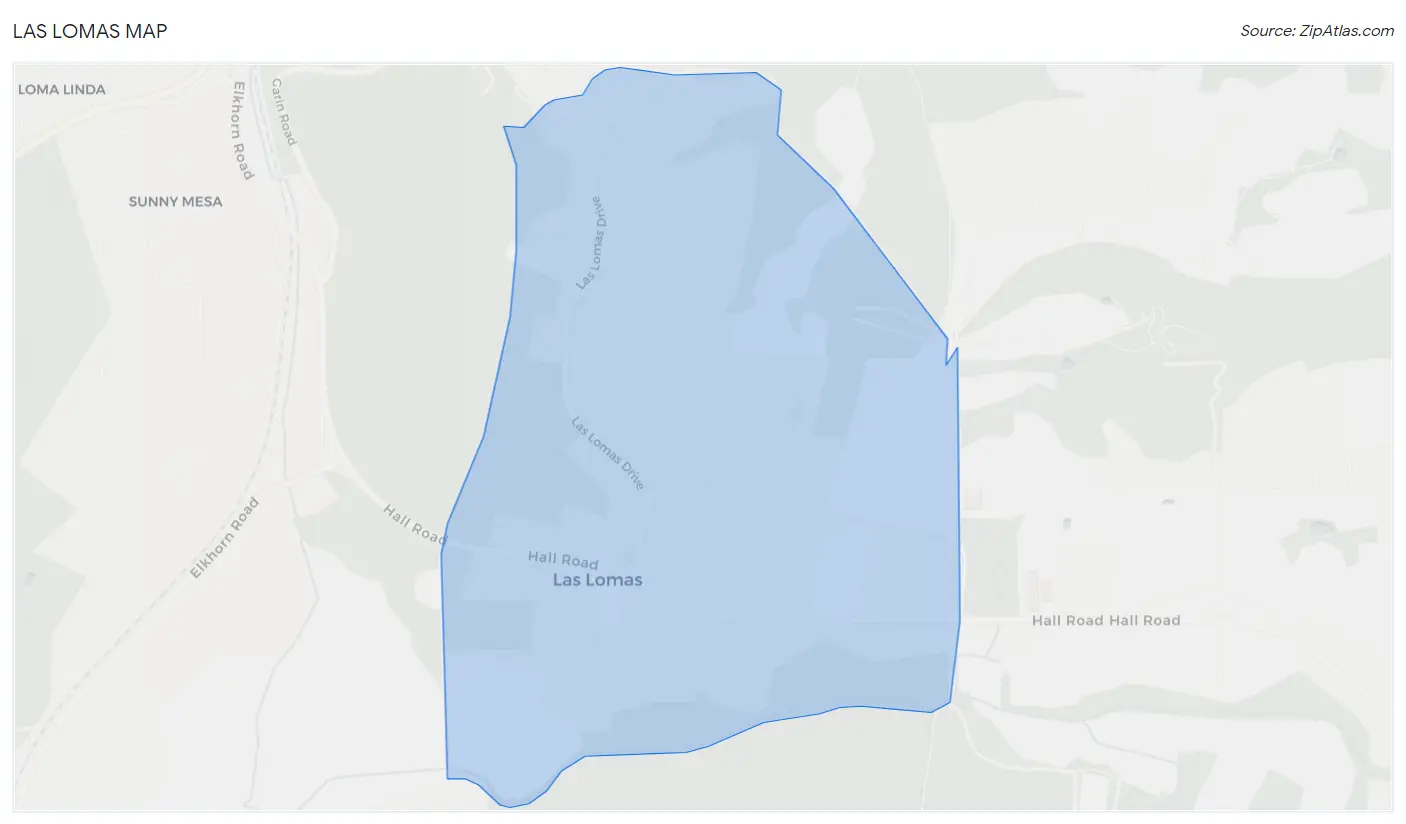
Las Lomas Map
Las Lomas Overview
$21,690
PER CAPITA INCOME
$73,750
AVG FAMILY INCOME
$74,800
AVG HOUSEHOLD INCOME
6.1%
WAGE / INCOME GAP [ % ]
93.9¢/ $1
WAGE / INCOME GAP [ $ ]
0.48
INEQUALITY / GINI INDEX
3,059
TOTAL POPULATION
1,501
MALE POPULATION
1,558
FEMALE POPULATION
96.34
MALES / 100 FEMALES
103.80
FEMALES / 100 MALES
27.6
MEDIAN AGE
4.1
AVG FAMILY SIZE
4.3
AVG HOUSEHOLD SIZE
1,452
LABOR FORCE [ PEOPLE ]
65.6%
PERCENT IN LABOR FORCE
3.1%
UNEMPLOYMENT RATE
Income in Las Lomas
Income Overview in Las Lomas
Per Capita Income in Las Lomas is $21,690, while median incomes of families and households are $73,750 and $74,800 respectively.
| Characteristic | Number | Measure |
| Per Capita Income | 3,059 | $21,690 |
| Median Family Income | 649 | $73,750 |
| Mean Family Income | 649 | $91,364 |
| Median Household Income | 714 | $74,800 |
| Mean Household Income | 714 | $95,705 |
| Income Deficit | 649 | $0 |
| Wage / Income Gap (%) | 3,059 | 6.13% |
| Wage / Income Gap ($) | 3,059 | 93.87¢ per $1 |
| Gini / Inequality Index | 3,059 | 0.48 |
Earnings by Sex in Las Lomas
Average Earnings in Las Lomas are $27,380, $27,898 for men and $26,189 for women, a difference of 6.1%.
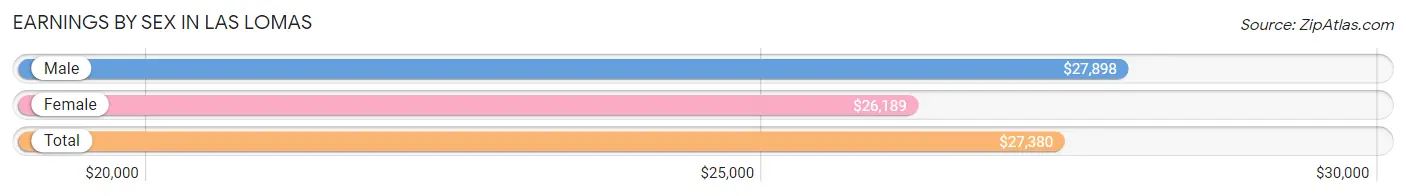
| Sex | Number | Average Earnings |
| Male | 876 (60.5%) | $27,898 |
| Female | 571 (39.5%) | $26,189 |
| Total | 1,447 (100.0%) | $27,380 |
Earnings by Sex by Income Bracket in Las Lomas
The most common earnings brackets in Las Lomas are $25,000 to $29,999 for men (145 | 16.6%) and $7,500 to $9,999 for women (74 | 13.0%).
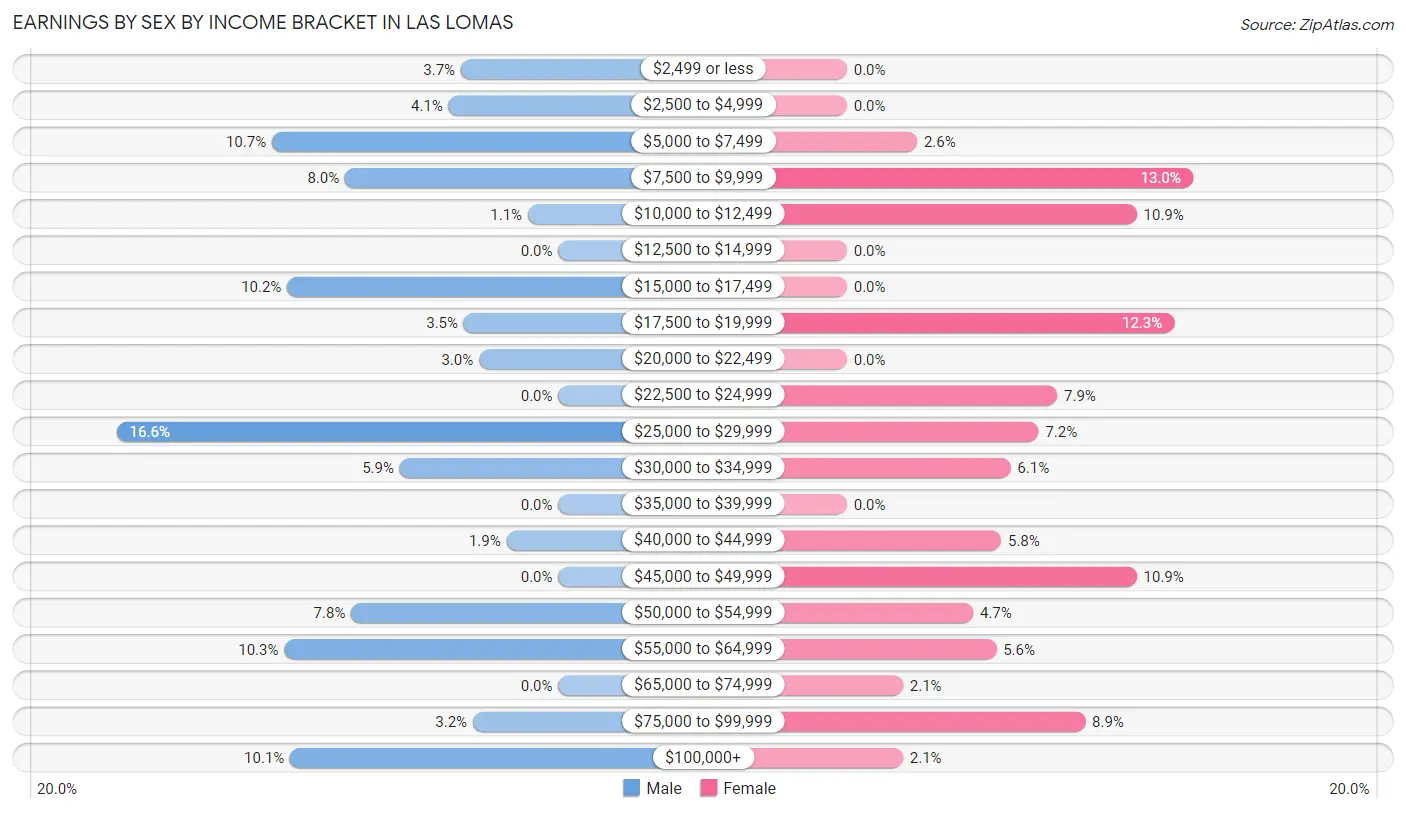
| Income | Male | Female |
| $2,499 or less | 32 (3.6%) | 0 (0.0%) |
| $2,500 to $4,999 | 36 (4.1%) | 0 (0.0%) |
| $5,000 to $7,499 | 94 (10.7%) | 15 (2.6%) |
| $7,500 to $9,999 | 70 (8.0%) | 74 (13.0%) |
| $10,000 to $12,499 | 10 (1.1%) | 62 (10.9%) |
| $12,500 to $14,999 | 0 (0.0%) | 0 (0.0%) |
| $15,000 to $17,499 | 89 (10.2%) | 0 (0.0%) |
| $17,500 to $19,999 | 31 (3.5%) | 70 (12.3%) |
| $20,000 to $22,499 | 26 (3.0%) | 0 (0.0%) |
| $22,500 to $24,999 | 0 (0.0%) | 45 (7.9%) |
| $25,000 to $29,999 | 145 (16.6%) | 41 (7.2%) |
| $30,000 to $34,999 | 52 (5.9%) | 35 (6.1%) |
| $35,000 to $39,999 | 0 (0.0%) | 0 (0.0%) |
| $40,000 to $44,999 | 17 (1.9%) | 33 (5.8%) |
| $45,000 to $49,999 | 0 (0.0%) | 62 (10.9%) |
| $50,000 to $54,999 | 68 (7.8%) | 27 (4.7%) |
| $55,000 to $64,999 | 90 (10.3%) | 32 (5.6%) |
| $65,000 to $74,999 | 0 (0.0%) | 12 (2.1%) |
| $75,000 to $99,999 | 28 (3.2%) | 51 (8.9%) |
| $100,000+ | 88 (10.1%) | 12 (2.1%) |
| Total | 876 (100.0%) | 571 (100.0%) |
Earnings by Sex by Educational Attainment in Las Lomas
Average earnings in Las Lomas are $29,066 for men and $33,714 for women, a difference of 13.8%. Men with an educational attainment of graduate degree enjoy the highest average annual earnings of $88,929, while those with less than high school education earn the least with $27,633. Women with an educational attainment of college or associate's degree earn the most with the average annual earnings of $61,500, while those with less than high school education have the smallest earnings of $24,095.
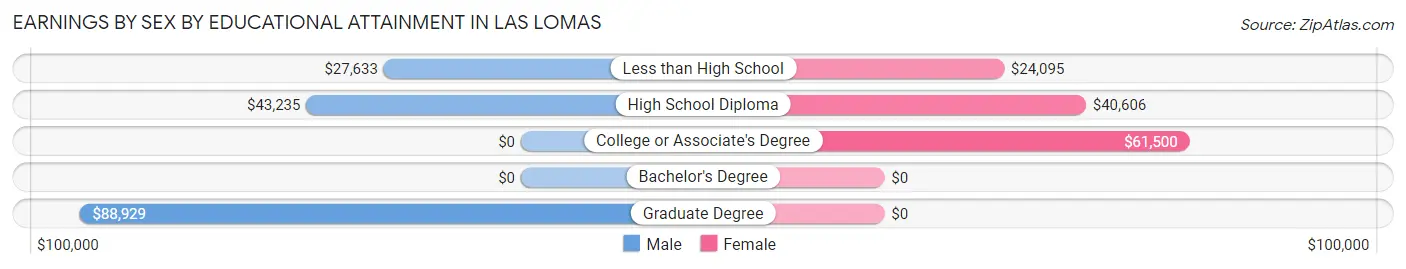
| Educational Attainment | Male Income | Female Income |
| Less than High School | $27,633 | $24,095 |
| High School Diploma | $43,235 | $40,606 |
| College or Associate's Degree | - | - |
| Bachelor's Degree | - | - |
| Graduate Degree | $88,929 | $0 |
| Total | $29,066 | $33,714 |
Family Income in Las Lomas
Family Income Brackets in Las Lomas
According to the Las Lomas family income data, there are 143 families falling into the $25,000 to $34,999 income range, which is the most common income bracket and makes up 22.0% of all families. Conversely, the $15,000 to $24,999 income bracket is the least frequent group with only 10 families (1.5%) belonging to this category.
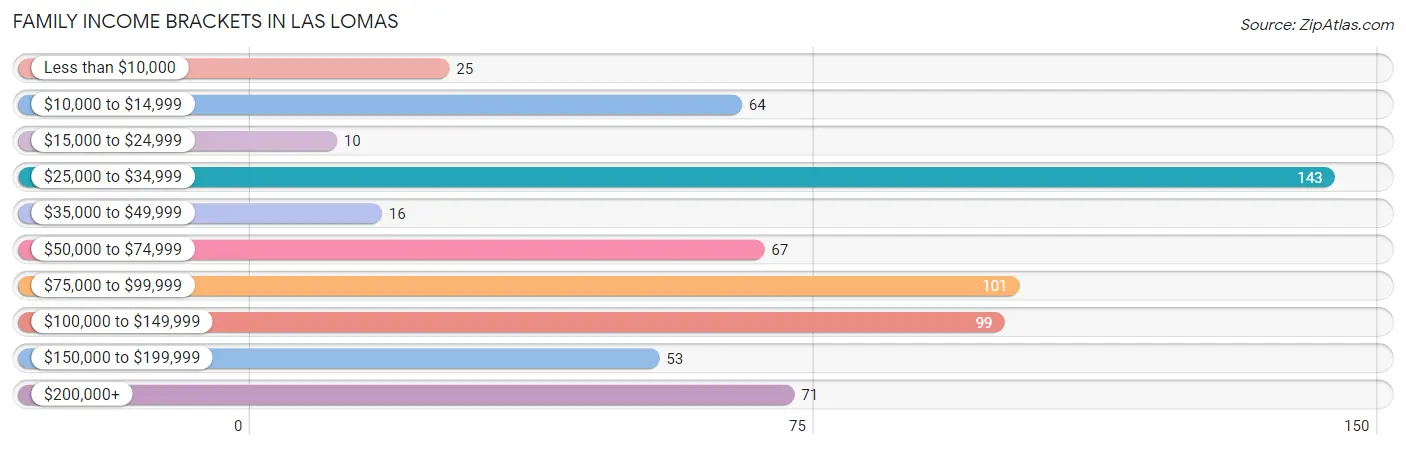
| Income Bracket | # Families | % Families |
| Less than $10,000 | 25 | 3.9% |
| $10,000 to $14,999 | 64 | 9.9% |
| $15,000 to $24,999 | 10 | 1.5% |
| $25,000 to $34,999 | 143 | 22.0% |
| $35,000 to $49,999 | 16 | 2.5% |
| $50,000 to $74,999 | 67 | 10.3% |
| $75,000 to $99,999 | 101 | 15.6% |
| $100,000 to $149,999 | 99 | 15.3% |
| $150,000 to $199,999 | 53 | 8.2% |
| $200,000+ | 71 | 10.9% |
Family Income by Famaliy Size in Las Lomas
4-person families (225 | 34.7%) account for the highest median family income in Las Lomas with $60,987 per family, while 4-person families (225 | 34.7%) have the highest median income of $15,247 per family member.
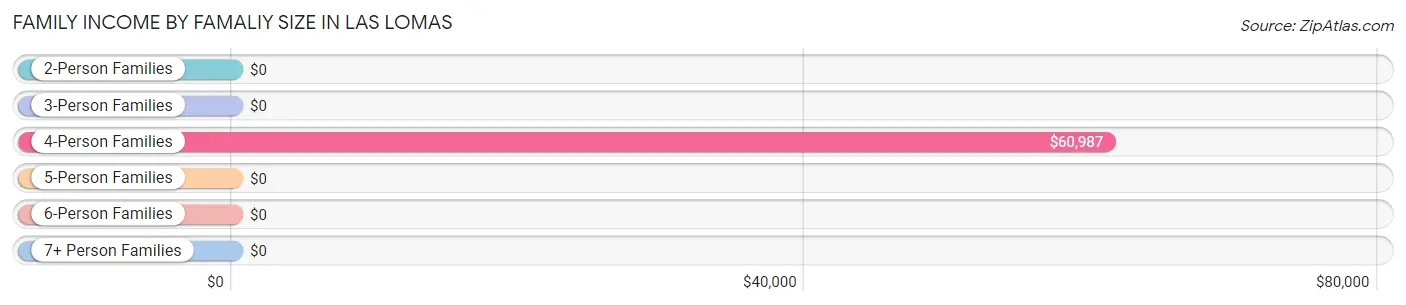
| Income Bracket | # Families | Median Income |
| 2-Person Families | 62 (9.6%) | $0 |
| 3-Person Families | 195 (30.0%) | $0 |
| 4-Person Families | 225 (34.7%) | $60,987 |
| 5-Person Families | 17 (2.6%) | $0 |
| 6-Person Families | 72 (11.1%) | $0 |
| 7+ Person Families | 78 (12.0%) | $0 |
| Total | 649 (100.0%) | $73,750 |
Family Income by Number of Earners in Las Lomas
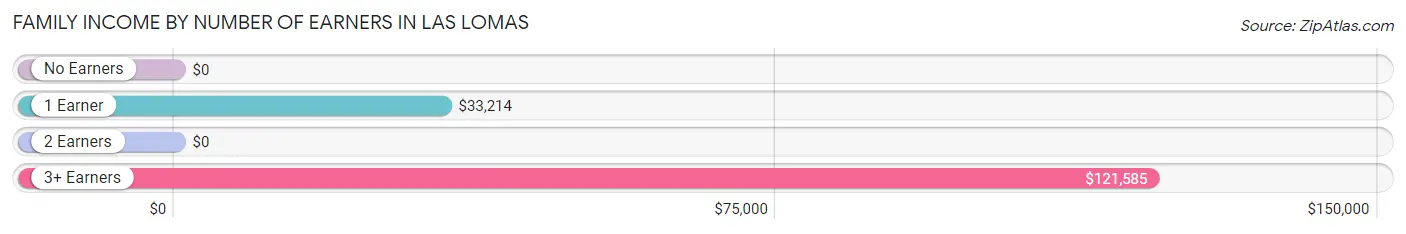
| Number of Earners | # Families | Median Income |
| No Earners | 43 (6.6%) | $0 |
| 1 Earner | 282 (43.4%) | $33,214 |
| 2 Earners | 70 (10.8%) | $0 |
| 3+ Earners | 254 (39.1%) | $121,585 |
| Total | 649 (100.0%) | $73,750 |
Household Income in Las Lomas
Household Income Brackets in Las Lomas
With 147 households falling in the category, the $25,000 to $34,999 income range is the most frequent in Las Lomas, accounting for 20.6% of all households. In contrast, only 10 households (1.4%) fall into the $15,000 to $24,999 income bracket, making it the least populous group.
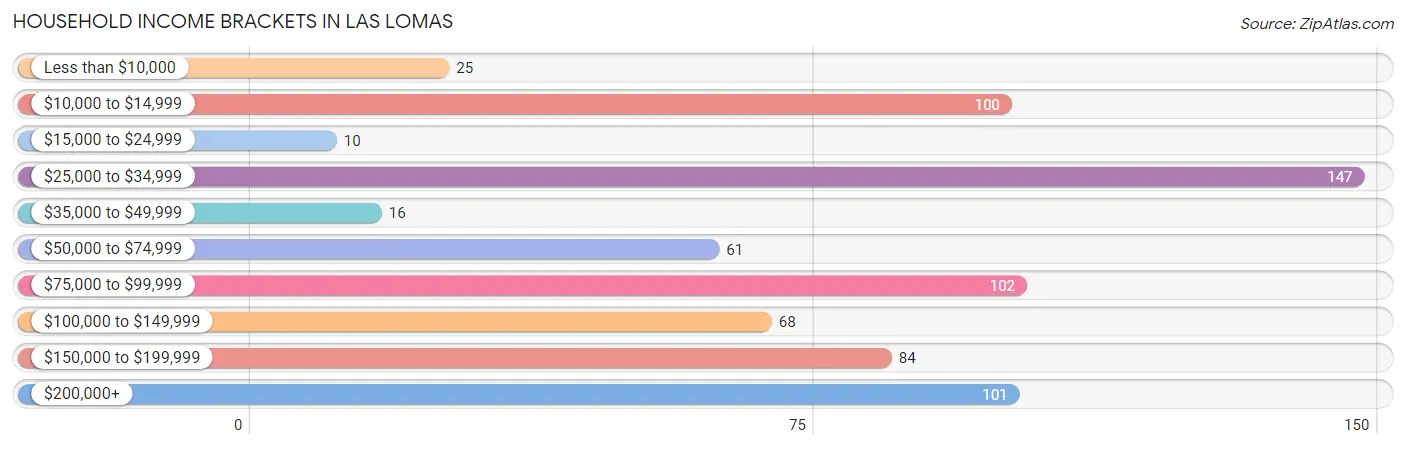
| Income Bracket | # Households | % Households |
| Less than $10,000 | 25 | 3.5% |
| $10,000 to $14,999 | 100 | 14.0% |
| $15,000 to $24,999 | 10 | 1.4% |
| $25,000 to $34,999 | 147 | 20.6% |
| $35,000 to $49,999 | 16 | 2.2% |
| $50,000 to $74,999 | 61 | 8.5% |
| $75,000 to $99,999 | 102 | 14.3% |
| $100,000 to $149,999 | 68 | 9.5% |
| $150,000 to $199,999 | 84 | 11.8% |
| $200,000+ | 101 | 14.1% |
Household Income by Householder Age in Las Lomas
The median household income in Las Lomas is $74,800, with the highest median household income of $120,030 found in the 45 to 64 years age bracket for the primary householder. A total of 389 households (54.5%) fall into this category.
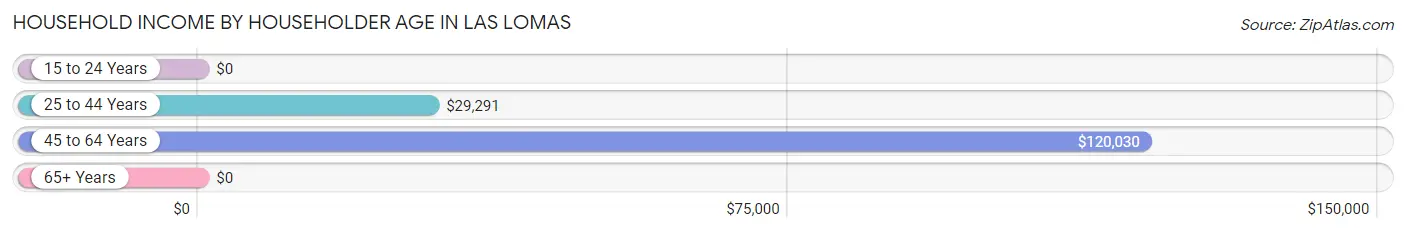
| Income Bracket | # Households | Median Income |
| 15 to 24 Years | 0 (0.0%) | $0 |
| 25 to 44 Years | 224 (31.4%) | $29,291 |
| 45 to 64 Years | 389 (54.5%) | $120,030 |
| 65+ Years | 101 (14.1%) | $0 |
| Total | 714 (100.0%) | $74,800 |
Poverty in Las Lomas
Income Below Poverty by Sex and Age in Las Lomas
With 10.8% poverty level for males and 23.2% for females among the residents of Las Lomas, 75 year old and over males and 65 to 74 year old females are the most vulnerable to poverty, with 20 males (35.1%) and 30 females (76.9%) in their respective age groups living below the poverty level.
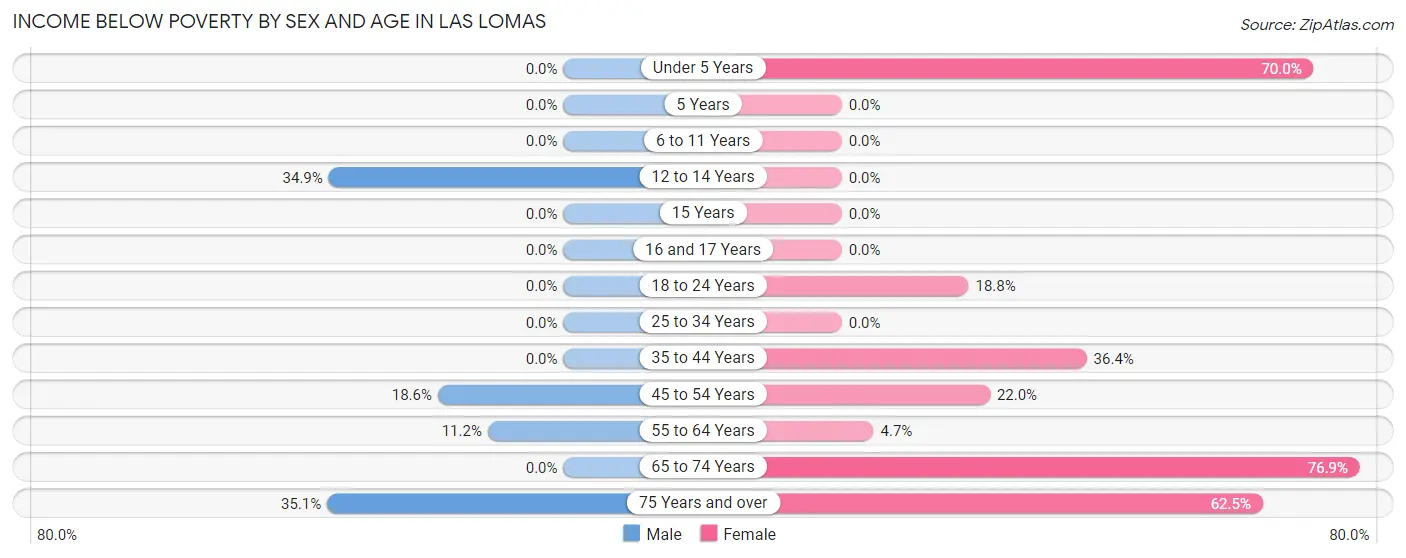
| Age Bracket | Male | Female |
| Under 5 Years | 0 (0.0%) | 159 (70.0%) |
| 5 Years | 0 (0.0%) | 0 (0.0%) |
| 6 to 11 Years | 0 (0.0%) | 0 (0.0%) |
| 12 to 14 Years | 76 (34.9%) | 0 (0.0%) |
| 15 Years | 0 (0.0%) | 0 (0.0%) |
| 16 and 17 Years | 0 (0.0%) | 0 (0.0%) |
| 18 to 24 Years | 0 (0.0%) | 32 (18.8%) |
| 25 to 34 Years | 0 (0.0%) | 0 (0.0%) |
| 35 to 44 Years | 0 (0.0%) | 64 (36.4%) |
| 45 to 54 Years | 41 (18.6%) | 33 (22.0%) |
| 55 to 64 Years | 21 (11.2%) | 10 (4.7%) |
| 65 to 74 Years | 0 (0.0%) | 30 (76.9%) |
| 75 Years and over | 20 (35.1%) | 25 (62.5%) |
| Total | 158 (10.8%) | 353 (23.2%) |
Income Above Poverty by Sex and Age in Las Lomas
According to the poverty statistics in Las Lomas, males aged under 5 years and females aged 6 to 11 years are the age groups that are most secure financially, with 100.0% of males and 100.0% of females in these age groups living above the poverty line.
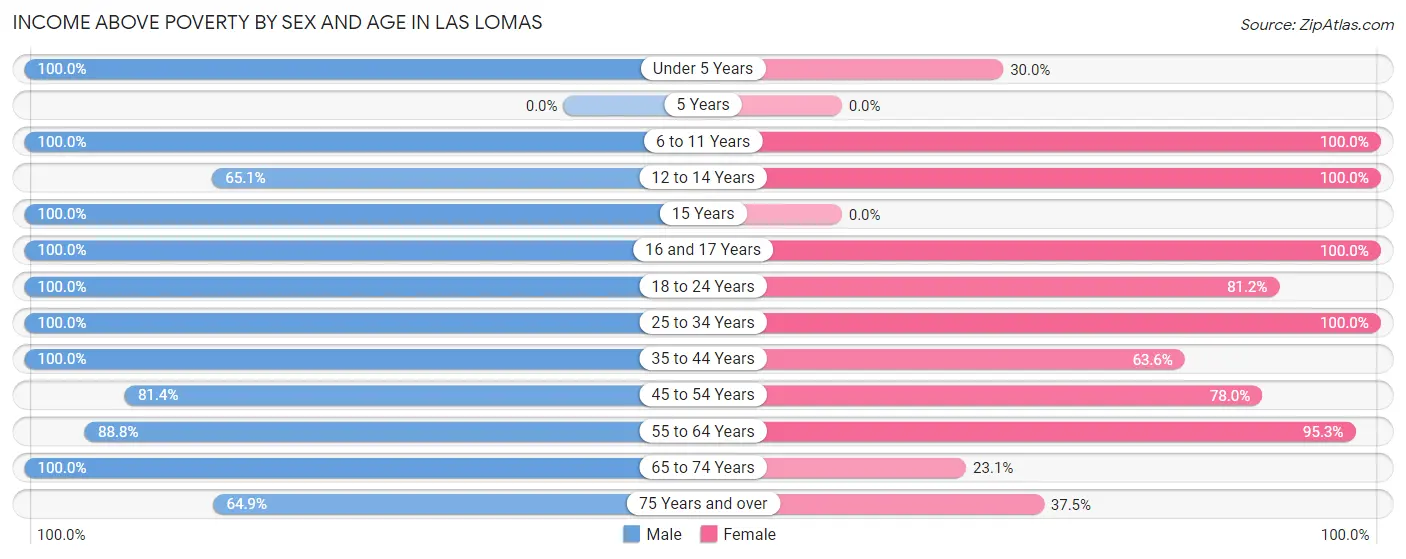
| Age Bracket | Male | Female |
| Under 5 Years | 23 (100.0%) | 68 (30.0%) |
| 5 Years | 0 (0.0%) | 0 (0.0%) |
| 6 to 11 Years | 83 (100.0%) | 125 (100.0%) |
| 12 to 14 Years | 142 (65.1%) | 59 (100.0%) |
| 15 Years | 43 (100.0%) | 0 (0.0%) |
| 16 and 17 Years | 32 (100.0%) | 165 (100.0%) |
| 18 to 24 Years | 214 (100.0%) | 138 (81.2%) |
| 25 to 34 Years | 180 (100.0%) | 162 (100.0%) |
| 35 to 44 Years | 128 (100.0%) | 112 (63.6%) |
| 45 to 54 Years | 179 (81.4%) | 117 (78.0%) |
| 55 to 64 Years | 166 (88.8%) | 202 (95.3%) |
| 65 to 74 Years | 82 (100.0%) | 9 (23.1%) |
| 75 Years and over | 37 (64.9%) | 15 (37.5%) |
| Total | 1,309 (89.2%) | 1,172 (76.8%) |
Income Below Poverty Among Married-Couple Families in Las Lomas
The poverty statistics for married-couple families in Las Lomas show that 7.7% or 35 of the total 454 families live below the poverty line. Families with no children have the highest poverty rate of 21.0%, comprising of 35 families. On the other hand, families with 1 or 2 children have the lowest poverty rate of 0.0%, which includes 0 families.
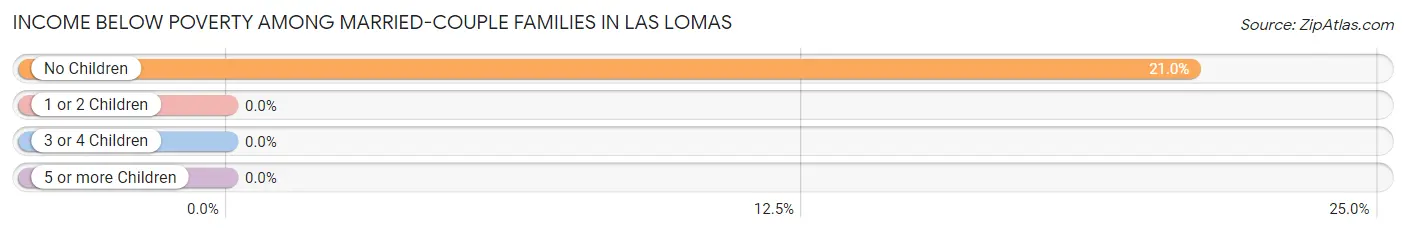
| Children | Above Poverty | Below Poverty |
| No Children | 132 (79.0%) | 35 (21.0%) |
| 1 or 2 Children | 192 (100.0%) | 0 (0.0%) |
| 3 or 4 Children | 95 (100.0%) | 0 (0.0%) |
| 5 or more Children | 0 (0.0%) | 0 (0.0%) |
| Total | 419 (92.3%) | 35 (7.7%) |
Income Below Poverty Among Single-Parent Households in Las Lomas
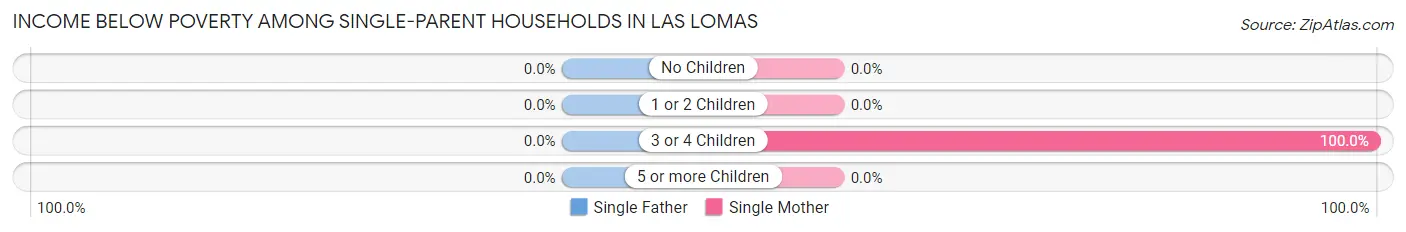
| Children | Single Father | Single Mother |
| No Children | 0 (0.0%) | 0 (0.0%) |
| 1 or 2 Children | 0 (0.0%) | 0 (0.0%) |
| 3 or 4 Children | 0 (0.0%) | 64 (100.0%) |
| 5 or more Children | 0 (0.0%) | 0 (0.0%) |
| Total | 0 (0.0%) | 64 (50.0%) |
Income Below Poverty Among Married-Couple vs Single-Parent Households in Las Lomas
The poverty data for Las Lomas shows that 35 of the married-couple family households (7.7%) and 64 of the single-parent households (32.8%) are living below the poverty level. Within the married-couple family households, those with no children have the highest poverty rate, with 35 households (21.0%) falling below the poverty line. Among the single-parent households, those with 3 or 4 children have the highest poverty rate, with 64 household (100.0%) living below poverty.
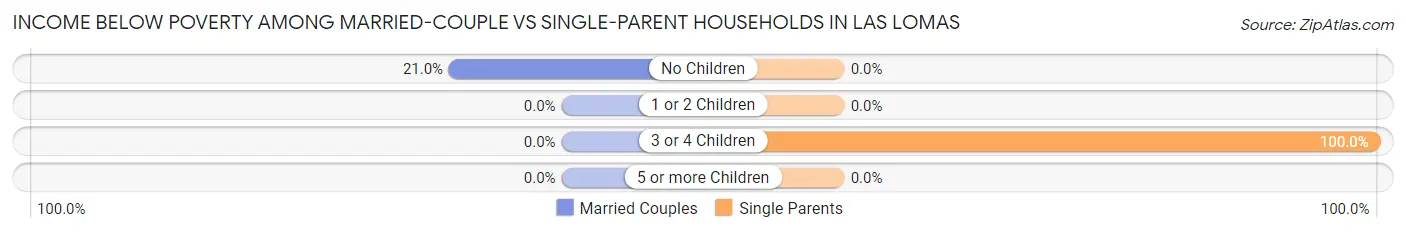
| Children | Married-Couple Families | Single-Parent Households |
| No Children | 35 (21.0%) | 0 (0.0%) |
| 1 or 2 Children | 0 (0.0%) | 0 (0.0%) |
| 3 or 4 Children | 0 (0.0%) | 64 (100.0%) |
| 5 or more Children | 0 (0.0%) | 0 (0.0%) |
| Total | 35 (7.7%) | 64 (32.8%) |
Race in Las Lomas
The most populous races in Las Lomas are Hispanic or Latino (2,887 | 94.4%), White / Caucasian (1,385 | 45.3%), and Some other Race (940 | 30.7%).
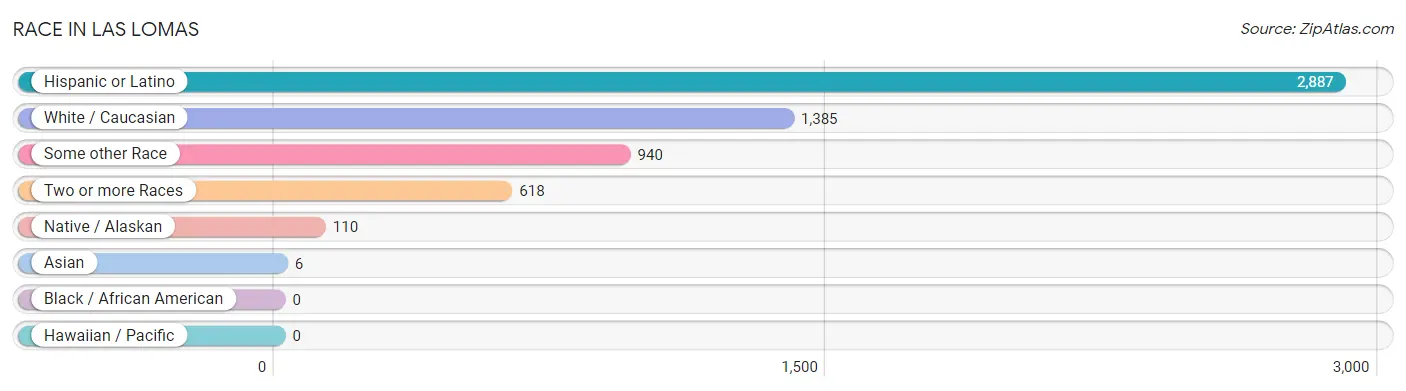
| Race | # Population | % Population |
| Asian | 6 | 0.2% |
| Black / African American | 0 | 0.0% |
| Hawaiian / Pacific | 0 | 0.0% |
| Hispanic or Latino | 2,887 | 94.4% |
| Native / Alaskan | 110 | 3.6% |
| White / Caucasian | 1,385 | 45.3% |
| Two or more Races | 618 | 20.2% |
| Some other Race | 940 | 30.7% |
| Total | 3,059 | 100.0% |
Ancestry in Las Lomas
The most populous ancestries reported in Las Lomas are Mexican (2,848 | 93.1%), Mexican American Indian (110 | 3.6%), Italian (78 | 2.5%), German (43 | 1.4%), and Central American (39 | 1.3%), together accounting for 101.9% of all Las Lomas residents.
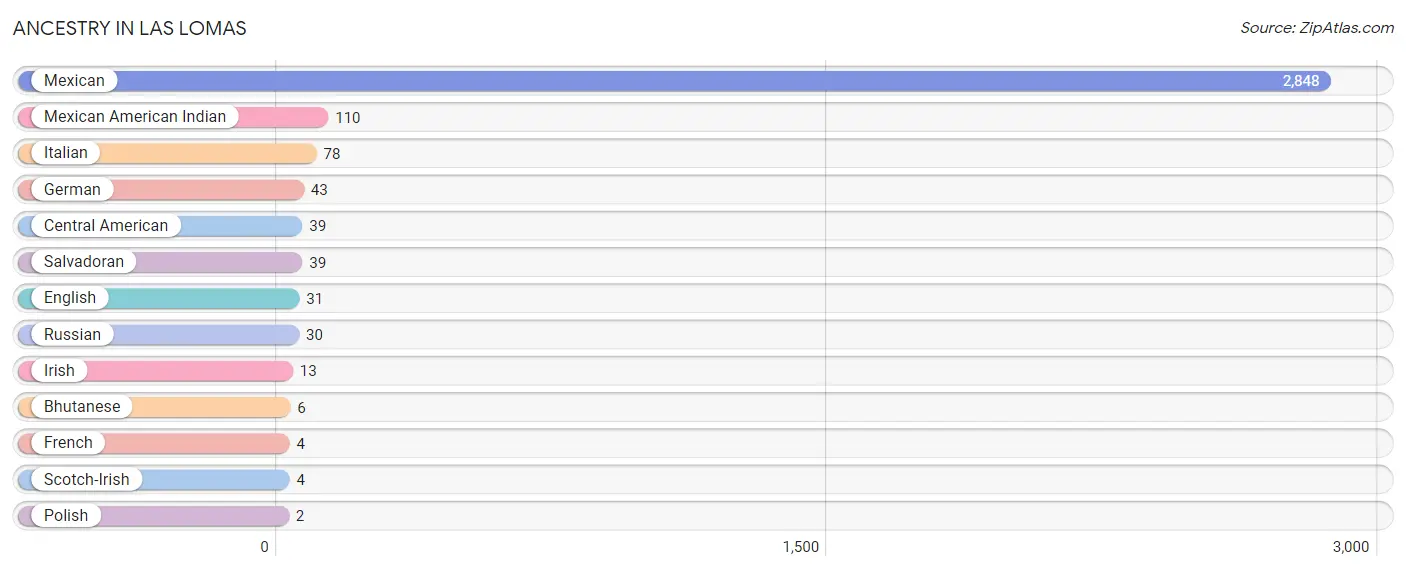
| Ancestry | # Population | % Population |
| Bhutanese | 6 | 0.2% |
| Central American | 39 | 1.3% |
| English | 31 | 1.0% |
| French | 4 | 0.1% |
| German | 43 | 1.4% |
| Irish | 13 | 0.4% |
| Italian | 78 | 2.5% |
| Mexican | 2,848 | 93.1% |
| Mexican American Indian | 110 | 3.6% |
| Polish | 2 | 0.1% |
| Russian | 30 | 1.0% |
| Salvadoran | 39 | 1.3% |
| Scotch-Irish | 4 | 0.1% | View All 13 Rows |
Immigrants in Las Lomas
The most numerous immigrant groups reported in Las Lomas came from Central America (1,021 | 33.4%), Latin America (1,021 | 33.4%), Mexico (993 | 32.5%), El Salvador (28 | 0.9%), and Asia (6 | 0.2%), together accounting for 100.3% of all Las Lomas residents.
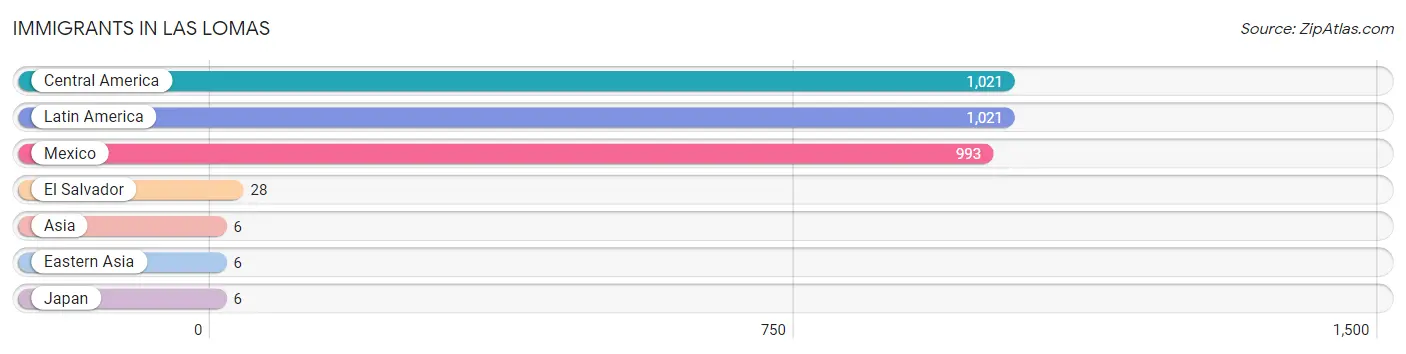
| Immigration Origin | # Population | % Population |
| Asia | 6 | 0.2% |
| Central America | 1,021 | 33.4% |
| Eastern Asia | 6 | 0.2% |
| El Salvador | 28 | 0.9% |
| Japan | 6 | 0.2% |
| Latin America | 1,021 | 33.4% |
| Mexico | 993 | 32.5% | View All 7 Rows |
Sex and Age in Las Lomas
Sex and Age in Las Lomas
The most populous age groups in Las Lomas are 10 to 14 Years (274 | 18.2%) for men and 15 to 19 Years (273 | 17.5%) for women.
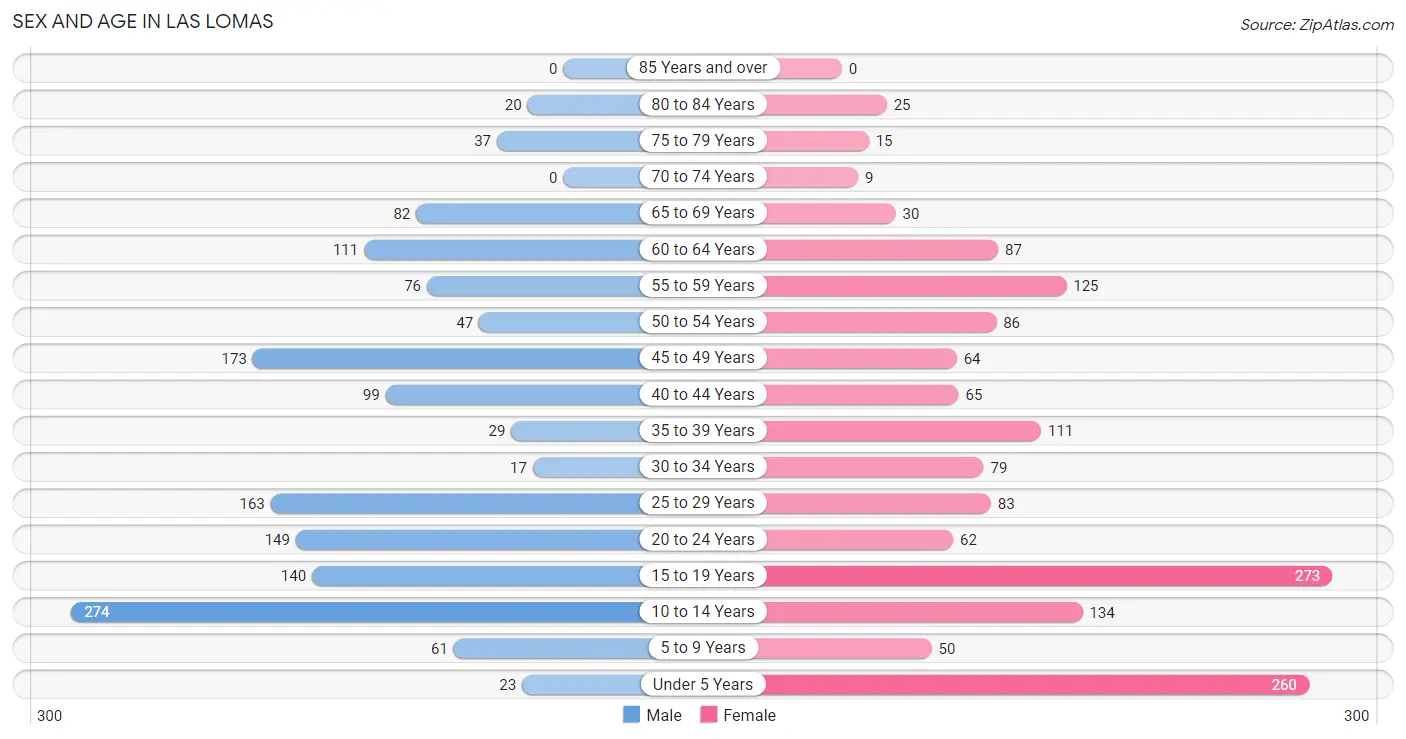
| Age Bracket | Male | Female |
| Under 5 Years | 23 (1.5%) | 260 (16.7%) |
| 5 to 9 Years | 61 (4.1%) | 50 (3.2%) |
| 10 to 14 Years | 274 (18.2%) | 134 (8.6%) |
| 15 to 19 Years | 140 (9.3%) | 273 (17.5%) |
| 20 to 24 Years | 149 (9.9%) | 62 (4.0%) |
| 25 to 29 Years | 163 (10.9%) | 83 (5.3%) |
| 30 to 34 Years | 17 (1.1%) | 79 (5.1%) |
| 35 to 39 Years | 29 (1.9%) | 111 (7.1%) |
| 40 to 44 Years | 99 (6.6%) | 65 (4.2%) |
| 45 to 49 Years | 173 (11.5%) | 64 (4.1%) |
| 50 to 54 Years | 47 (3.1%) | 86 (5.5%) |
| 55 to 59 Years | 76 (5.1%) | 125 (8.0%) |
| 60 to 64 Years | 111 (7.4%) | 87 (5.6%) |
| 65 to 69 Years | 82 (5.5%) | 30 (1.9%) |
| 70 to 74 Years | 0 (0.0%) | 9 (0.6%) |
| 75 to 79 Years | 37 (2.5%) | 15 (1.0%) |
| 80 to 84 Years | 20 (1.3%) | 25 (1.6%) |
| 85 Years and over | 0 (0.0%) | 0 (0.0%) |
| Total | 1,501 (100.0%) | 1,558 (100.0%) |
Families and Households in Las Lomas
Median Family Size in Las Lomas
The median family size in Las Lomas is 4.13 persons per family, with married-couple families (454 | 70.0%) accounting for the largest median family size of 4.31 persons per family. On the other hand, single male/father families (67 | 10.3%) represent the smallest median family size with 3.04 persons per family.
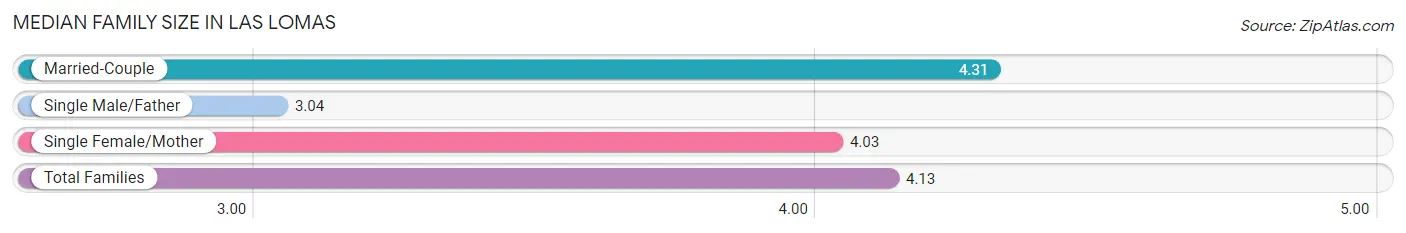
| Family Type | # Families | Family Size |
| Married-Couple | 454 (70.0%) | 4.31 |
| Single Male/Father | 67 (10.3%) | 3.04 |
| Single Female/Mother | 128 (19.7%) | 4.03 |
| Total Families | 649 (100.0%) | 4.13 |
Median Household Size in Las Lomas
The median household size in Las Lomas is 4.28 persons per household, with married-couple households (454 | 63.6%) accounting for the largest median household size of 4.94 persons per household. non-family households (65 | 9.1%) represent the smallest median household size with 1.42 persons per household.
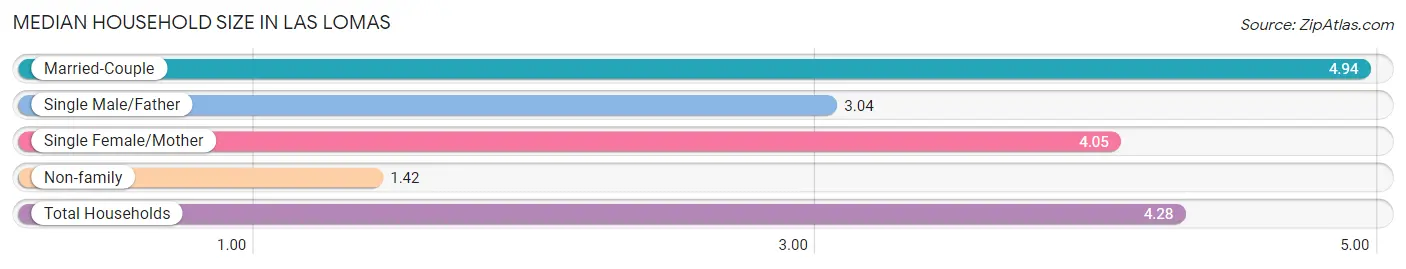
| Household Type | # Households | Household Size |
| Married-Couple | 454 (63.6%) | 4.94 |
| Single Male/Father | 67 (9.4%) | 3.04 |
| Single Female/Mother | 128 (17.9%) | 4.05 |
| Non-family | 65 (9.1%) | 1.42 |
| Total Households | 714 (100.0%) | 4.28 |
Household Size by Marriage Status in Las Lomas
Out of a total of 714 households in Las Lomas, 649 (90.9%) are family households, while 65 (9.1%) are nonfamily households. The most numerous type of family households are 3-person households, comprising 196, and the most common type of nonfamily households are 1-person households, comprising 40.
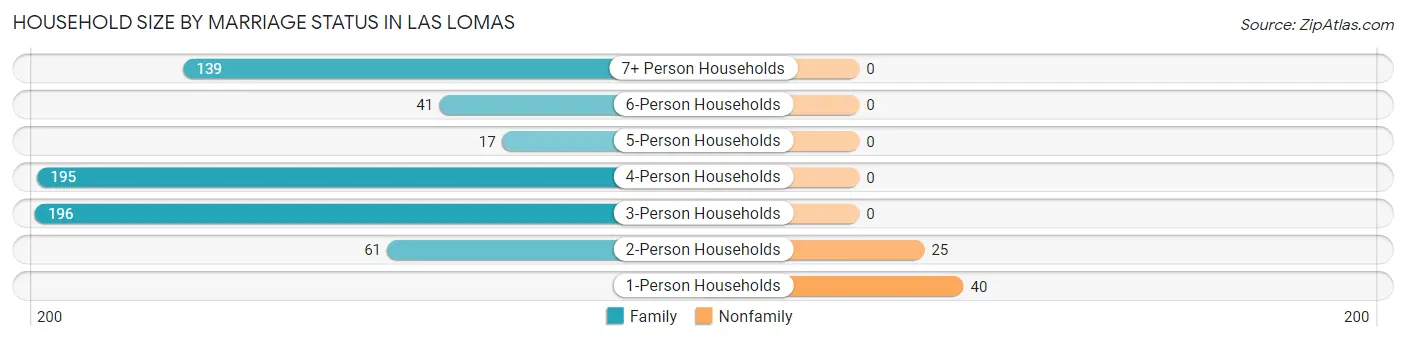
| Household Size | Family Households | Nonfamily Households |
| 1-Person Households | - | 40 (5.6%) |
| 2-Person Households | 61 (8.5%) | 25 (3.5%) |
| 3-Person Households | 196 (27.5%) | 0 (0.0%) |
| 4-Person Households | 195 (27.3%) | 0 (0.0%) |
| 5-Person Households | 17 (2.4%) | 0 (0.0%) |
| 6-Person Households | 41 (5.7%) | 0 (0.0%) |
| 7+ Person Households | 139 (19.5%) | 0 (0.0%) |
| Total | 649 (90.9%) | 65 (9.1%) |
Female Fertility in Las Lomas
Fertility by Age in Las Lomas
Average fertility rate in Las Lomas is 14.0 births per 1,000 women. Women in the age bracket of 20 to 34 years have the highest fertility rate with 45.0 births per 1,000 women. Women in the age bracket of 20 to 34 years acount for 100.0% of all women with births.
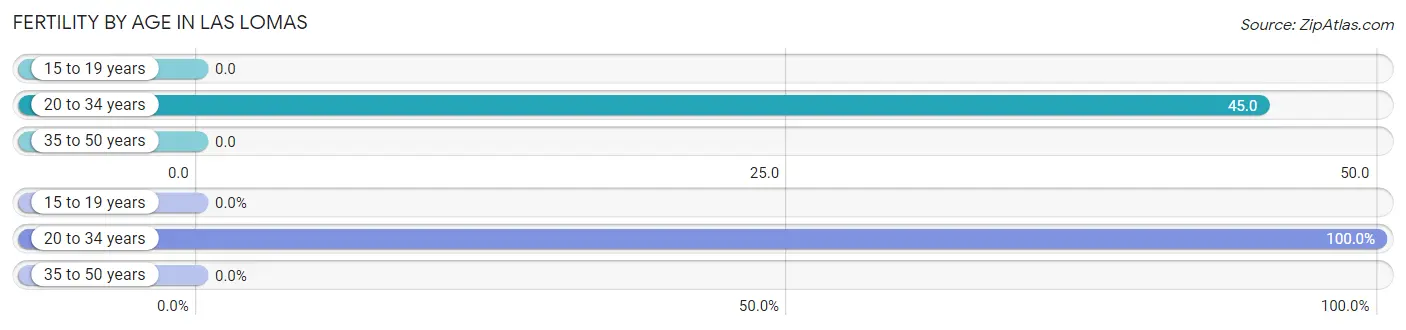
| Age Bracket | Women with Births | Births / 1,000 Women |
| 15 to 19 years | 0 (0.0%) | 0.0 |
| 20 to 34 years | 10 (100.0%) | 45.0 |
| 35 to 50 years | 0 (0.0%) | 0.0 |
| Total | 10 (100.0%) | 14.0 |
Fertility by Age by Marriage Status in Las Lomas
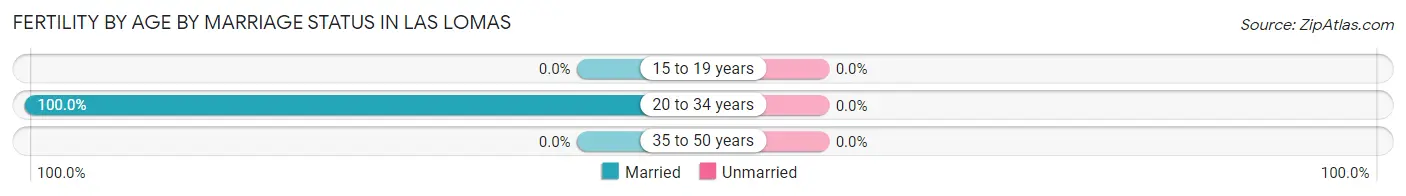
| Age Bracket | Married | Unmarried |
| 15 to 19 years | 0 (0.0%) | 0 (0.0%) |
| 20 to 34 years | 10 (100.0%) | 0 (0.0%) |
| 35 to 50 years | 0 (0.0%) | 0 (0.0%) |
| Total | 10 (100.0%) | 0 (0.0%) |
Fertility by Education in Las Lomas
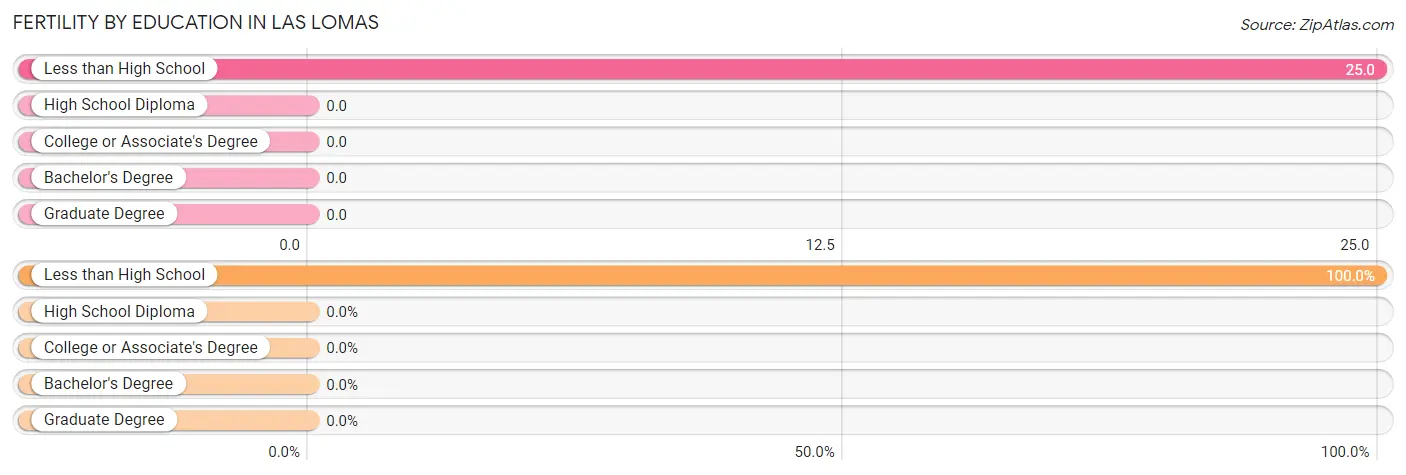
| Educational Attainment | Women with Births | Births / 1,000 Women |
| Less than High School | 10 (100.0%) | 25.0 |
| High School Diploma | 0 (0.0%) | 0.0 |
| College or Associate's Degree | 0 (0.0%) | 0.0 |
| Bachelor's Degree | 0 (0.0%) | 0.0 |
| Graduate Degree | 0 (0.0%) | 0.0 |
| Total | 10 (100.0%) | 14.0 |
Fertility by Education by Marriage Status in Las Lomas
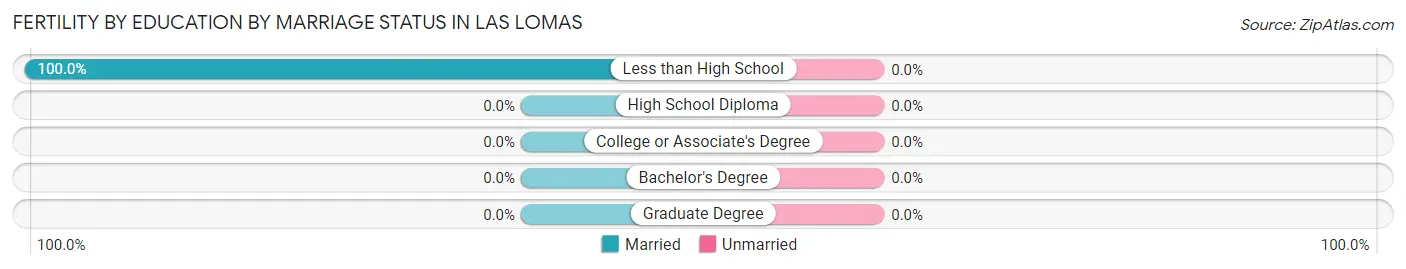
| Educational Attainment | Married | Unmarried |
| Less than High School | 10 (100.0%) | 0 (0.0%) |
| High School Diploma | 0 (0.0%) | 0 (0.0%) |
| College or Associate's Degree | 0 (0.0%) | 0 (0.0%) |
| Bachelor's Degree | 0 (0.0%) | 0 (0.0%) |
| Graduate Degree | 0 (0.0%) | 0 (0.0%) |
| Total | 10 (100.0%) | 0 (0.0%) |
Employment Characteristics in Las Lomas
Employment by Class of Employer in Las Lomas
Among the 1,391 employed individuals in Las Lomas, private company employees (1,000 | 71.9%), local government employees (157 | 11.3%), and self-employed (not incorporated) (140 | 10.1%) make up the most common classes of employment.
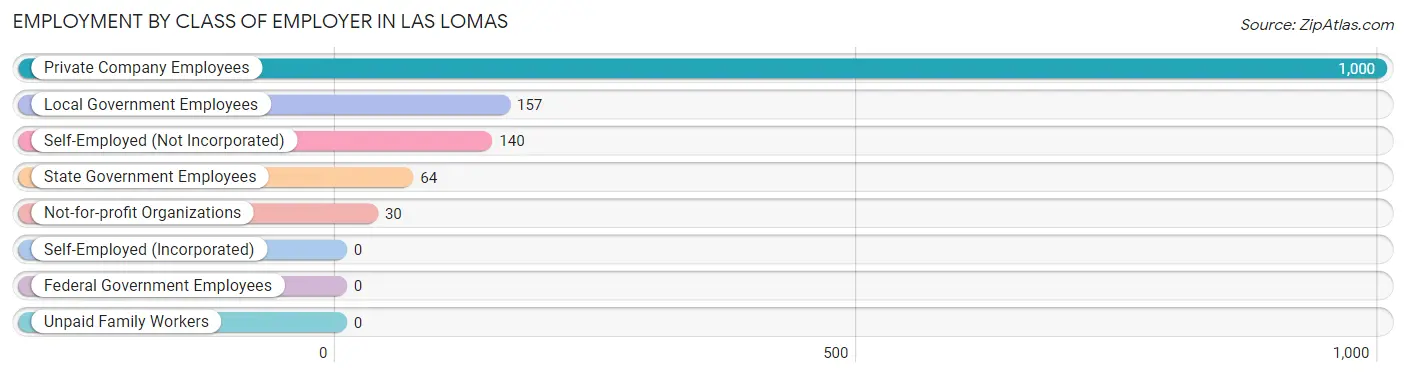
| Employer Class | # Employees | % Employees |
| Private Company Employees | 1,000 | 71.9% |
| Self-Employed (Incorporated) | 0 | 0.0% |
| Self-Employed (Not Incorporated) | 140 | 10.1% |
| Not-for-profit Organizations | 30 | 2.2% |
| Local Government Employees | 157 | 11.3% |
| State Government Employees | 64 | 4.6% |
| Federal Government Employees | 0 | 0.0% |
| Unpaid Family Workers | 0 | 0.0% |
| Total | 1,391 | 100.0% |
Employment Status by Age in Las Lomas
According to the labor force statistics for Las Lomas, out of the total population over 16 years of age (2,214), 65.6% or 1,452 individuals are in the labor force, with 3.1% or 45 of them unemployed. The age group with the highest labor force participation rate is 25 to 29 years, with 100.0% or 246 individuals in the labor force. Within the labor force, the 45 to 54 years age range has the highest percentage of unemployed individuals, with 13.4% or 45 of them being unemployed.
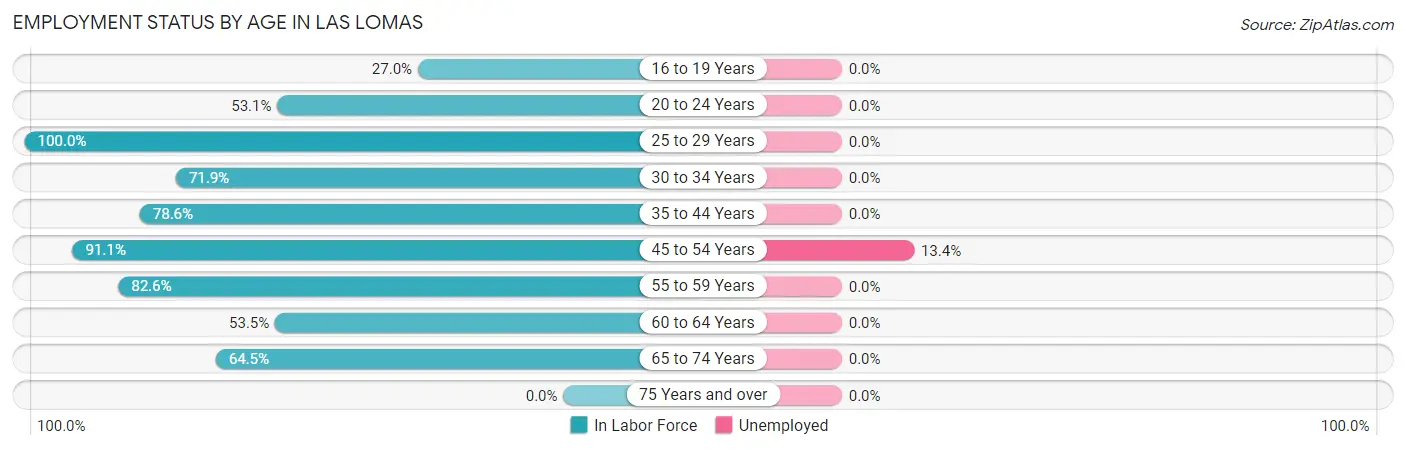
| Age Bracket | In Labor Force | Unemployed |
| 16 to 19 Years | 100 (27.0%) | 0 (0.0%) |
| 20 to 24 Years | 112 (53.1%) | 0 (0.0%) |
| 25 to 29 Years | 246 (100.0%) | 0 (0.0%) |
| 30 to 34 Years | 69 (71.9%) | 0 (0.0%) |
| 35 to 44 Years | 239 (78.6%) | 0 (0.0%) |
| 45 to 54 Years | 337 (91.1%) | 45 (13.4%) |
| 55 to 59 Years | 166 (82.6%) | 0 (0.0%) |
| 60 to 64 Years | 106 (53.5%) | 0 (0.0%) |
| 65 to 74 Years | 78 (64.5%) | 0 (0.0%) |
| 75 Years and over | 0 (0.0%) | 0 (0.0%) |
| Total | 1,452 (65.6%) | 45 (3.1%) |
Employment Status by Educational Attainment in Las Lomas
According to labor force statistics for Las Lomas, 82.2% of individuals (1,163) out of the total population between 25 and 64 years of age (1,415) are in the labor force, with 3.9% or 45 of them being unemployed. The group with the highest labor force participation rate are those with the educational attainment of college / associate degree, with 98.9% or 280 individuals in the labor force. Within the labor force, individuals with less than high school education have the highest percentage of unemployment, with 7.1% or 39 of them being unemployed.
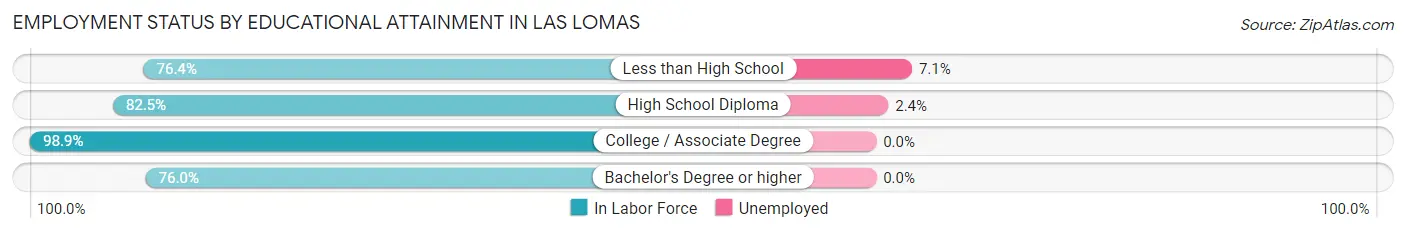
| Educational Attainment | In Labor Force | Unemployed |
| Less than High School | 550 (76.4%) | 51 (7.1%) |
| High School Diploma | 254 (82.5%) | 7 (2.4%) |
| College / Associate Degree | 280 (98.9%) | 0 (0.0%) |
| Bachelor's Degree or higher | 79 (76.0%) | 0 (0.0%) |
| Total | 1,163 (82.2%) | 55 (3.9%) |
Employment Occupations by Sex in Las Lomas
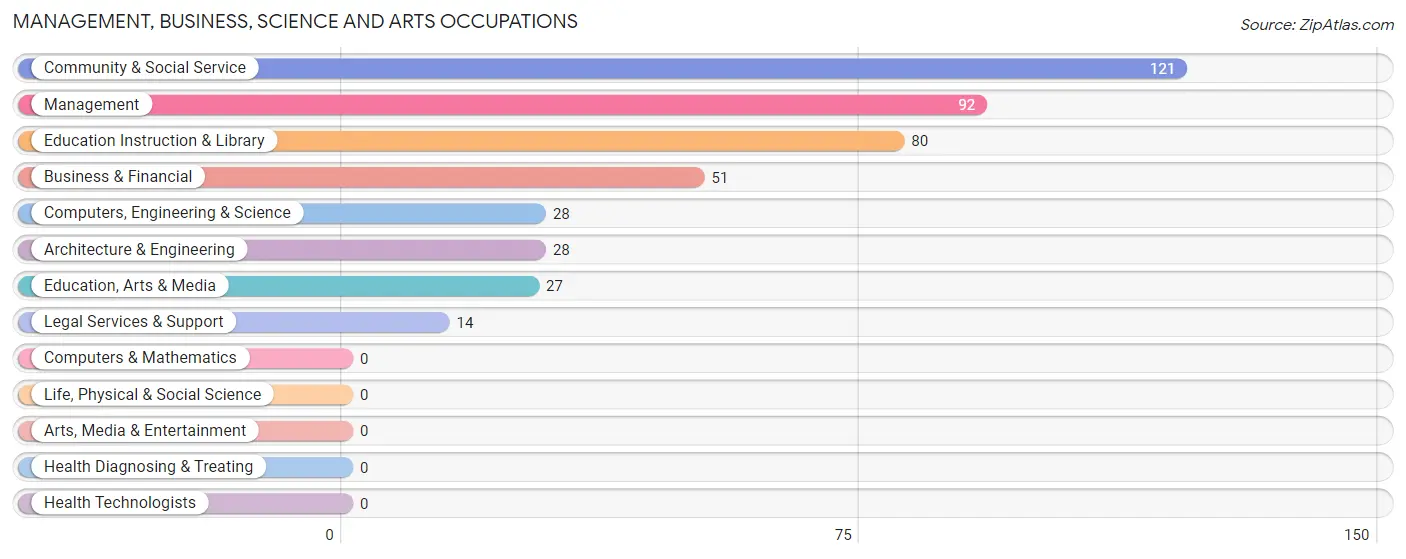
Management, Business, Science and Arts Occupations
The most common Management, Business, Science and Arts occupations in Las Lomas are Community & Social Service (121 | 8.6%), Management (92 | 6.5%), Education Instruction & Library (80 | 5.7%), Business & Financial (51 | 3.6%), and Computers, Engineering & Science (28 | 2.0%).
Management, Business, Science and Arts Occupations by Sex
Within the Management, Business, Science and Arts occupations in Las Lomas, the most male-oriented occupations are Computers, Engineering & Science (100.0%), Architecture & Engineering (100.0%), and Legal Services & Support (100.0%), while the most female-oriented occupations are Business & Financial (100.0%), Education, Arts & Media (100.0%), and Community & Social Service (36.4%).
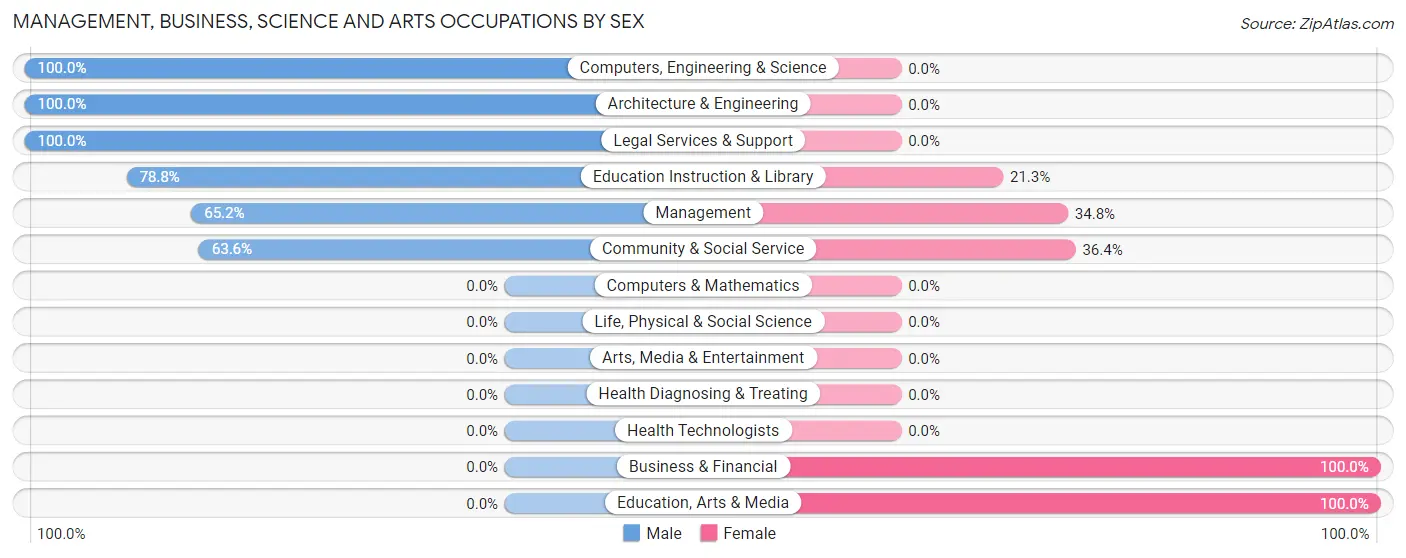
| Occupation | Male | Female |
| Management | 60 (65.2%) | 32 (34.8%) |
| Business & Financial | 0 (0.0%) | 51 (100.0%) |
| Computers, Engineering & Science | 28 (100.0%) | 0 (0.0%) |
| Computers & Mathematics | 0 (0.0%) | 0 (0.0%) |
| Architecture & Engineering | 28 (100.0%) | 0 (0.0%) |
| Life, Physical & Social Science | 0 (0.0%) | 0 (0.0%) |
| Community & Social Service | 77 (63.6%) | 44 (36.4%) |
| Education, Arts & Media | 0 (0.0%) | 27 (100.0%) |
| Legal Services & Support | 14 (100.0%) | 0 (0.0%) |
| Education Instruction & Library | 63 (78.7%) | 17 (21.2%) |
| Arts, Media & Entertainment | 0 (0.0%) | 0 (0.0%) |
| Health Diagnosing & Treating | 0 (0.0%) | 0 (0.0%) |
| Health Technologists | 0 (0.0%) | 0 (0.0%) |
| Total (Category) | 165 (56.5%) | 127 (43.5%) |
| Total (Overall) | 837 (59.5%) | 571 (40.6%) |
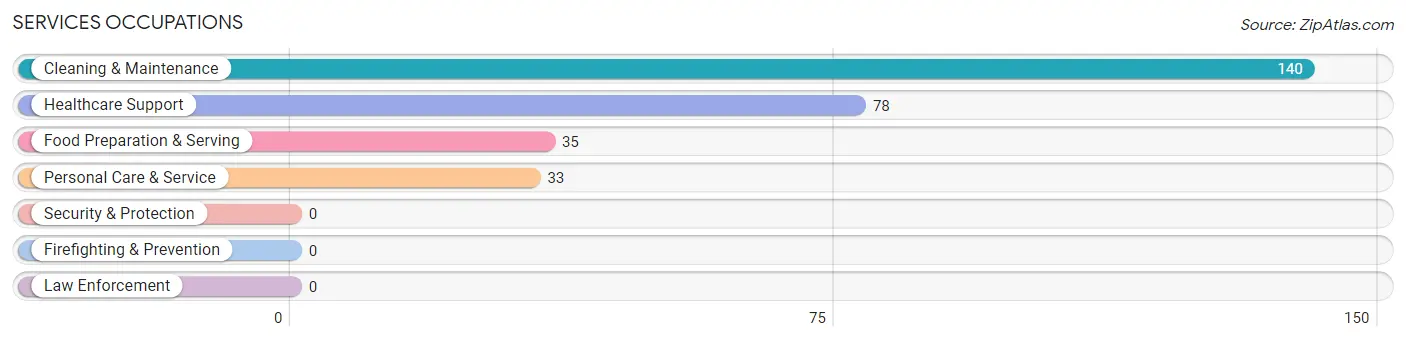
Services Occupations
The most common Services occupations in Las Lomas are Cleaning & Maintenance (140 | 9.9%), Healthcare Support (78 | 5.5%), Food Preparation & Serving (35 | 2.5%), and Personal Care & Service (33 | 2.3%).
Services Occupations by Sex
Within the Services occupations in Las Lomas, the most male-oriented occupations are Cleaning & Maintenance (100.0%), and Healthcare Support (37.2%), while the most female-oriented occupations are Food Preparation & Serving (100.0%), Personal Care & Service (100.0%), and Healthcare Support (62.8%).
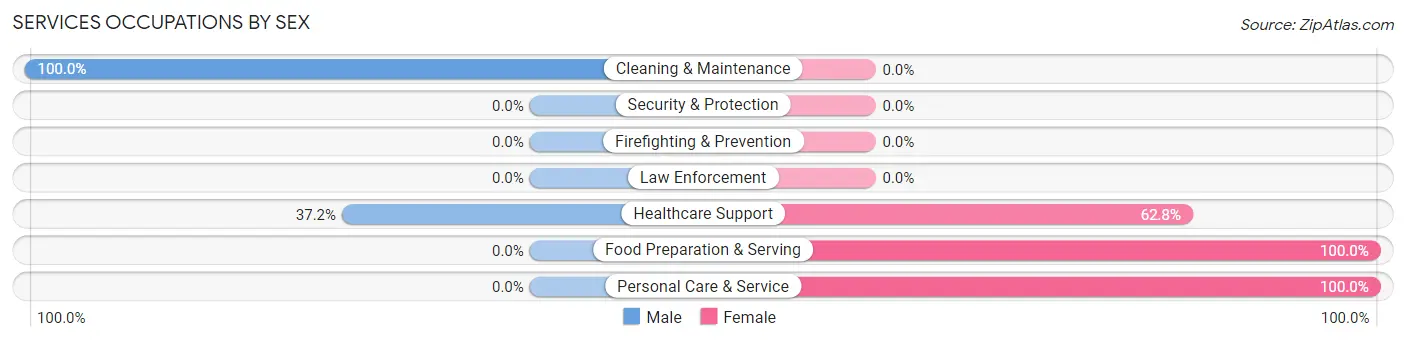
| Occupation | Male | Female |
| Healthcare Support | 29 (37.2%) | 49 (62.8%) |
| Security & Protection | 0 (0.0%) | 0 (0.0%) |
| Firefighting & Prevention | 0 (0.0%) | 0 (0.0%) |
| Law Enforcement | 0 (0.0%) | 0 (0.0%) |
| Food Preparation & Serving | 0 (0.0%) | 35 (100.0%) |
| Cleaning & Maintenance | 140 (100.0%) | 0 (0.0%) |
| Personal Care & Service | 0 (0.0%) | 33 (100.0%) |
| Total (Category) | 169 (59.1%) | 117 (40.9%) |
| Total (Overall) | 837 (59.5%) | 571 (40.6%) |
Sales and Office Occupations
The most common Sales and Office occupations in Las Lomas are Office & Administration (297 | 21.1%), and Sales & Related (14 | 1.0%).
Sales and Office Occupations by Sex
| Occupation | Male | Female |
| Sales & Related | 14 (100.0%) | 0 (0.0%) |
| Office & Administration | 173 (58.3%) | 124 (41.7%) |
| Total (Category) | 187 (60.1%) | 124 (39.9%) |
| Total (Overall) | 837 (59.5%) | 571 (40.6%) |
Natural Resources, Construction and Maintenance Occupations
The most common Natural Resources, Construction and Maintenance occupations in Las Lomas are Farming, Fishing & Forestry (260 | 18.5%), Installation, Maintenance & Repair (94 | 6.7%), and Construction & Extraction (71 | 5.0%).
Natural Resources, Construction and Maintenance Occupations by Sex
| Occupation | Male | Female |
| Farming, Fishing & Forestry | 89 (34.2%) | 171 (65.8%) |
| Construction & Extraction | 71 (100.0%) | 0 (0.0%) |
| Installation, Maintenance & Repair | 94 (100.0%) | 0 (0.0%) |
| Total (Category) | 254 (59.8%) | 171 (40.2%) |
| Total (Overall) | 837 (59.5%) | 571 (40.6%) |
Production, Transportation and Moving Occupations
The most common Production, Transportation and Moving occupations in Las Lomas are Material Moving (75 | 5.3%), and Transportation (19 | 1.3%).
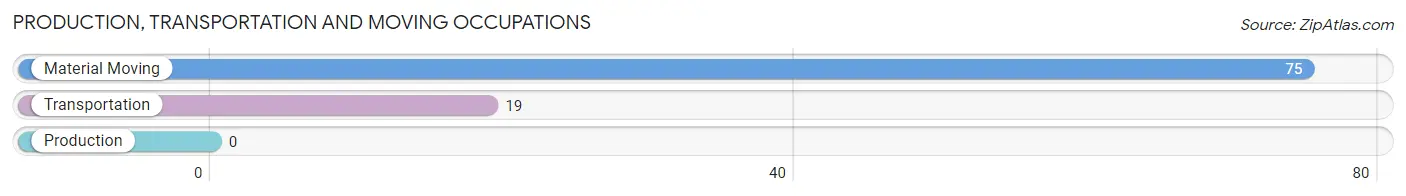
Production, Transportation and Moving Occupations by Sex
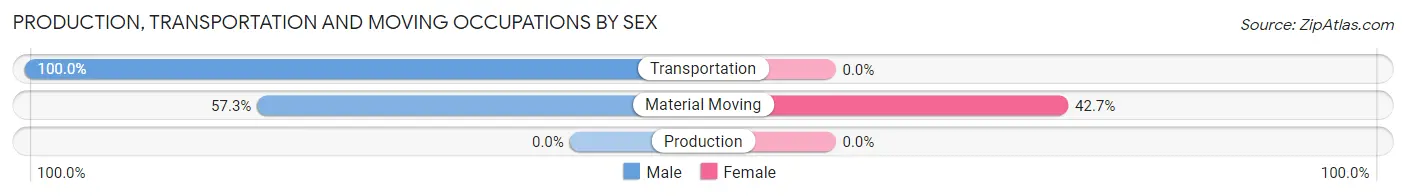
| Occupation | Male | Female |
| Production | 0 (0.0%) | 0 (0.0%) |
| Transportation | 19 (100.0%) | 0 (0.0%) |
| Material Moving | 43 (57.3%) | 32 (42.7%) |
| Total (Category) | 62 (66.0%) | 32 (34.0%) |
| Total (Overall) | 837 (59.5%) | 571 (40.6%) |
Employment Industries by Sex in Las Lomas
Employment Industries in Las Lomas
The major employment industries in Las Lomas include Agriculture, Fishing & Hunting (307 | 21.8%), Retail Trade (220 | 15.6%), Administrative & Support (98 | 7.0%), Health Care & Social Assistance (94 | 6.7%), and Construction (90 | 6.4%).
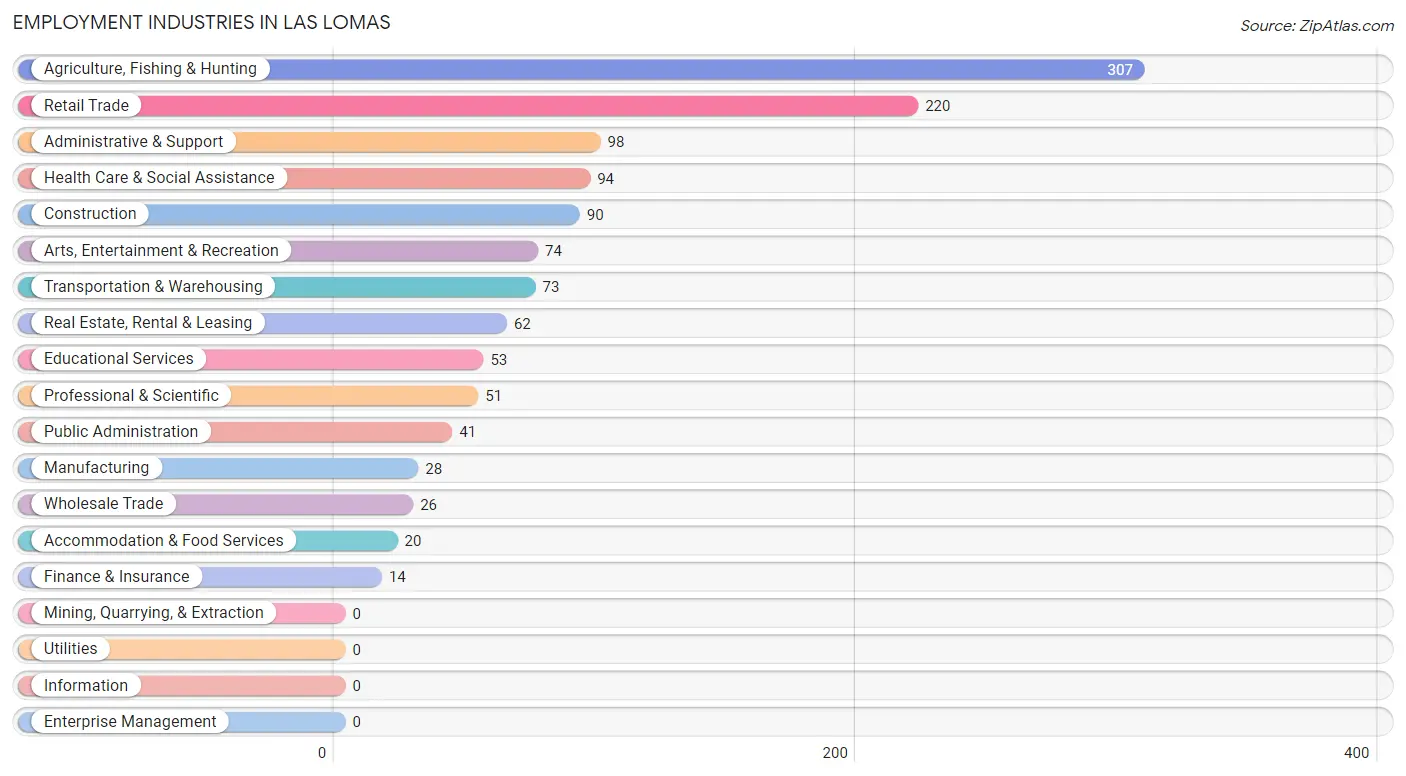
Employment Industries by Sex in Las Lomas
The Las Lomas industries that see more men than women are Construction (100.0%), Manufacturing (100.0%), and Wholesale Trade (100.0%), whereas the industries that tend to have a higher number of women are Professional & Scientific (100.0%), Accommodation & Food Services (100.0%), and Educational Services (81.1%).
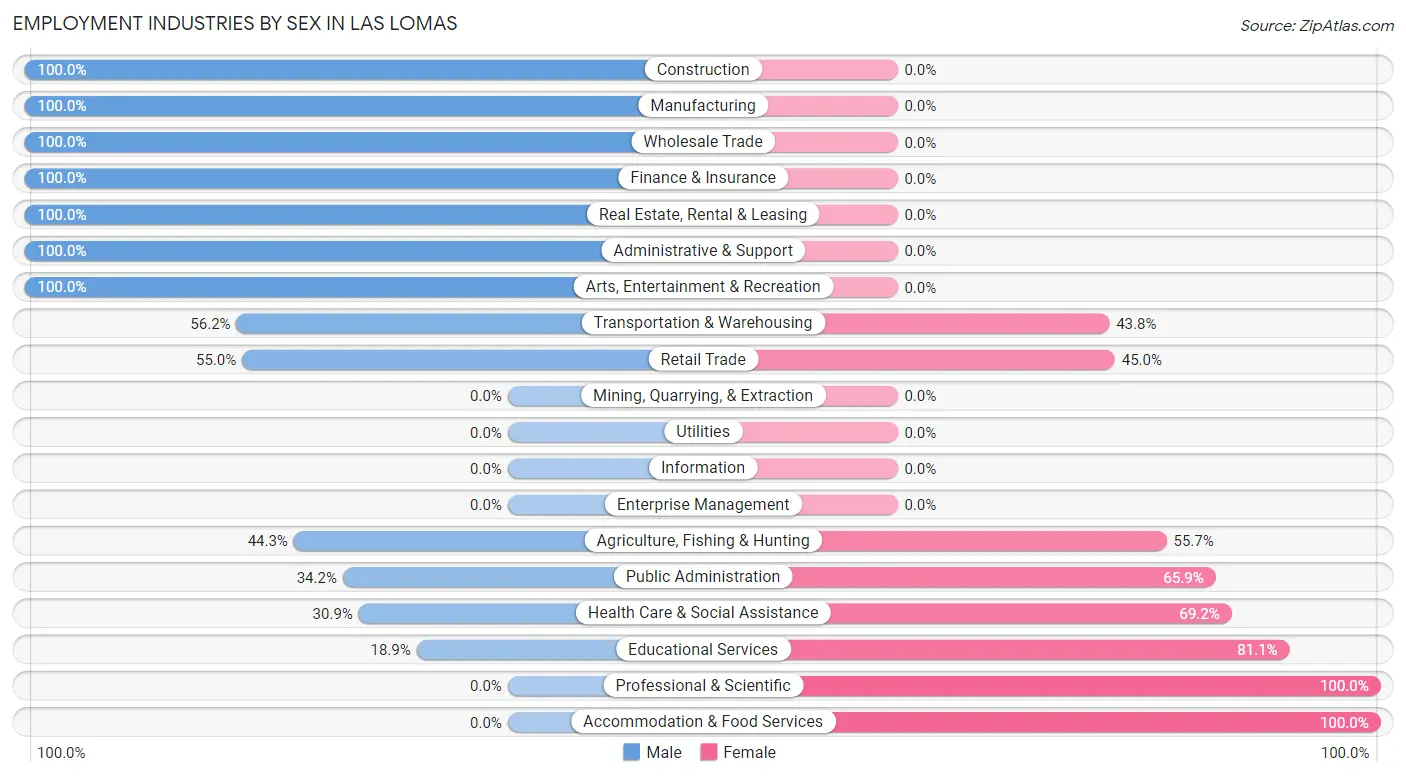
| Industry | Male | Female |
| Agriculture, Fishing & Hunting | 136 (44.3%) | 171 (55.7%) |
| Mining, Quarrying, & Extraction | 0 (0.0%) | 0 (0.0%) |
| Construction | 90 (100.0%) | 0 (0.0%) |
| Manufacturing | 28 (100.0%) | 0 (0.0%) |
| Wholesale Trade | 26 (100.0%) | 0 (0.0%) |
| Retail Trade | 121 (55.0%) | 99 (45.0%) |
| Transportation & Warehousing | 41 (56.2%) | 32 (43.8%) |
| Utilities | 0 (0.0%) | 0 (0.0%) |
| Information | 0 (0.0%) | 0 (0.0%) |
| Finance & Insurance | 14 (100.0%) | 0 (0.0%) |
| Real Estate, Rental & Leasing | 62 (100.0%) | 0 (0.0%) |
| Professional & Scientific | 0 (0.0%) | 51 (100.0%) |
| Enterprise Management | 0 (0.0%) | 0 (0.0%) |
| Administrative & Support | 98 (100.0%) | 0 (0.0%) |
| Educational Services | 10 (18.9%) | 43 (81.1%) |
| Health Care & Social Assistance | 29 (30.8%) | 65 (69.2%) |
| Arts, Entertainment & Recreation | 74 (100.0%) | 0 (0.0%) |
| Accommodation & Food Services | 0 (0.0%) | 20 (100.0%) |
| Public Administration | 14 (34.2%) | 27 (65.8%) |
| Total | 837 (59.5%) | 571 (40.6%) |
Education in Las Lomas
School Enrollment in Las Lomas
The most common levels of schooling among the 1,151 students in Las Lomas are high school (426 | 37.0%), college / undergraduate (279 | 24.2%), and middle school (205 | 17.8%).
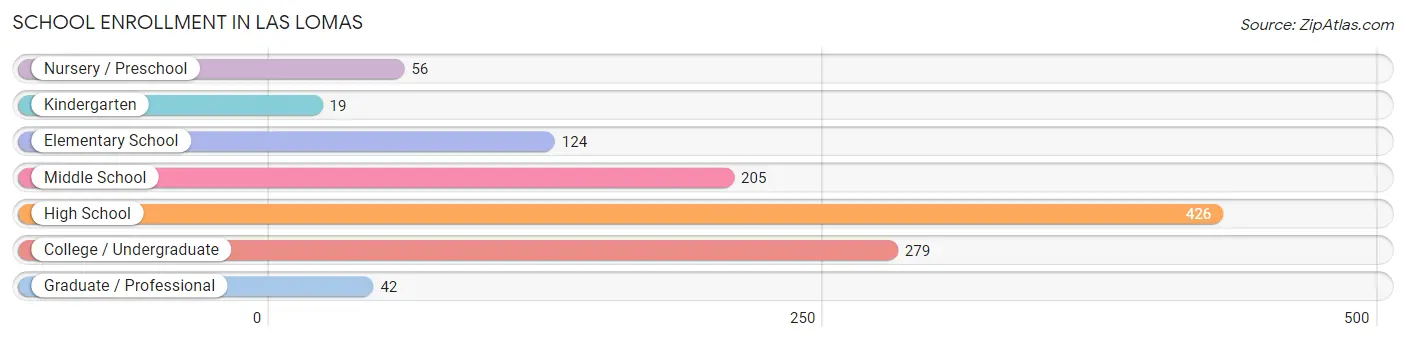
| School Level | # Students | % Students |
| Nursery / Preschool | 56 | 4.9% |
| Kindergarten | 19 | 1.7% |
| Elementary School | 124 | 10.8% |
| Middle School | 205 | 17.8% |
| High School | 426 | 37.0% |
| College / Undergraduate | 279 | 24.2% |
| Graduate / Professional | 42 | 3.6% |
| Total | 1,151 | 100.0% |
School Enrollment by Age by Funding Source in Las Lomas
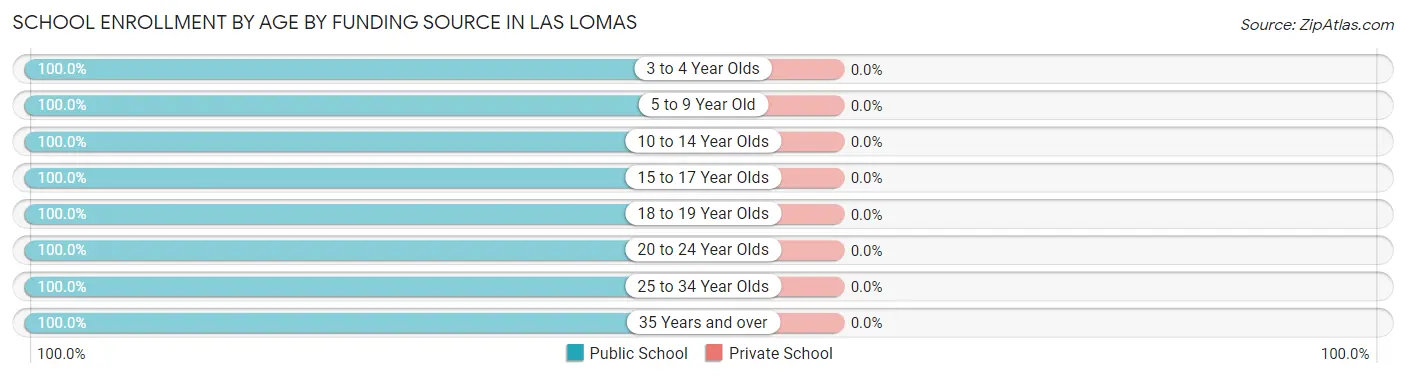
| Age Bracket | Public School | Private School |
| 3 to 4 Year Olds | 56 (100.0%) | 0 (0.0%) |
| 5 to 9 Year Old | 111 (100.0%) | 0 (0.0%) |
| 10 to 14 Year Olds | 408 (100.0%) | 0 (0.0%) |
| 15 to 17 Year Olds | 240 (100.0%) | 0 (0.0%) |
| 18 to 19 Year Olds | 173 (100.0%) | 0 (0.0%) |
| 20 to 24 Year Olds | 100 (100.0%) | 0 (0.0%) |
| 25 to 34 Year Olds | 62 (100.0%) | 0 (0.0%) |
| 35 Years and over | 1 (100.0%) | 0 (0.0%) |
| Total | 1,151 (100.0%) | 0 (0.0%) |
Educational Attainment by Field of Study in Las Lomas
Liberal arts & history (47 | 45.2%), engineering (28 | 26.9%), social sciences (15 | 14.4%), and computers & mathematics (14 | 13.5%) are the most common fields of study among 104 individuals in Las Lomas who have obtained a bachelor's degree or higher.
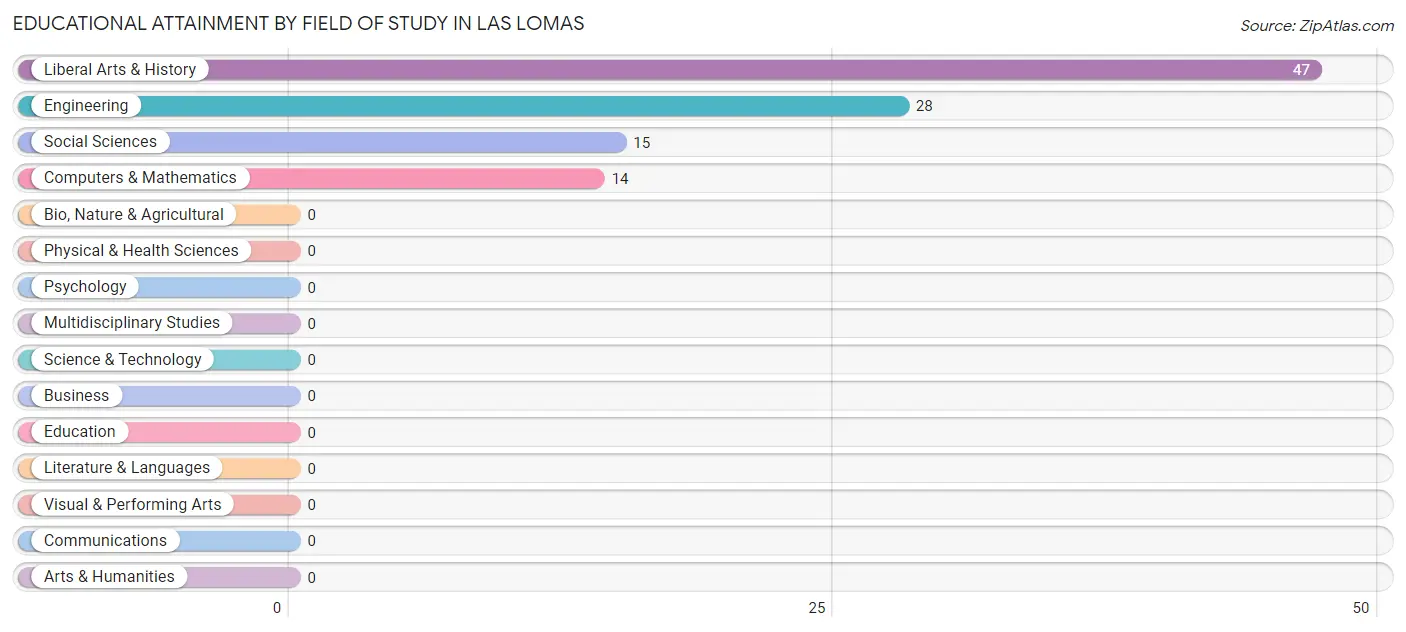
| Field of Study | # Graduates | % Graduates |
| Computers & Mathematics | 14 | 13.5% |
| Bio, Nature & Agricultural | 0 | 0.0% |
| Physical & Health Sciences | 0 | 0.0% |
| Psychology | 0 | 0.0% |
| Social Sciences | 15 | 14.4% |
| Engineering | 28 | 26.9% |
| Multidisciplinary Studies | 0 | 0.0% |
| Science & Technology | 0 | 0.0% |
| Business | 0 | 0.0% |
| Education | 0 | 0.0% |
| Literature & Languages | 0 | 0.0% |
| Liberal Arts & History | 47 | 45.2% |
| Visual & Performing Arts | 0 | 0.0% |
| Communications | 0 | 0.0% |
| Arts & Humanities | 0 | 0.0% |
| Total | 104 | 100.0% |
Transportation & Commute in Las Lomas
Vehicle Availability by Sex in Las Lomas
The most prevalent vehicle ownership categories in Las Lomas are males with 5 or more vehicles (294, accounting for 35.8%) and females with 5 or more vehicles (213, making up 51.5%).
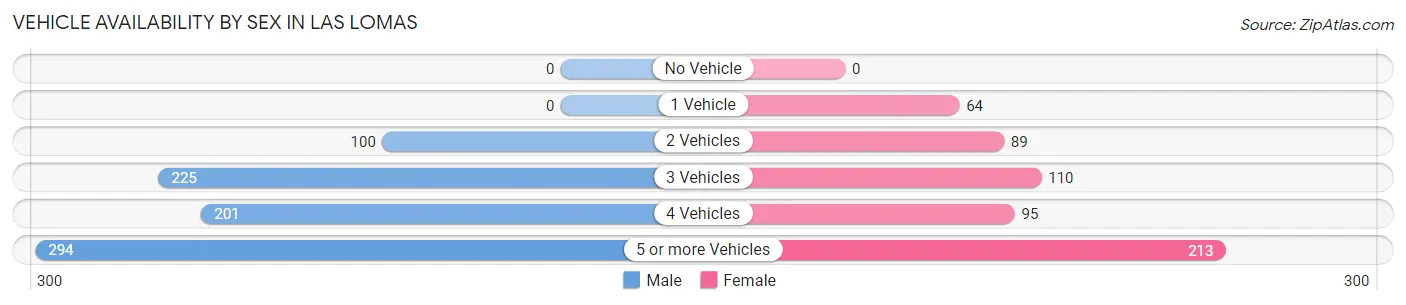
| Vehicles Available | Male | Female |
| No Vehicle | 0 (0.0%) | 0 (0.0%) |
| 1 Vehicle | 0 (0.0%) | 64 (11.2%) |
| 2 Vehicles | 100 (12.2%) | 89 (15.6%) |
| 3 Vehicles | 225 (27.4%) | 110 (19.3%) |
| 4 Vehicles | 201 (24.5%) | 95 (16.6%) |
| 5 or more Vehicles | 294 (35.8%) | 213 (37.3%) |
| Total | 820 (100.0%) | 571 (100.0%) |
Commute Time in Las Lomas
The most frequently occuring commute durations in Las Lomas are 15 to 19 minutes (362 commuters, 26.6%), 30 to 34 minutes (243 commuters, 17.8%), and 45 to 59 minutes (170 commuters, 12.5%).
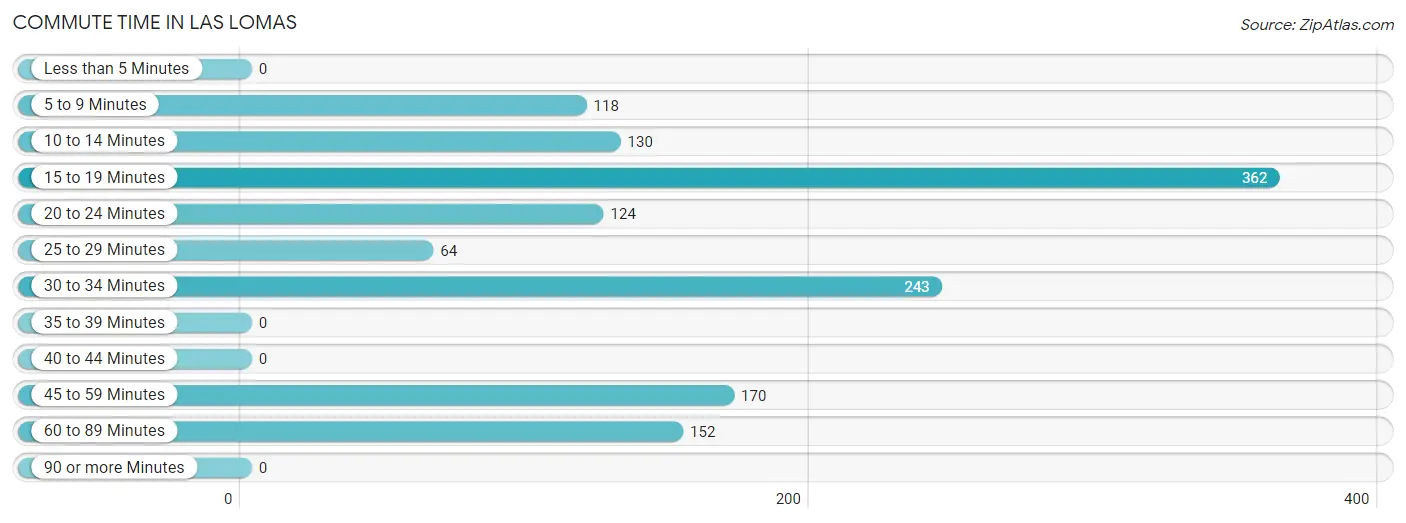
| Commute Time | # Commuters | % Commuters |
| Less than 5 Minutes | 0 | 0.0% |
| 5 to 9 Minutes | 118 | 8.7% |
| 10 to 14 Minutes | 130 | 9.5% |
| 15 to 19 Minutes | 362 | 26.6% |
| 20 to 24 Minutes | 124 | 9.1% |
| 25 to 29 Minutes | 64 | 4.7% |
| 30 to 34 Minutes | 243 | 17.8% |
| 35 to 39 Minutes | 0 | 0.0% |
| 40 to 44 Minutes | 0 | 0.0% |
| 45 to 59 Minutes | 170 | 12.5% |
| 60 to 89 Minutes | 152 | 11.2% |
| 90 or more Minutes | 0 | 0.0% |
Commute Time by Sex in Las Lomas
The most common commute times in Las Lomas are 15 to 19 minutes (259 commuters, 31.6%) for males and 15 to 19 minutes (103 commuters, 19.0%) for females.
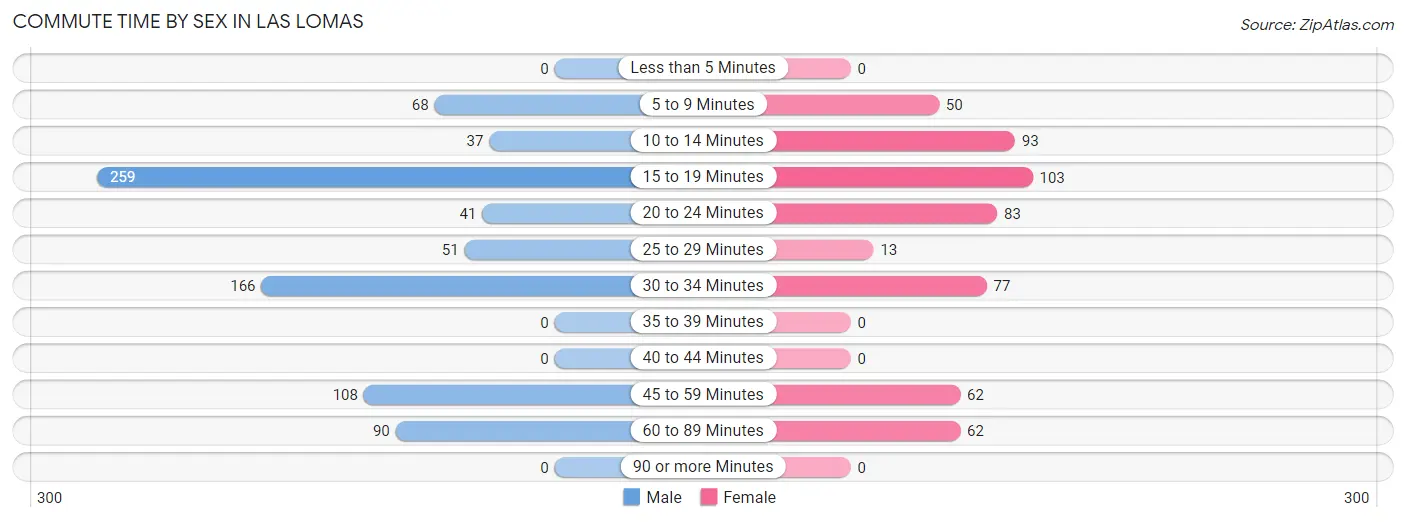
| Commute Time | Male | Female |
| Less than 5 Minutes | 0 (0.0%) | 0 (0.0%) |
| 5 to 9 Minutes | 68 (8.3%) | 50 (9.2%) |
| 10 to 14 Minutes | 37 (4.5%) | 93 (17.1%) |
| 15 to 19 Minutes | 259 (31.6%) | 103 (19.0%) |
| 20 to 24 Minutes | 41 (5.0%) | 83 (15.3%) |
| 25 to 29 Minutes | 51 (6.2%) | 13 (2.4%) |
| 30 to 34 Minutes | 166 (20.2%) | 77 (14.2%) |
| 35 to 39 Minutes | 0 (0.0%) | 0 (0.0%) |
| 40 to 44 Minutes | 0 (0.0%) | 0 (0.0%) |
| 45 to 59 Minutes | 108 (13.2%) | 62 (11.4%) |
| 60 to 89 Minutes | 90 (11.0%) | 62 (11.4%) |
| 90 or more Minutes | 0 (0.0%) | 0 (0.0%) |
Time of Departure to Work by Sex in Las Lomas
The most frequent times of departure to work in Las Lomas are 12:00 AM to 4:59 AM (174, 21.2%) for males and 10:00 AM to 10:59 AM (142, 26.2%) for females.
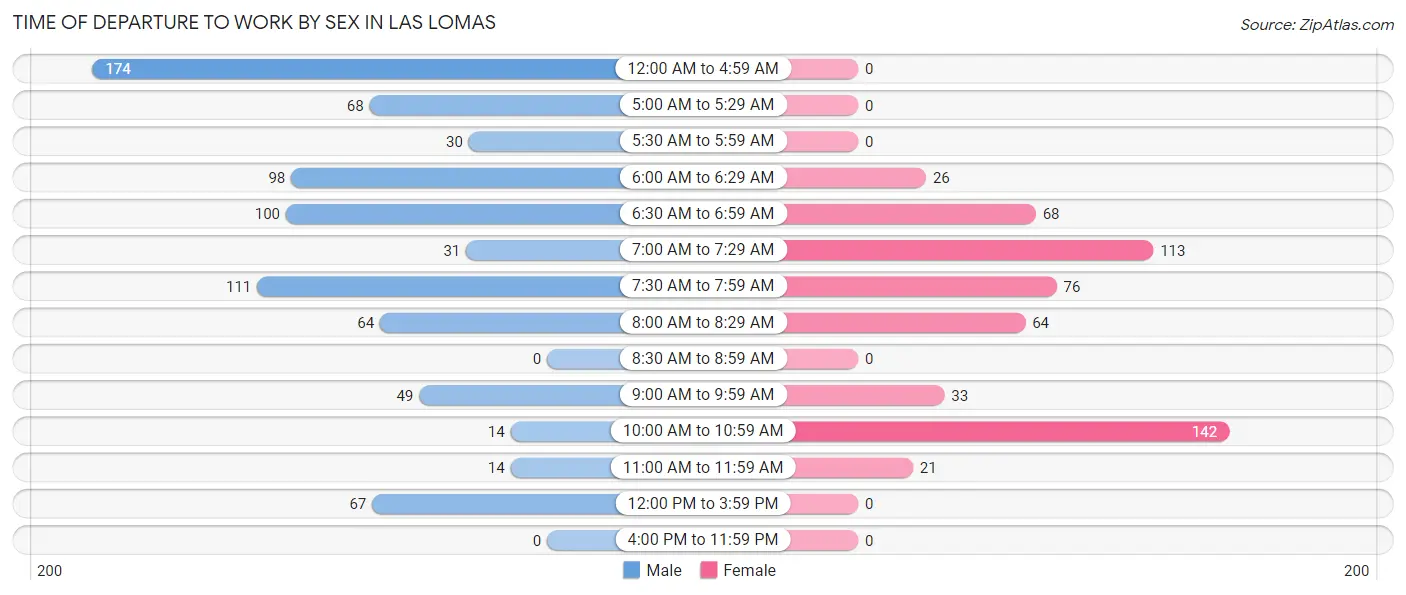
| Time of Departure | Male | Female |
| 12:00 AM to 4:59 AM | 174 (21.2%) | 0 (0.0%) |
| 5:00 AM to 5:29 AM | 68 (8.3%) | 0 (0.0%) |
| 5:30 AM to 5:59 AM | 30 (3.7%) | 0 (0.0%) |
| 6:00 AM to 6:29 AM | 98 (11.9%) | 26 (4.8%) |
| 6:30 AM to 6:59 AM | 100 (12.2%) | 68 (12.5%) |
| 7:00 AM to 7:29 AM | 31 (3.8%) | 113 (20.8%) |
| 7:30 AM to 7:59 AM | 111 (13.5%) | 76 (14.0%) |
| 8:00 AM to 8:29 AM | 64 (7.8%) | 64 (11.8%) |
| 8:30 AM to 8:59 AM | 0 (0.0%) | 0 (0.0%) |
| 9:00 AM to 9:59 AM | 49 (6.0%) | 33 (6.1%) |
| 10:00 AM to 10:59 AM | 14 (1.7%) | 142 (26.2%) |
| 11:00 AM to 11:59 AM | 14 (1.7%) | 21 (3.9%) |
| 12:00 PM to 3:59 PM | 67 (8.2%) | 0 (0.0%) |
| 4:00 PM to 11:59 PM | 0 (0.0%) | 0 (0.0%) |
| Total | 820 (100.0%) | 543 (100.0%) |
Housing Occupancy in Las Lomas
Occupancy by Ownership in Las Lomas
Of the total 714 dwellings in Las Lomas, owner-occupied units account for 418 (58.5%), while renter-occupied units make up 296 (41.5%).
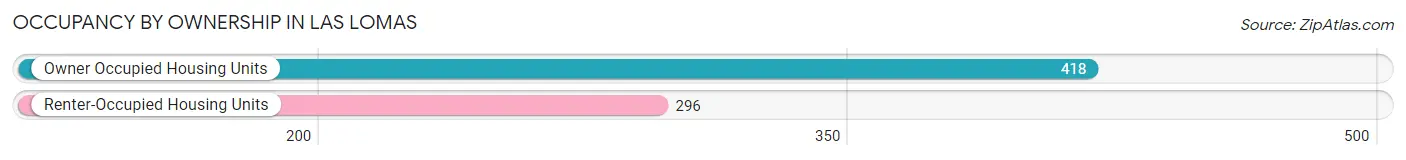
| Occupancy | # Housing Units | % Housing Units |
| Owner Occupied Housing Units | 418 | 58.5% |
| Renter-Occupied Housing Units | 296 | 41.5% |
| Total Occupied Housing Units | 714 | 100.0% |
Occupancy by Household Size in Las Lomas
| Household Size | # Housing Units | % Housing Units |
| 1-Person Household | 40 | 5.6% |
| 2-Person Household | 86 | 12.0% |
| 3-Person Household | 196 | 27.5% |
| 4+ Person Household | 392 | 54.9% |
| Total Housing Units | 714 | 100.0% |
Occupancy by Ownership by Household Size in Las Lomas
| Household Size | Owner-occupied | Renter-occupied |
| 1-Person Household | 10 (25.0%) | 30 (75.0%) |
| 2-Person Household | 86 (100.0%) | 0 (0.0%) |
| 3-Person Household | 23 (11.7%) | 173 (88.3%) |
| 4+ Person Household | 299 (76.3%) | 93 (23.7%) |
| Total Housing Units | 418 (58.5%) | 296 (41.5%) |
Occupancy by Educational Attainment in Las Lomas
| Household Size | Owner-occupied | Renter-occupied |
| Less than High School | 242 (57.9%) | 176 (42.1%) |
| High School Diploma | 63 (51.6%) | 59 (48.4%) |
| College/Associate Degree | 76 (55.9%) | 60 (44.1%) |
| Bachelor's Degree or higher | 37 (97.4%) | 1 (2.6%) |
Occupancy by Age of Householder in Las Lomas
| Age Bracket | # Households | % Households |
| Under 35 Years | 27 | 3.8% |
| 35 to 44 Years | 197 | 27.6% |
| 45 to 54 Years | 152 | 21.3% |
| 55 to 64 Years | 237 | 33.2% |
| 65 to 74 Years | 70 | 9.8% |
| 75 to 84 Years | 31 | 4.3% |
| 85 Years and Over | 0 | 0.0% |
| Total | 714 | 100.0% |
Housing Finances in Las Lomas
Median Income by Occupancy in Las Lomas
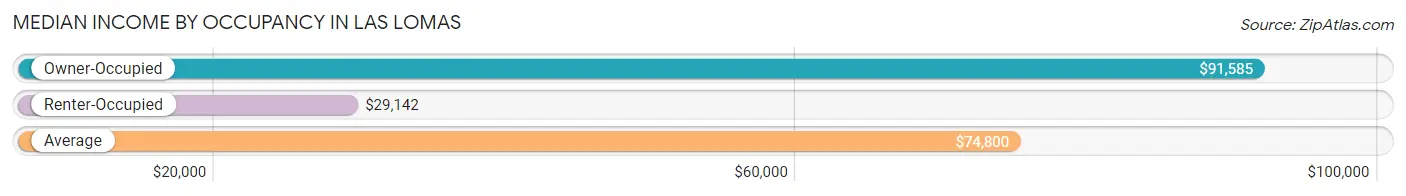
| Occupancy Type | # Households | Median Income |
| Owner-Occupied | 418 (58.5%) | $91,585 |
| Renter-Occupied | 296 (41.5%) | $29,142 |
| Average | 714 (100.0%) | $74,800 |
Occupancy by Householder Income Bracket in Las Lomas
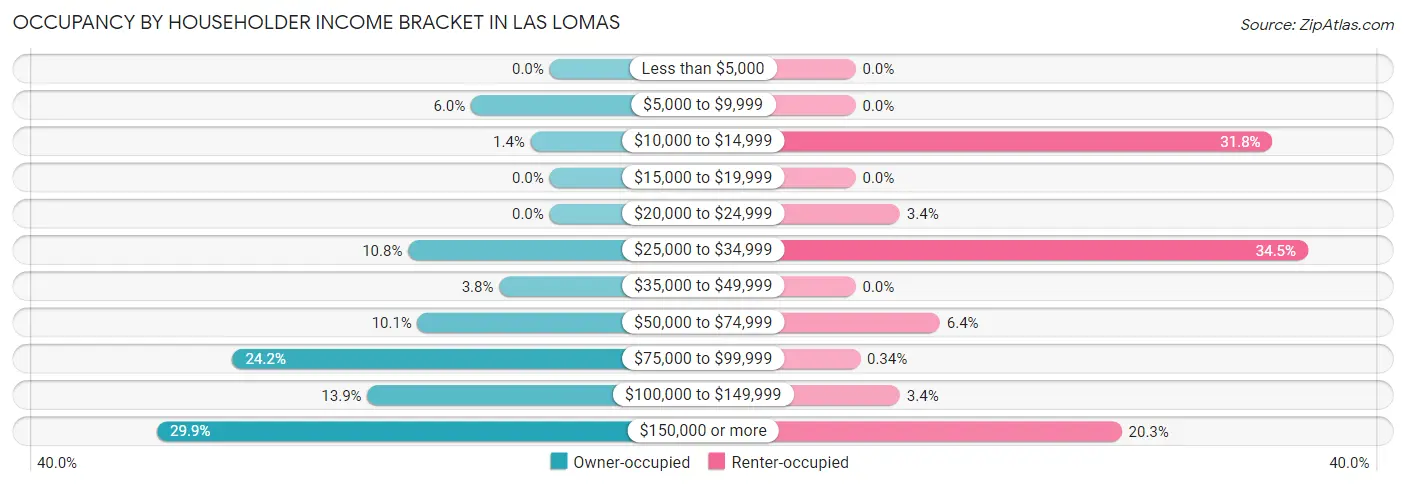
| Income Bracket | Owner-occupied | Renter-occupied |
| Less than $5,000 | 0 (0.0%) | 0 (0.0%) |
| $5,000 to $9,999 | 25 (6.0%) | 0 (0.0%) |
| $10,000 to $14,999 | 6 (1.4%) | 94 (31.8%) |
| $15,000 to $19,999 | 0 (0.0%) | 0 (0.0%) |
| $20,000 to $24,999 | 0 (0.0%) | 10 (3.4%) |
| $25,000 to $34,999 | 45 (10.8%) | 102 (34.5%) |
| $35,000 to $49,999 | 16 (3.8%) | 0 (0.0%) |
| $50,000 to $74,999 | 42 (10.1%) | 19 (6.4%) |
| $75,000 to $99,999 | 101 (24.2%) | 1 (0.3%) |
| $100,000 to $149,999 | 58 (13.9%) | 10 (3.4%) |
| $150,000 or more | 125 (29.9%) | 60 (20.3%) |
| Total | 418 (100.0%) | 296 (100.0%) |
Monthly Housing Cost Tiers in Las Lomas
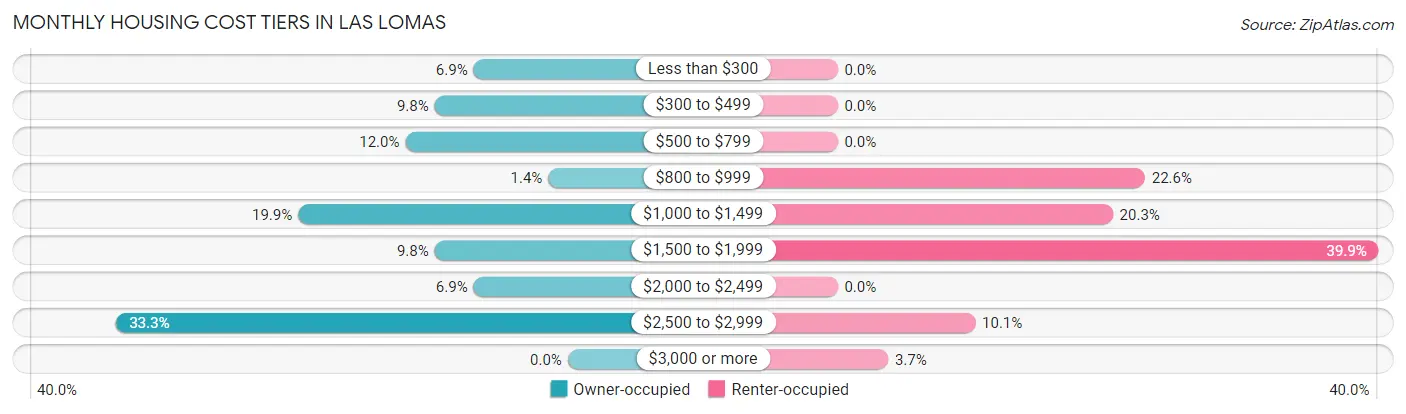
| Monthly Cost | Owner-occupied | Renter-occupied |
| Less than $300 | 29 (6.9%) | 0 (0.0%) |
| $300 to $499 | 41 (9.8%) | 0 (0.0%) |
| $500 to $799 | 50 (12.0%) | 0 (0.0%) |
| $800 to $999 | 6 (1.4%) | 67 (22.6%) |
| $1,000 to $1,499 | 83 (19.9%) | 60 (20.3%) |
| $1,500 to $1,999 | 41 (9.8%) | 118 (39.9%) |
| $2,000 to $2,499 | 29 (6.9%) | 0 (0.0%) |
| $2,500 to $2,999 | 139 (33.3%) | 30 (10.1%) |
| $3,000 or more | 0 (0.0%) | 11 (3.7%) |
| Total | 418 (100.0%) | 296 (100.0%) |
Physical Housing Characteristics in Las Lomas
Housing Structures in Las Lomas
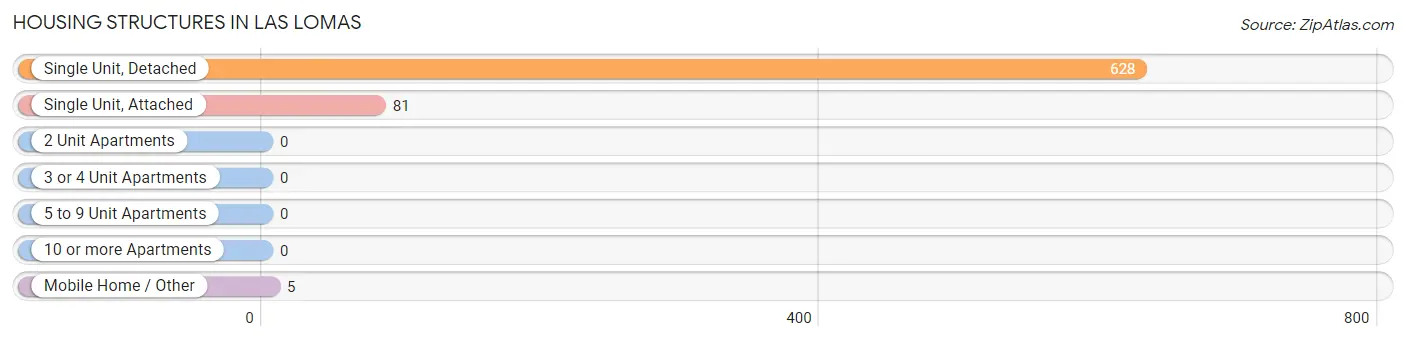
| Structure Type | # Housing Units | % Housing Units |
| Single Unit, Detached | 628 | 88.0% |
| Single Unit, Attached | 81 | 11.3% |
| 2 Unit Apartments | 0 | 0.0% |
| 3 or 4 Unit Apartments | 0 | 0.0% |
| 5 to 9 Unit Apartments | 0 | 0.0% |
| 10 or more Apartments | 0 | 0.0% |
| Mobile Home / Other | 5 | 0.7% |
| Total | 714 | 100.0% |
Housing Structures by Occupancy in Las Lomas
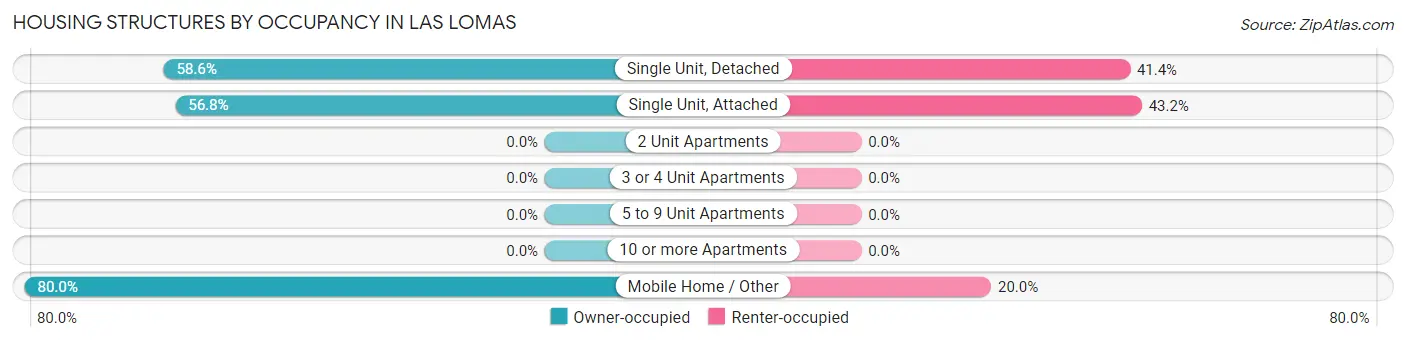
| Structure Type | Owner-occupied | Renter-occupied |
| Single Unit, Detached | 368 (58.6%) | 260 (41.4%) |
| Single Unit, Attached | 46 (56.8%) | 35 (43.2%) |
| 2 Unit Apartments | 0 (0.0%) | 0 (0.0%) |
| 3 or 4 Unit Apartments | 0 (0.0%) | 0 (0.0%) |
| 5 to 9 Unit Apartments | 0 (0.0%) | 0 (0.0%) |
| 10 or more Apartments | 0 (0.0%) | 0 (0.0%) |
| Mobile Home / Other | 4 (80.0%) | 1 (20.0%) |
| Total | 418 (58.5%) | 296 (41.5%) |
Housing Structures by Number of Rooms in Las Lomas
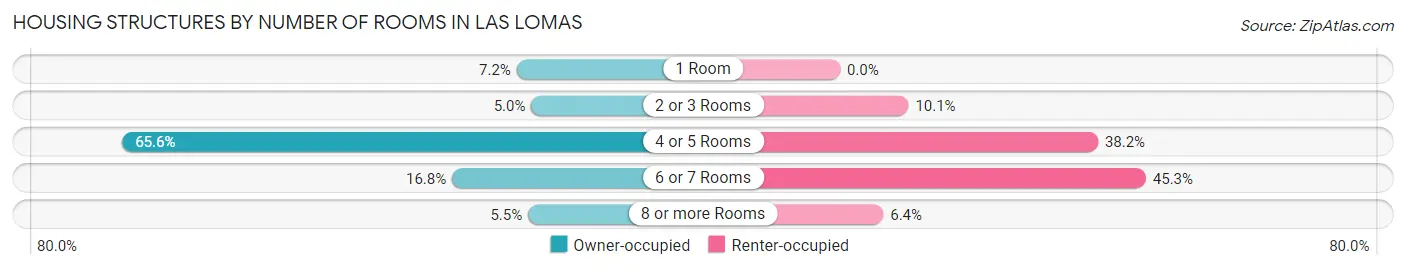
| Number of Rooms | Owner-occupied | Renter-occupied |
| 1 Room | 30 (7.2%) | 0 (0.0%) |
| 2 or 3 Rooms | 21 (5.0%) | 30 (10.1%) |
| 4 or 5 Rooms | 274 (65.5%) | 113 (38.2%) |
| 6 or 7 Rooms | 70 (16.8%) | 134 (45.3%) |
| 8 or more Rooms | 23 (5.5%) | 19 (6.4%) |
| Total | 418 (100.0%) | 296 (100.0%) |
Housing Structure by Heating Type in Las Lomas
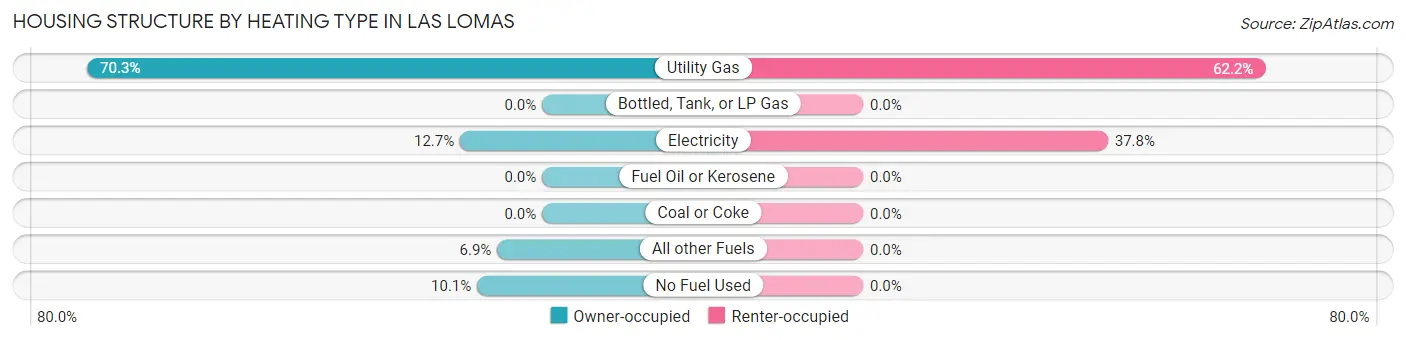
| Heating Type | Owner-occupied | Renter-occupied |
| Utility Gas | 294 (70.3%) | 184 (62.2%) |
| Bottled, Tank, or LP Gas | 0 (0.0%) | 0 (0.0%) |
| Electricity | 53 (12.7%) | 112 (37.8%) |
| Fuel Oil or Kerosene | 0 (0.0%) | 0 (0.0%) |
| Coal or Coke | 0 (0.0%) | 0 (0.0%) |
| All other Fuels | 29 (6.9%) | 0 (0.0%) |
| No Fuel Used | 42 (10.1%) | 0 (0.0%) |
| Total | 418 (100.0%) | 296 (100.0%) |
Household Vehicle Usage in Las Lomas
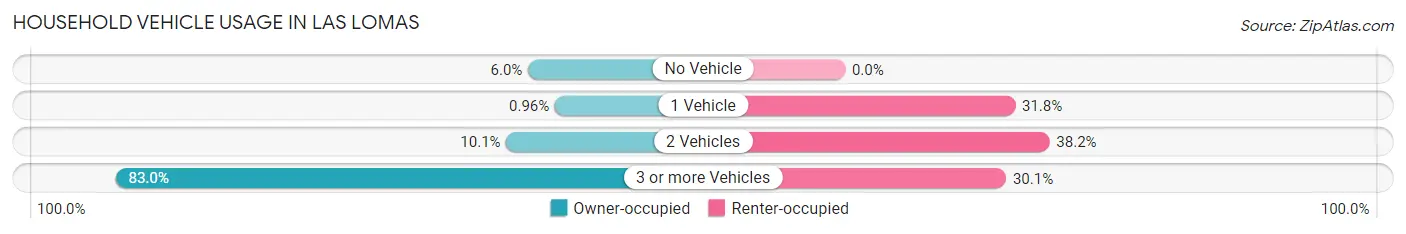
| Vehicles per Household | Owner-occupied | Renter-occupied |
| No Vehicle | 25 (6.0%) | 0 (0.0%) |
| 1 Vehicle | 4 (1.0%) | 94 (31.8%) |
| 2 Vehicles | 42 (10.1%) | 113 (38.2%) |
| 3 or more Vehicles | 347 (83.0%) | 89 (30.1%) |
| Total | 418 (100.0%) | 296 (100.0%) |
Real Estate & Mortgages in Las Lomas
Real Estate and Mortgage Overview in Las Lomas
| Characteristic | Without Mortgage | With Mortgage |
| Housing Units | 138 | 280 |
| Median Property Value | $633,200 | $615,000 |
| Median Household Income | $34,573 | $82 |
| Monthly Housing Costs | $498 | $0 |
| Real Estate Taxes | $2,976 | $0 |
Property Value by Mortgage Status in Las Lomas
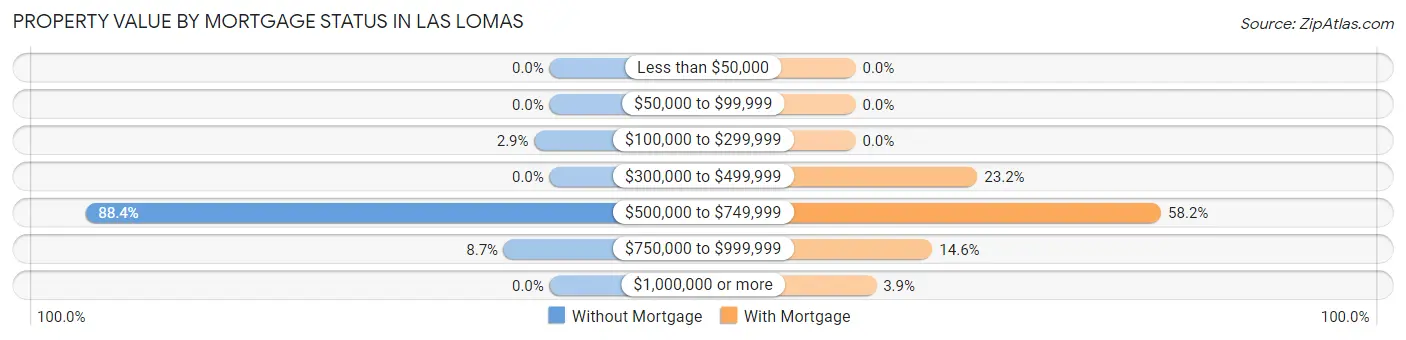
| Property Value | Without Mortgage | With Mortgage |
| Less than $50,000 | 0 (0.0%) | 0 (0.0%) |
| $50,000 to $99,999 | 0 (0.0%) | 0 (0.0%) |
| $100,000 to $299,999 | 4 (2.9%) | 0 (0.0%) |
| $300,000 to $499,999 | 0 (0.0%) | 65 (23.2%) |
| $500,000 to $749,999 | 122 (88.4%) | 163 (58.2%) |
| $750,000 to $999,999 | 12 (8.7%) | 41 (14.6%) |
| $1,000,000 or more | 0 (0.0%) | 11 (3.9%) |
| Total | 138 (100.0%) | 280 (100.0%) |
Household Income by Mortgage Status in Las Lomas
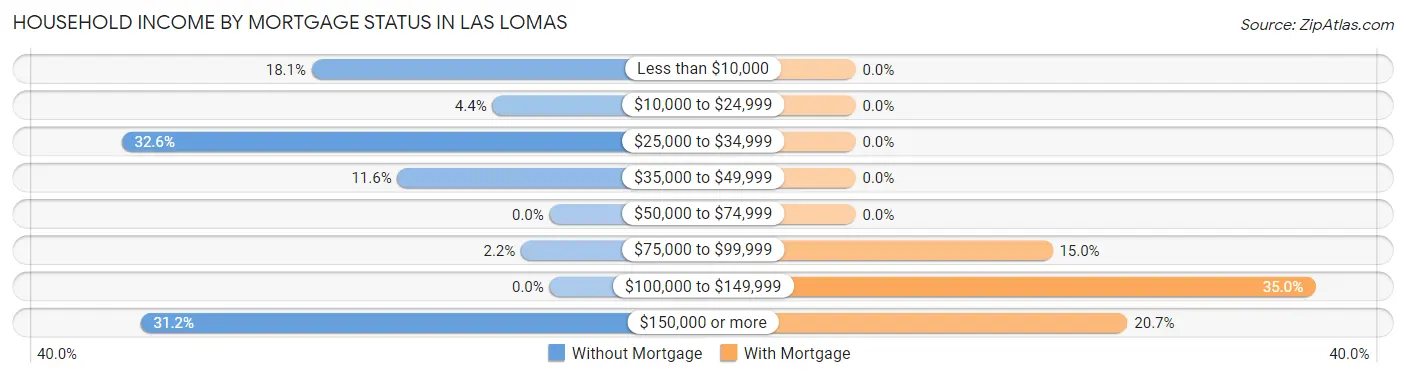
| Household Income | Without Mortgage | With Mortgage |
| Less than $10,000 | 25 (18.1%) | 0 (0.0%) |
| $10,000 to $24,999 | 6 (4.3%) | 0 (0.0%) |
| $25,000 to $34,999 | 45 (32.6%) | 0 (0.0%) |
| $35,000 to $49,999 | 16 (11.6%) | 0 (0.0%) |
| $50,000 to $74,999 | 0 (0.0%) | 0 (0.0%) |
| $75,000 to $99,999 | 3 (2.2%) | 42 (15.0%) |
| $100,000 to $149,999 | 0 (0.0%) | 98 (35.0%) |
| $150,000 or more | 43 (31.2%) | 58 (20.7%) |
| Total | 138 (100.0%) | 280 (100.0%) |
Property Value to Household Income Ratio in Las Lomas
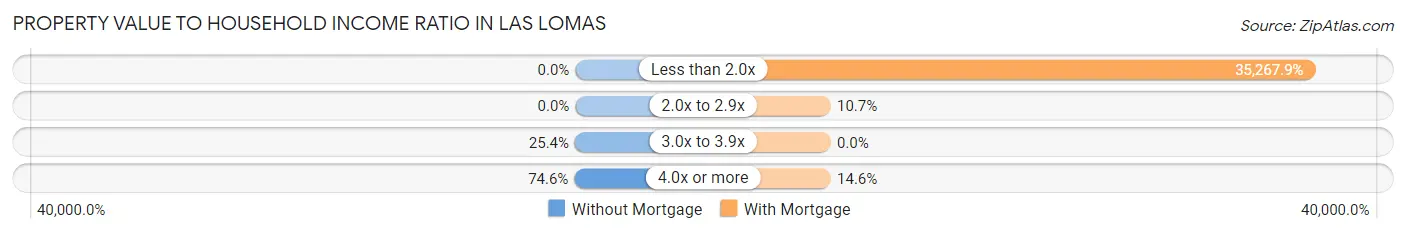
| Value-to-Income Ratio | Without Mortgage | With Mortgage |
| Less than 2.0x | 0 (0.0%) | 98,750 (35,267.9%) |
| 2.0x to 2.9x | 0 (0.0%) | 30 (10.7%) |
| 3.0x to 3.9x | 35 (25.4%) | 0 (0.0%) |
| 4.0x or more | 103 (74.6%) | 41 (14.6%) |
| Total | 138 (100.0%) | 280 (100.0%) |
Real Estate Taxes by Mortgage Status in Las Lomas
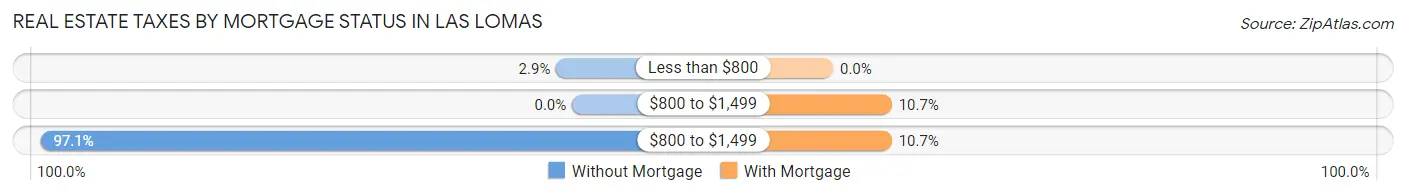
| Property Taxes | Without Mortgage | With Mortgage |
| Less than $800 | 4 (2.9%) | 0 (0.0%) |
| $800 to $1,499 | 0 (0.0%) | 30 (10.7%) |
| $800 to $1,499 | 134 (97.1%) | 30 (10.7%) |
| Total | 138 (100.0%) | 280 (100.0%) |
Health & Disability in Las Lomas
Health Insurance Coverage by Age in Las Lomas
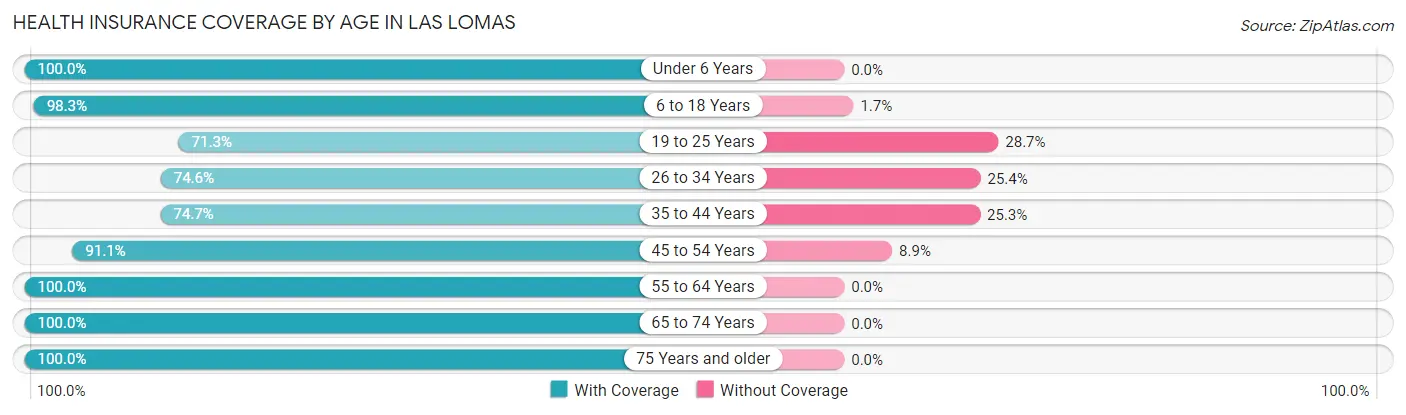
| Age Bracket | With Coverage | Without Coverage |
| Under 6 Years | 283 (100.0%) | 0 (0.0%) |
| 6 to 18 Years | 864 (98.3%) | 15 (1.7%) |
| 19 to 25 Years | 258 (71.3%) | 104 (28.7%) |
| 26 to 34 Years | 182 (74.6%) | 62 (25.4%) |
| 35 to 44 Years | 227 (74.7%) | 77 (25.3%) |
| 45 to 54 Years | 337 (91.1%) | 33 (8.9%) |
| 55 to 64 Years | 399 (100.0%) | 0 (0.0%) |
| 65 to 74 Years | 121 (100.0%) | 0 (0.0%) |
| 75 Years and older | 97 (100.0%) | 0 (0.0%) |
| Total | 2,768 (90.5%) | 291 (9.5%) |
Health Insurance Coverage by Citizenship Status in Las Lomas
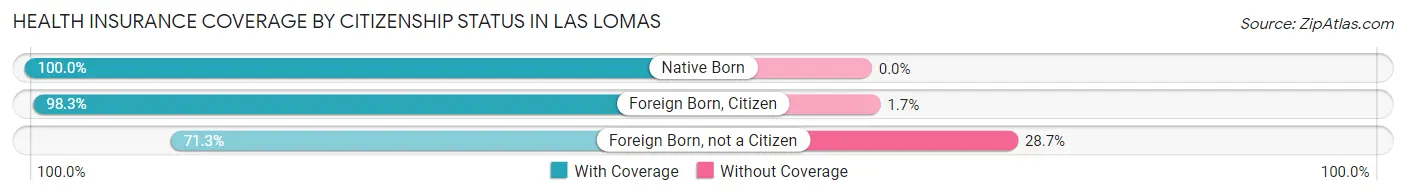
| Citizenship Status | With Coverage | Without Coverage |
| Native Born | 283 (100.0%) | 0 (0.0%) |
| Foreign Born, Citizen | 864 (98.3%) | 15 (1.7%) |
| Foreign Born, not a Citizen | 258 (71.3%) | 104 (28.7%) |
Health Insurance Coverage by Household Income in Las Lomas
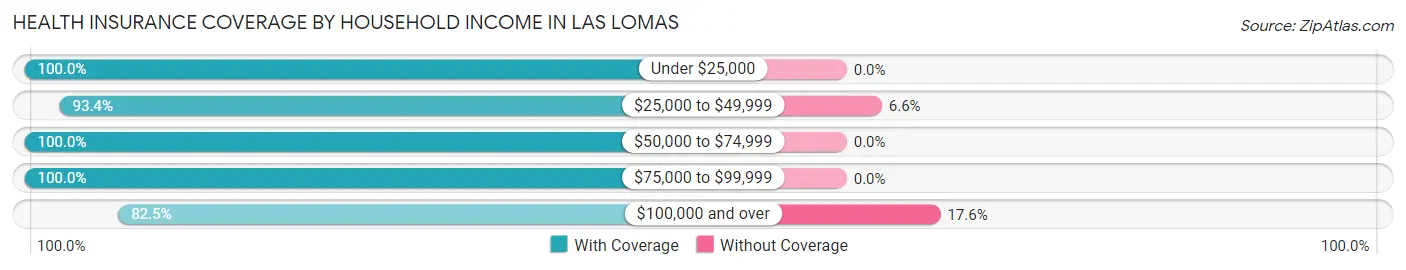
| Household Income | With Coverage | Without Coverage |
| Under $25,000 | 411 (100.0%) | 0 (0.0%) |
| $25,000 to $49,999 | 498 (93.4%) | 35 (6.6%) |
| $50,000 to $74,999 | 183 (100.0%) | 0 (0.0%) |
| $75,000 to $99,999 | 473 (100.0%) | 0 (0.0%) |
| $100,000 and over | 1,203 (82.5%) | 256 (17.5%) |
Public vs Private Health Insurance Coverage by Age in Las Lomas
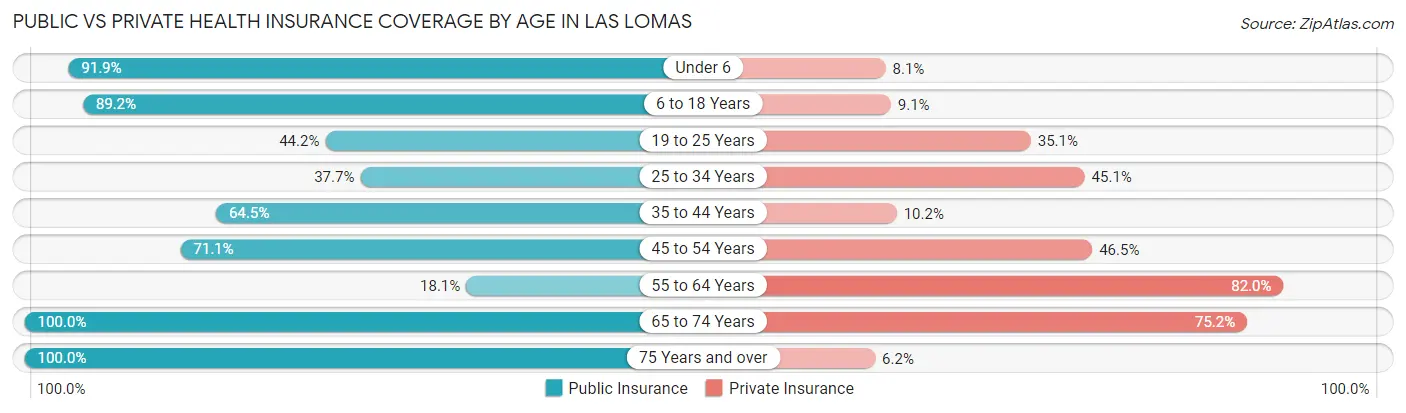
| Age Bracket | Public Insurance | Private Insurance |
| Under 6 | 260 (91.9%) | 23 (8.1%) |
| 6 to 18 Years | 784 (89.2%) | 80 (9.1%) |
| 19 to 25 Years | 160 (44.2%) | 127 (35.1%) |
| 25 to 34 Years | 92 (37.7%) | 110 (45.1%) |
| 35 to 44 Years | 196 (64.5%) | 31 (10.2%) |
| 45 to 54 Years | 263 (71.1%) | 172 (46.5%) |
| 55 to 64 Years | 72 (18.0%) | 327 (82.0%) |
| 65 to 74 Years | 121 (100.0%) | 91 (75.2%) |
| 75 Years and over | 97 (100.0%) | 6 (6.2%) |
| Total | 2,045 (66.8%) | 967 (31.6%) |
Disability Status by Sex by Age in Las Lomas
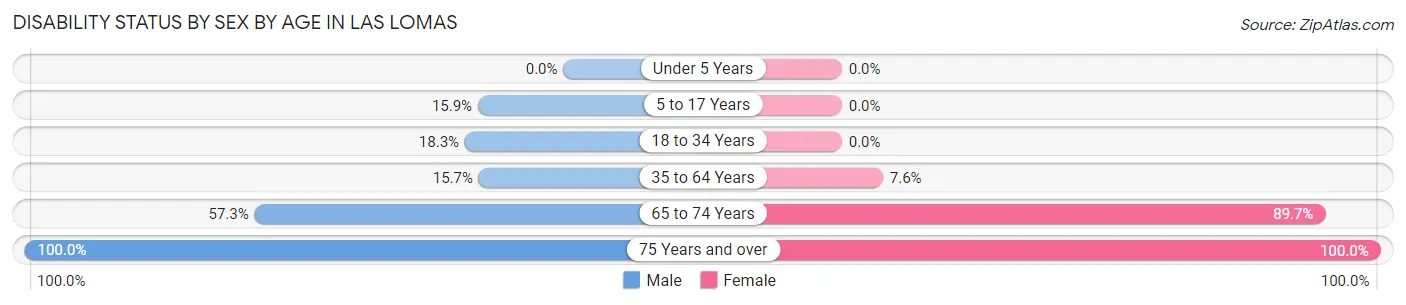
| Age Bracket | Male | Female |
| Under 5 Years | 0 (0.0%) | 0 (0.0%) |
| 5 to 17 Years | 65 (15.9%) | 0 (0.0%) |
| 18 to 34 Years | 72 (18.3%) | 0 (0.0%) |
| 35 to 64 Years | 84 (15.7%) | 41 (7.6%) |
| 65 to 74 Years | 47 (57.3%) | 35 (89.7%) |
| 75 Years and over | 57 (100.0%) | 40 (100.0%) |
Disability Class by Sex by Age in Las Lomas
Disability Class: Hearing Difficulty
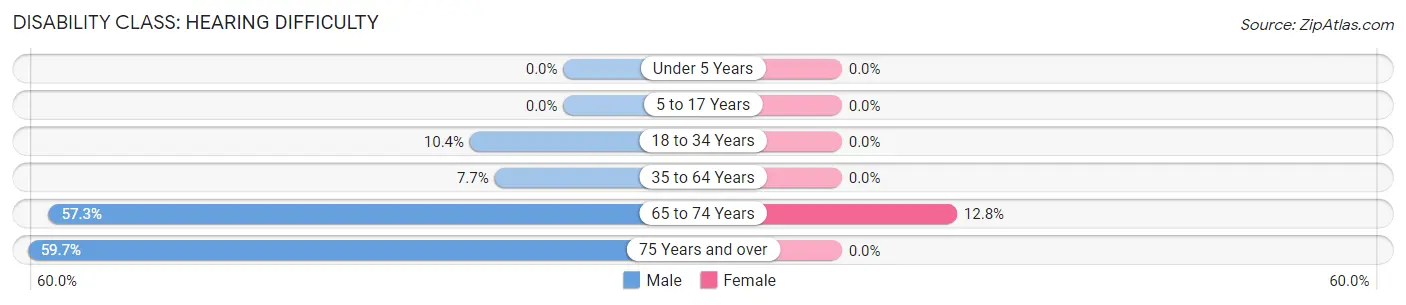
| Age Bracket | Male | Female |
| Under 5 Years | 0 (0.0%) | 0 (0.0%) |
| 5 to 17 Years | 0 (0.0%) | 0 (0.0%) |
| 18 to 34 Years | 41 (10.4%) | 0 (0.0%) |
| 35 to 64 Years | 41 (7.7%) | 0 (0.0%) |
| 65 to 74 Years | 47 (57.3%) | 5 (12.8%) |
| 75 Years and over | 34 (59.7%) | 0 (0.0%) |
Disability Class: Vision Difficulty
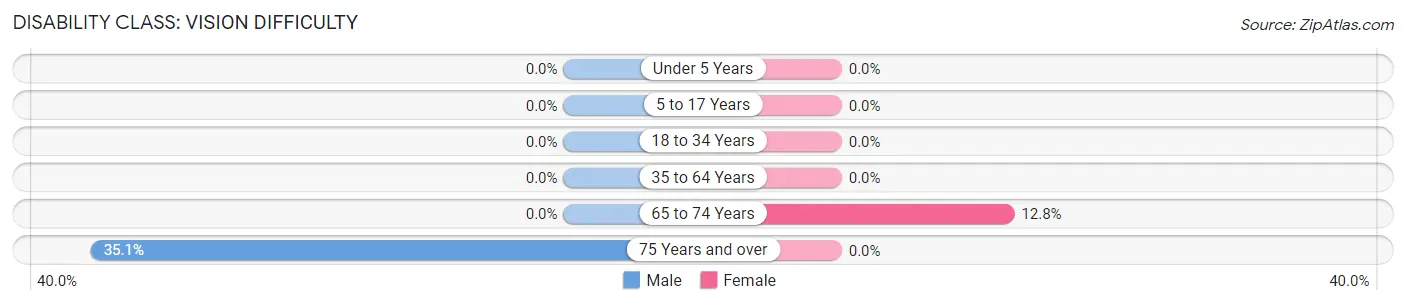
| Age Bracket | Male | Female |
| Under 5 Years | 0 (0.0%) | 0 (0.0%) |
| 5 to 17 Years | 0 (0.0%) | 0 (0.0%) |
| 18 to 34 Years | 0 (0.0%) | 0 (0.0%) |
| 35 to 64 Years | 0 (0.0%) | 0 (0.0%) |
| 65 to 74 Years | 0 (0.0%) | 5 (12.8%) |
| 75 Years and over | 20 (35.1%) | 0 (0.0%) |
Disability Class: Cognitive Difficulty
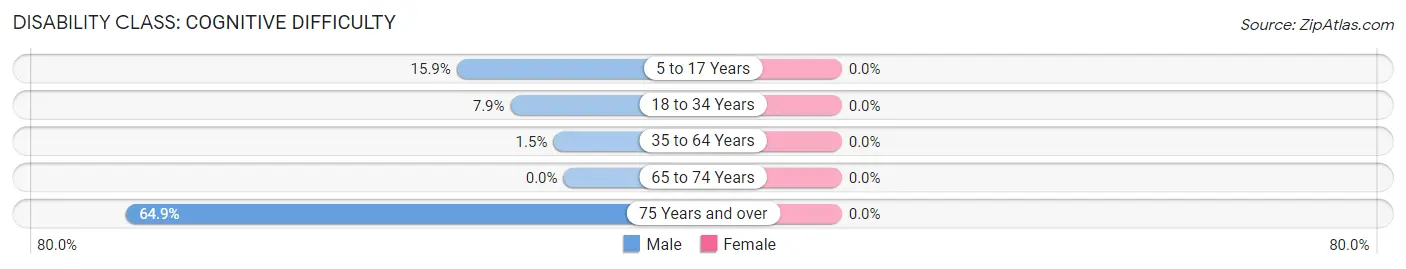
| Age Bracket | Male | Female |
| 5 to 17 Years | 65 (15.9%) | 0 (0.0%) |
| 18 to 34 Years | 31 (7.9%) | 0 (0.0%) |
| 35 to 64 Years | 8 (1.5%) | 0 (0.0%) |
| 65 to 74 Years | 0 (0.0%) | 0 (0.0%) |
| 75 Years and over | 37 (64.9%) | 0 (0.0%) |
Disability Class: Ambulatory Difficulty
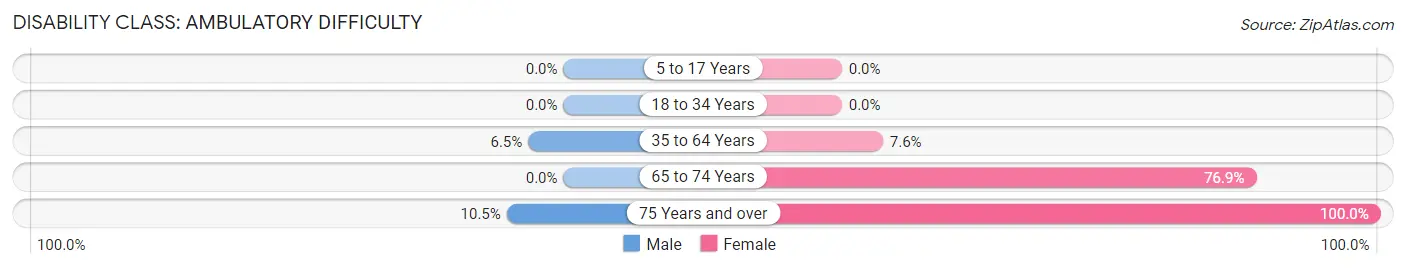
| Age Bracket | Male | Female |
| 5 to 17 Years | 0 (0.0%) | 0 (0.0%) |
| 18 to 34 Years | 0 (0.0%) | 0 (0.0%) |
| 35 to 64 Years | 35 (6.5%) | 41 (7.6%) |
| 65 to 74 Years | 0 (0.0%) | 30 (76.9%) |
| 75 Years and over | 6 (10.5%) | 40 (100.0%) |
Disability Class: Self-Care Difficulty
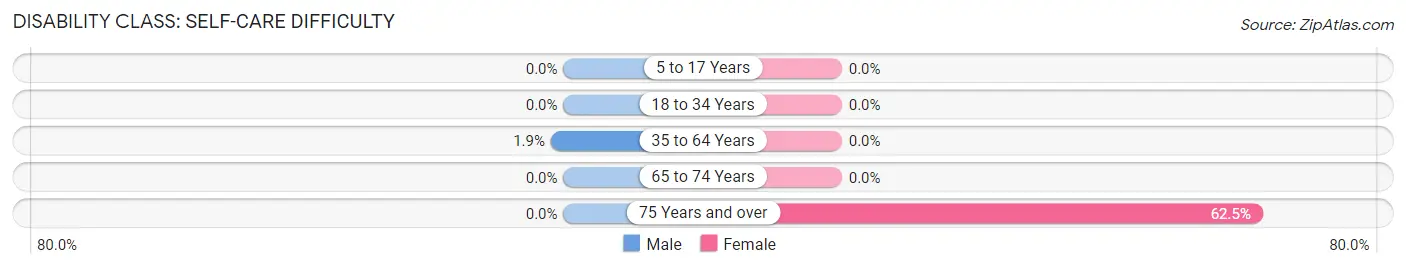
| Age Bracket | Male | Female |
| 5 to 17 Years | 0 (0.0%) | 0 (0.0%) |
| 18 to 34 Years | 0 (0.0%) | 0 (0.0%) |
| 35 to 64 Years | 10 (1.9%) | 0 (0.0%) |
| 65 to 74 Years | 0 (0.0%) | 0 (0.0%) |
| 75 Years and over | 0 (0.0%) | 25 (62.5%) |
Technology Access in Las Lomas
Computing Device Access in Las Lomas
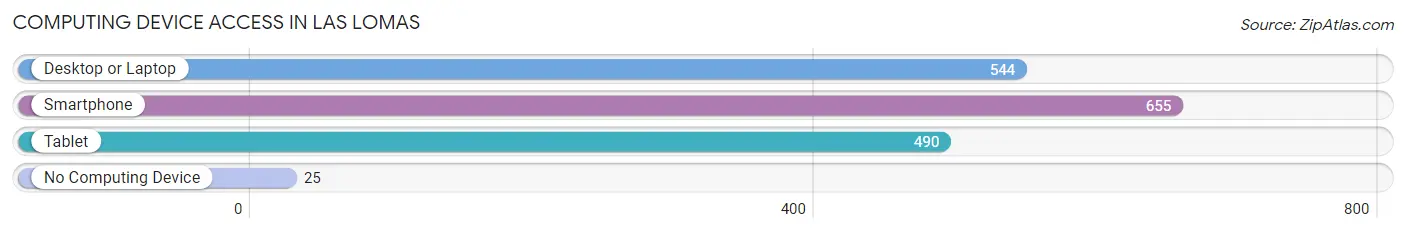
| Device Type | # Households | % Households |
| Desktop or Laptop | 544 | 76.2% |
| Smartphone | 655 | 91.7% |
| Tablet | 490 | 68.6% |
| No Computing Device | 25 | 3.5% |
| Total | 714 | 100.0% |
Internet Access in Las Lomas
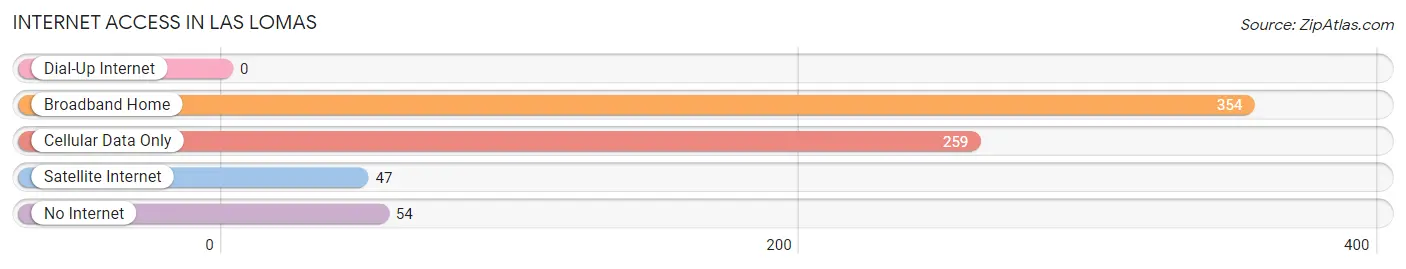
| Internet Type | # Households | % Households |
| Dial-Up Internet | 0 | 0.0% |
| Broadband Home | 354 | 49.6% |
| Cellular Data Only | 259 | 36.3% |
| Satellite Internet | 47 | 6.6% |
| No Internet | 54 | 7.6% |
| Total | 714 | 100.0% |
Las Lomas Summary
Las Lomas is a census-designated place located in Contra Costa County, California. It is situated in the San Francisco Bay Area, about 25 miles east of San Francisco. The population was 8,845 at the 2010 census.
History
Las Lomas was originally part of the Rancho El Sobrante land grant, which was granted to the Castro family in 1841. The area was used for cattle grazing and farming until the 1950s, when it was developed into a residential community. The name Las Lomas is derived from the Spanish word for “hills”, referring to the rolling hills of the area.
Geography
Las Lomas is located at 37°59'25"N 122°7'25"W (37.990278, -122.123611). It is situated in the San Francisco Bay Area, about 25 miles east of San Francisco. The area is characterized by rolling hills and is located in the East Bay Hills. The elevation of Las Lomas is approximately 500 feet above sea level.
Economy
Las Lomas is primarily a residential community, with no major employers located in the area. The majority of residents commute to nearby cities for work. The median household income in Las Lomas is $90,845, which is higher than the median household income for Contra Costa County ($83,844).
Demographics
As of the 2010 census, there were 8,845 people, 3,093 households, and 2,521 families residing in Las Lomas. The population density was 2,845.3 people per square mile (1,098.7/km2). The racial makeup of Las Lomas was 68.2% White, 11.3% African American, 0.5% Native American, 11.7% Asian, 0.2% Pacific Islander, 4.7% from other races, and 3.4% from two or more races. Hispanic or Latino of any race were 13.2% of the population.
The median age in Las Lomas was 43.2 years. 24.2% of residents were under the age of 18; 6.2% were between the ages of 18 and 24; 22.3% were from 25 to 44; 33.2% were from 45 to 64; and 14.1% were 65 years of age or older. The gender makeup of Las Lomas was 48.2% male and 51.8% female.
Conclusion
Las Lomas is a census-designated place located in Contra Costa County, California. It is situated in the San Francisco Bay Area, about 25 miles east of San Francisco. The population was 8,845 at the 2010 census. Las Lomas was originally part of the Rancho El Sobrante land grant, which was granted to the Castro family in 1841. The area is characterized by rolling hills and is located in the East Bay Hills. Las Lomas is primarily a residential community, with no major employers located in the area. The majority of residents commute to nearby cities for work. The median household income in Las Lomas is $90,845, which is higher than the median household income for Contra Costa County ($83,844). As of the 2010 census, there were 8,845 people, 3,093 households, and 2,521 families residing in Las Lomas. The racial makeup of Las Lomas was 68.2% White, 11.3% African American, 0.5% Native American, 11.7% Asian, 0.2% Pacific Islander, 4.7% from other races, and 3.4% from two or more races. Hispanic or Latino of any race were 13.2% of the population.
Common Questions
What is Per Capita Income in Las Lomas?
Per Capita income in Las Lomas is $21,690.
What is the Median Family Income in Las Lomas?
Median Family Income in Las Lomas is $73,750.
What is the Median Household income in Las Lomas?
Median Household Income in Las Lomas is $74,800.
What is Income or Wage Gap in Las Lomas?
Income or Wage Gap in Las Lomas is 6.1%.
Women in Las Lomas earn 93.9 cents for every dollar earned by a man.
What is Inequality or Gini Index in Las Lomas?
Inequality or Gini Index in Las Lomas is 0.48.
What is the Total Population of Las Lomas?
Total Population of Las Lomas is 3,059.
What is the Total Male Population of Las Lomas?
Total Male Population of Las Lomas is 1,501.
What is the Total Female Population of Las Lomas?
Total Female Population of Las Lomas is 1,558.
What is the Ratio of Males per 100 Females in Las Lomas?
There are 96.34 Males per 100 Females in Las Lomas.
What is the Ratio of Females per 100 Males in Las Lomas?
There are 103.80 Females per 100 Males in Las Lomas.
What is the Median Population Age in Las Lomas?
Median Population Age in Las Lomas is 27.6 Years.
What is the Average Family Size in Las Lomas
Average Family Size in Las Lomas is 4.1 People.
What is the Average Household Size in Las Lomas
Average Household Size in Las Lomas is 4.3 People.
How Large is the Labor Force in Las Lomas?
There are 1,452 People in the Labor Forcein in Las Lomas.
What is the Percentage of People in the Labor Force in Las Lomas?
65.6% of People are in the Labor Force in Las Lomas.
What is the Unemployment Rate in Las Lomas?
Unemployment Rate in Las Lomas is 3.1%.