Cities with the Highest Percentage of Population with a Degree in Engineering in South Dakota
RELATED REPORTS & OPTIONS
Engineering
South Dakota
Compare Cities
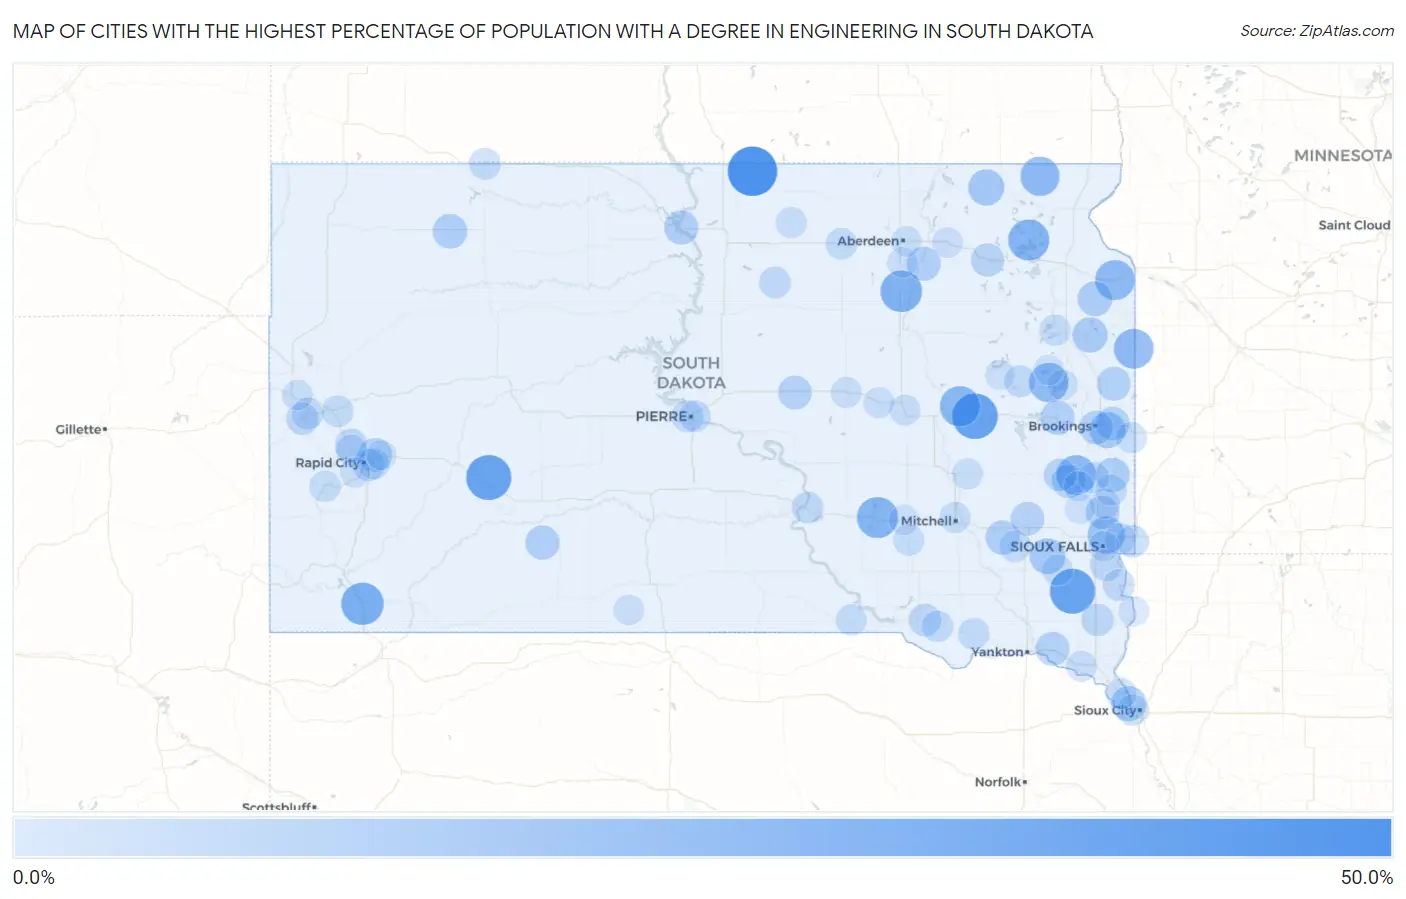
Map of Cities with the Highest Percentage of Population with a Degree in Engineering in South Dakota
0.0%
50.0%
Cities with the Highest Percentage of Population with a Degree in Engineering in South Dakota
| City | % Graduates | vs State | vs National | |
| 1. | Artas | 42.3% | 5.3%(+37.1)#1 | 7.6%(+34.7)#241 |
| 2. | Iroquois | 34.0% | 5.3%(+28.8)#2 | 7.6%(+26.4)#351 |
| 3. | Davis | 33.3% | 5.3%(+28.1)#3 | 7.6%(+25.7)#371 |
| 4. | Quinn | 33.3% | 5.3%(+28.1)#4 | 7.6%(+25.7)#375 |
| 5. | Oelrichs | 27.8% | 5.3%(+22.5)#5 | 7.6%(+20.1)#529 |
| 6. | Mellette | 26.1% | 5.3%(+20.8)#6 | 7.6%(+18.4)#596 |
| 7. | White Lake | 25.0% | 5.3%(+19.7)#7 | 7.6%(+17.4)#648 |
| 8. | Grenville | 25.0% | 5.3%(+19.7)#8 | 7.6%(+17.4)#674 |
| 9. | Yale | 23.5% | 5.3%(+18.3)#9 | 7.6%(+15.9)#750 |
| 10. | Milbank | 22.3% | 5.3%(+17.0)#10 | 7.6%(+14.6)#823 |
| 11. | Gary | 22.2% | 5.3%(+17.0)#11 | 7.6%(+14.6)#836 |
| 12. | Wentworth | 22.2% | 5.3%(+17.0)#12 | 7.6%(+14.6)#838 |
| 13. | Lake Norden | 21.6% | 5.3%(+16.4)#13 | 7.6%(+14.0)#877 |
| 14. | Veblen | 21.3% | 5.3%(+16.1)#14 | 7.6%(+13.7)#914 |
| 15. | Meadow View Addition | 17.5% | 5.3%(+12.2)#15 | 7.6%(+9.85)#1,353 |
| 16. | Britton | 15.0% | 5.3%(+9.72)#16 | 7.6%(+7.33)#1,880 |
| 17. | Aurora | 14.7% | 5.3%(+9.40)#17 | 7.6%(+7.01)#1,947 |
| 18. | Monroe | 14.3% | 5.3%(+9.03)#18 | 7.6%(+6.64)#2,047 |
| 19. | Stephan | 13.8% | 5.3%(+8.54)#19 | 7.6%(+6.15)#2,224 |
| 20. | Goodwin | 13.3% | 5.3%(+8.08)#20 | 7.6%(+5.69)#2,380 |
| 21. | North Sioux City | 12.9% | 5.3%(+7.69)#21 | 7.6%(+5.30)#2,519 |
| 22. | Stockholm | 12.5% | 5.3%(+7.24)#22 | 7.6%(+4.85)#2,705 |
| 23. | Enemy Swim | 12.0% | 5.3%(+6.74)#23 | 7.6%(+4.35)#2,890 |
| 24. | Bison | 11.9% | 5.3%(+6.68)#24 | 7.6%(+4.29)#2,914 |
| 25. | Egan | 11.8% | 5.3%(+6.51)#25 | 7.6%(+4.12)#3,002 |
| 26. | Wanblee | 11.4% | 5.3%(+6.11)#26 | 7.6%(+3.72)#3,187 |
| 27. | Arlington | 11.3% | 5.3%(+6.06)#27 | 7.6%(+3.67)#3,212 |
| 28. | Emery | 11.3% | 5.3%(+5.99)#28 | 7.6%(+3.60)#3,249 |
| 29. | Mobridge | 11.2% | 5.3%(+5.95)#29 | 7.6%(+3.56)#3,274 |
| 30. | Stratford | 11.1% | 5.3%(+5.86)#30 | 7.6%(+3.46)#3,350 |
| 31. | Toronto | 10.7% | 5.3%(+5.46)#31 | 7.6%(+3.07)#3,581 |
| 32. | Gayville | 10.5% | 5.3%(+5.27)#32 | 7.6%(+2.88)#3,703 |
| 33. | Bushnell | 10.5% | 5.3%(+5.27)#33 | 7.6%(+2.88)#3,715 |
| 34. | Ashland Heights | 10.5% | 5.3%(+5.22)#34 | 7.6%(+2.83)#3,734 |
| 35. | Highmore | 10.4% | 5.3%(+5.16)#35 | 7.6%(+2.77)#3,778 |
| 36. | Lake Madison | 10.3% | 5.3%(+5.01)#36 | 7.6%(+2.62)#3,889 |
| 37. | Brookings | 10.1% | 5.3%(+4.88)#37 | 7.6%(+2.49)#3,979 |
| 38. | Salem | 10.1% | 5.3%(+4.84)#38 | 7.6%(+2.45)#4,004 |
| 39. | Baltic | 9.8% | 5.3%(+4.52)#39 | 7.6%(+2.13)#4,267 |
| 40. | Bristol | 9.5% | 5.3%(+4.27)#40 | 7.6%(+1.88)#4,455 |
| 41. | Madison | 8.3% | 5.3%(+3.05)#41 | 7.6%(+0.663)#5,609 |
| 42. | Wagner | 8.1% | 5.3%(+2.79)#42 | 7.6%(+0.403)#5,902 |
| 43. | Prairiewood | 7.8% | 5.3%(+2.59)#43 | 7.6%(+0.196)#6,156 |
| 44. | Beresford | 7.8% | 5.3%(+2.51)#44 | 7.6%(+0.119)#6,250 |
| 45. | Summerset | 7.7% | 5.3%(+2.46)#45 | 7.6%(+0.064)#6,314 |
| 46. | Rapid City | 7.7% | 5.3%(+2.39)#46 | 7.6%(+0.003)#6,416 |
| 47. | Lead | 7.4% | 5.3%(+2.17)#47 | 7.6%(-0.221)#6,680 |
| 48. | Valley Springs | 7.3% | 5.3%(+2.04)#48 | 7.6%(-0.356)#6,872 |
| 49. | Harrisburg | 7.3% | 5.3%(+2.01)#49 | 7.6%(-0.377)#6,896 |
| 50. | Fort Pierre | 6.8% | 5.3%(+1.59)#50 | 7.6%(-0.801)#7,481 |
| 51. | Bryant | 6.7% | 5.3%(+1.41)#51 | 7.6%(-0.981)#7,736 |
| 52. | Tolstoy | 6.7% | 5.3%(+1.41)#52 | 7.6%(-0.981)#7,762 |
| 53. | Canton | 6.6% | 5.3%(+1.31)#53 | 7.6%(-1.08)#7,892 |
| 54. | Deadwood | 6.5% | 5.3%(+1.20)#54 | 7.6%(-1.19)#8,043 |
| 55. | Chamberlain | 6.4% | 5.3%(+1.15)#55 | 7.6%(-1.24)#8,139 |
| 56. | Lemmon | 6.4% | 5.3%(+1.14)#56 | 7.6%(-1.25)#8,158 |
| 57. | Ipswich | 6.3% | 5.3%(+1.09)#57 | 7.6%(-1.30)#8,223 |
| 58. | Pierre | 6.3% | 5.3%(+1.02)#58 | 7.6%(-1.38)#8,350 |
| 59. | Bridgewater | 6.2% | 5.3%(+0.994)#59 | 7.6%(-1.40)#8,401 |
| 60. | Dante | 6.2% | 5.3%(+0.994)#60 | 7.6%(-1.40)#8,419 |
| 61. | Sturgis | 6.2% | 5.3%(+0.973)#61 | 7.6%(-1.42)#8,449 |
| 62. | Boulder Canyon | 6.2% | 5.3%(+0.962)#62 | 7.6%(-1.43)#8,466 |
| 63. | Tyndall | 6.0% | 5.3%(+0.727)#63 | 7.6%(-1.66)#8,855 |
| 64. | Mina | 5.8% | 5.3%(+0.550)#64 | 7.6%(-1.84)#9,140 |
| 65. | Brandon | 5.7% | 5.3%(+0.479)#65 | 7.6%(-1.91)#9,254 |
| 66. | Hill City | 5.7% | 5.3%(+0.435)#66 | 7.6%(-1.96)#9,337 |
| 67. | Elkton | 5.6% | 5.3%(+0.389)#67 | 7.6%(-2.00)#9,432 |
| 68. | Dakota Dunes | 5.6% | 5.3%(+0.314)#68 | 7.6%(-2.08)#9,539 |
| 69. | Trent | 5.6% | 5.3%(+0.299)#69 | 7.6%(-2.09)#9,571 |
| 70. | Rapid Valley | 5.5% | 5.3%(+0.249)#70 | 7.6%(-2.14)#9,653 |
| 71. | Bonesteel | 5.4% | 5.3%(+0.149)#71 | 7.6%(-2.24)#9,832 |
| 72. | Stickney | 5.4% | 5.3%(+0.149)#72 | 7.6%(-2.24)#9,835 |
| 73. | Parker | 5.3% | 5.3%(+0.069)#73 | 7.6%(-2.32)#9,970 |
| 74. | Mitchell | 5.3% | 5.3%(+0.055)#74 | 7.6%(-2.34)#9,990 |
| 75. | Colman | 5.3% | 5.3%(+0.042)#75 | 7.6%(-2.35)#10,015 |
| 76. | Watertown | 5.1% | 5.3%(-0.141)#76 | 7.6%(-2.53)#10,332 |
| 77. | Blackhawk | 5.0% | 5.3%(-0.244)#77 | 7.6%(-2.64)#10,508 |
| 78. | Wolsey | 5.0% | 5.3%(-0.256)#78 | 7.6%(-2.65)#10,529 |
| 79. | Artesian | 5.0% | 5.3%(-0.256)#79 | 7.6%(-2.65)#10,553 |
| 80. | Hosmer | 4.9% | 5.3%(-0.318)#80 | 7.6%(-2.71)#10,647 |
| 81. | Vermillion | 4.7% | 5.3%(-0.539)#81 | 7.6%(-2.93)#11,053 |
| 82. | Miller | 4.7% | 5.3%(-0.575)#82 | 7.6%(-2.97)#11,100 |
| 83. | Wessington | 4.5% | 5.3%(-0.711)#83 | 7.6%(-3.10)#11,361 |
| 84. | Jefferson | 4.5% | 5.3%(-0.752)#84 | 7.6%(-3.14)#11,420 |
| 85. | Spearfish | 4.4% | 5.3%(-0.861)#85 | 7.6%(-3.25)#11,615 |
| 86. | Groton | 4.3% | 5.3%(-0.908)#86 | 7.6%(-3.30)#11,686 |
| 87. | Dell Rapids | 4.3% | 5.3%(-1.00)#87 | 7.6%(-3.39)#11,841 |
| 88. | Lake Poinsett | 4.2% | 5.3%(-1.01)#88 | 7.6%(-3.41)#11,870 |
| 89. | St Francis | 4.2% | 5.3%(-1.09)#89 | 7.6%(-3.48)#12,020 |
| 90. | Sioux Falls | 4.1% | 5.3%(-1.12)#90 | 7.6%(-3.51)#12,077 |
| 91. | Warner | 4.0% | 5.3%(-1.22)#91 | 7.6%(-3.61)#12,235 |
| 92. | Aberdeen | 3.9% | 5.3%(-1.38)#92 | 7.6%(-3.77)#12,507 |
| 93. | Colton | 3.7% | 5.3%(-1.51)#93 | 7.6%(-3.90)#12,740 |
| 94. | Plankinton | 3.7% | 5.3%(-1.52)#94 | 7.6%(-3.91)#12,758 |
| 95. | Colonial Pine Hills | 3.7% | 5.3%(-1.55)#95 | 7.6%(-3.94)#12,810 |
| 96. | Hudson | 3.7% | 5.3%(-1.55)#96 | 7.6%(-3.94)#12,842 |
| 97. | Brant Lake | 3.6% | 5.3%(-1.62)#97 | 7.6%(-4.01)#12,979 |
| 98. | Box Elder | 3.6% | 5.3%(-1.65)#98 | 7.6%(-4.04)#13,039 |
| 99. | Hayti | 3.5% | 5.3%(-1.75)#99 | 7.6%(-4.14)#13,214 |
| 100. | Willow Lake | 3.4% | 5.3%(-1.81)#100 | 7.6%(-4.20)#13,312 |
Common Questions
What are the Top 10 Cities with the Highest Percentage of Population with a Degree in Engineering in South Dakota?
Top 10 Cities with the Highest Percentage of Population with a Degree in Engineering in South Dakota are:
What city has the Highest Percentage of Population with a Degree in Engineering in South Dakota?
Artas has the Highest Percentage of Population with a Degree in Engineering in South Dakota with 42.3%.
What is the Percentage of Population with a Degree in Engineering in the State of South Dakota?
Percentage of Population with a Degree in Engineering in South Dakota is 5.3%.
What is the Percentage of Population with a Degree in Engineering in the United States?
Percentage of Population with a Degree in Engineering in the United States is 7.6%.