Cities with the Highest Percentage of Population Employed in Real Estate, Rental & Leasing in Connecticut
RELATED REPORTS & OPTIONS
Real Estate, Rental & Leasing
Connecticut
Compare Cities
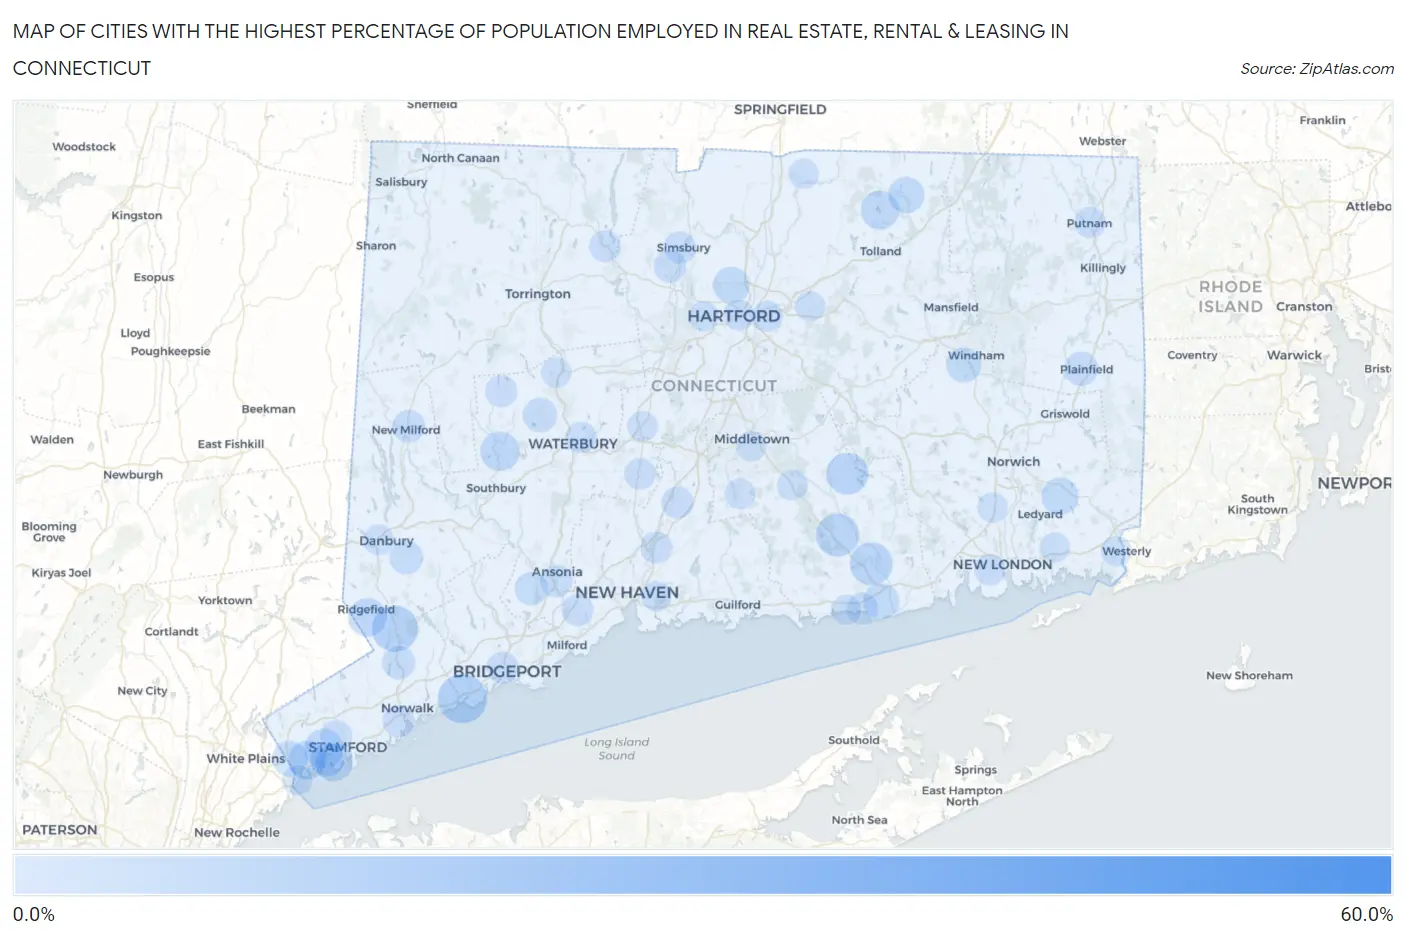
Map of Cities with the Highest Percentage of Population Employed in Real Estate, Rental & Leasing in Connecticut
0.0%
60.0%
Cities with the Highest Percentage of Population Employed in Real Estate, Rental & Leasing in Connecticut
| City | % Employed | vs State | vs National | |
| 1. | Riverton | 53.3% | 1.7%(+51.6)#1 | 1.9%(+51.4)#20 |
| 2. | Candlewood Knolls | 26.4% | 1.7%(+24.7)#2 | 1.9%(+24.5)#95 |
| 3. | Bridgewater | 25.0% | 1.7%(+23.3)#3 | 1.9%(+23.1)#104 |
| 4. | Lakeside Woods | 23.0% | 1.7%(+21.4)#4 | 1.9%(+21.2)#119 |
| 5. | Southport | 10.7% | 1.7%(+9.00)#5 | 1.9%(+8.76)#476 |
| 6. | Georgetown | 9.1% | 1.7%(+7.41)#6 | 1.9%(+7.17)#646 |
| 7. | Danielson Borough | 8.4% | 1.7%(+6.80)#7 | 1.9%(+6.56)#734 |
| 8. | West Cornwall | 8.3% | 1.7%(+6.68)#8 | 1.9%(+6.44)#757 |
| 9. | Weston | 8.1% | 1.7%(+6.42)#9 | 1.9%(+6.18)#812 |
| 10. | Chester Center | 7.6% | 1.7%(+5.94)#10 | 1.9%(+5.70)#902 |
| 11. | Essex Village | 7.5% | 1.7%(+5.89)#11 | 1.9%(+5.65)#920 |
| 12. | Compo | 7.1% | 1.7%(+5.48)#12 | 1.9%(+5.24)#1,014 |
| 13. | Moodus | 7.0% | 1.7%(+5.35)#13 | 1.9%(+5.11)#1,046 |
| 14. | Coleytown | 6.7% | 1.7%(+5.06)#14 | 1.9%(+4.82)#1,111 |
| 15. | Cos Cob | 5.9% | 1.7%(+4.22)#15 | 1.9%(+3.98)#1,430 |
| 16. | Woodbury Center | 5.8% | 1.7%(+4.11)#16 | 1.9%(+3.87)#1,475 |
| 17. | Rock Ridge | 5.5% | 1.7%(+3.88)#17 | 1.9%(+3.64)#1,575 |
| 18. | Greenwich | 5.4% | 1.7%(+3.79)#18 | 1.9%(+3.55)#1,617 |
| 19. | Crystal Lake | 5.4% | 1.7%(+3.70)#19 | 1.9%(+3.46)#1,667 |
| 20. | Darien Downtown | 5.3% | 1.7%(+3.69)#20 | 1.9%(+3.45)#1,671 |
| 21. | Ridgefield | 5.3% | 1.7%(+3.64)#21 | 1.9%(+3.40)#1,690 |
| 22. | Old Greenwich | 5.2% | 1.7%(+3.52)#22 | 1.9%(+3.28)#1,769 |
| 23. | Mashantucket | 4.8% | 1.7%(+3.11)#23 | 1.9%(+2.87)#2,012 |
| 24. | Greens Farms | 4.7% | 1.7%(+3.08)#24 | 1.9%(+2.84)#2,036 |
| 25. | Groton Long Point Borough | 4.7% | 1.7%(+3.03)#25 | 1.9%(+2.80)#2,069 |
| 26. | Oronoque | 4.5% | 1.7%(+2.90)#26 | 1.9%(+2.66)#2,168 |
| 27. | Noroton Heights | 4.5% | 1.7%(+2.86)#27 | 1.9%(+2.62)#2,203 |
| 28. | Blue Hills | 4.4% | 1.7%(+2.78)#28 | 1.9%(+2.54)#2,263 |
| 29. | Stafford Springs | 4.3% | 1.7%(+2.67)#29 | 1.9%(+2.43)#2,355 |
| 30. | Cornwall | 4.3% | 1.7%(+2.63)#30 | 1.9%(+2.39)#2,375 |
| 31. | Old Saybrook Center | 4.2% | 1.7%(+2.53)#31 | 1.9%(+2.29)#2,464 |
| 32. | Glenville | 4.0% | 1.7%(+2.34)#32 | 1.9%(+2.10)#2,668 |
| 33. | Lakes East | 3.9% | 1.7%(+2.30)#33 | 1.9%(+2.06)#2,718 |
| 34. | Stepney | 3.8% | 1.7%(+2.12)#34 | 1.9%(+1.88)#2,923 |
| 35. | South Windham | 3.7% | 1.7%(+2.06)#35 | 1.9%(+1.82)#2,997 |
| 36. | Woodmont Borough | 3.7% | 1.7%(+2.00)#36 | 1.9%(+1.76)#3,080 |
| 37. | Stratford Downtown | 3.6% | 1.7%(+1.97)#37 | 1.9%(+1.73)#3,128 |
| 38. | Lordship | 3.5% | 1.7%(+1.89)#38 | 1.9%(+1.65)#3,234 |
| 39. | Old Hill | 3.5% | 1.7%(+1.86)#39 | 1.9%(+1.62)#3,276 |
| 40. | Tokeneke | 3.5% | 1.7%(+1.84)#40 | 1.9%(+1.60)#3,299 |
| 41. | Newtown Borough | 3.5% | 1.7%(+1.82)#41 | 1.9%(+1.59)#3,315 |
| 42. | Watertown | 3.4% | 1.7%(+1.75)#42 | 1.9%(+1.51)#3,417 |
| 43. | Riverside | 3.3% | 1.7%(+1.67)#43 | 1.9%(+1.43)#3,537 |
| 44. | Plainfield Village | 3.3% | 1.7%(+1.60)#44 | 1.9%(+1.36)#3,664 |
| 45. | Bigelow Corners | 3.2% | 1.7%(+1.58)#45 | 1.9%(+1.34)#3,705 |
| 46. | Ball Pond | 3.0% | 1.7%(+1.38)#46 | 1.9%(+1.14)#4,077 |
| 47. | Bethel | 3.0% | 1.7%(+1.36)#47 | 1.9%(+1.12)#4,097 |
| 48. | Jewett City Borough | 3.0% | 1.7%(+1.32)#48 | 1.9%(+1.08)#4,181 |
| 49. | Wilton Center | 2.8% | 1.7%(+1.16)#49 | 1.9%(+0.919)#4,530 |
| 50. | New Canaan | 2.8% | 1.7%(+1.10)#50 | 1.9%(+0.861)#4,646 |
| 51. | Shelton | 2.7% | 1.7%(+1.07)#51 | 1.9%(+0.828)#4,730 |
| 52. | New Milford | 2.6% | 1.7%(+0.917)#52 | 1.9%(+0.678)#5,156 |
| 53. | Weatogue | 2.5% | 1.7%(+0.854)#53 | 1.9%(+0.615)#5,316 |
| 54. | Derby | 2.4% | 1.7%(+0.783)#54 | 1.9%(+0.543)#5,540 |
| 55. | Noroton | 2.4% | 1.7%(+0.763)#55 | 1.9%(+0.524)#5,590 |
| 56. | Norwalk | 2.4% | 1.7%(+0.728)#56 | 1.9%(+0.489)#5,699 |
| 57. | Staples | 2.4% | 1.7%(+0.720)#57 | 1.9%(+0.480)#5,739 |
| 58. | Wallingford Center | 2.4% | 1.7%(+0.712)#58 | 1.9%(+0.473)#5,772 |
| 59. | North Haven | 2.4% | 1.7%(+0.712)#59 | 1.9%(+0.473)#5,775 |
| 60. | Stamford | 2.4% | 1.7%(+0.698)#60 | 1.9%(+0.459)#5,812 |
| 61. | Simsbury Center | 2.3% | 1.7%(+0.656)#61 | 1.9%(+0.417)#5,934 |
| 62. | Candlewood Shores | 2.3% | 1.7%(+0.654)#62 | 1.9%(+0.414)#5,943 |
| 63. | Bethlehem Village | 2.3% | 1.7%(+0.628)#63 | 1.9%(+0.389)#6,024 |
| 64. | Litchfield Borough | 2.3% | 1.7%(+0.627)#64 | 1.9%(+0.388)#6,028 |
| 65. | Saybrook Manor | 2.3% | 1.7%(+0.620)#65 | 1.9%(+0.381)#6,053 |
| 66. | Stonington Borough | 2.1% | 1.7%(+0.495)#66 | 1.9%(+0.256)#6,503 |
| 67. | Bridgeport | 2.1% | 1.7%(+0.489)#67 | 1.9%(+0.250)#6,529 |
| 68. | Orange | 2.1% | 1.7%(+0.474)#68 | 1.9%(+0.235)#6,592 |
| 69. | Plattsville | 2.1% | 1.7%(+0.458)#69 | 1.9%(+0.219)#6,636 |
| 70. | Saugatuck | 2.1% | 1.7%(+0.435)#70 | 1.9%(+0.196)#6,717 |
| 71. | Westport | 2.1% | 1.7%(+0.416)#71 | 1.9%(+0.177)#6,782 |
| 72. | New Hartford Center | 2.1% | 1.7%(+0.409)#72 | 1.9%(+0.170)#6,804 |
| 73. | East | 2.0% | 1.7%(+0.364)#73 | 1.9%(+0.125)#6,975 |
| 74. | Cheshire Village | 2.0% | 1.7%(+0.325)#74 | 1.9%(+0.086)#7,150 |
| 75. | Daniels Farm | 1.9% | 1.7%(+0.281)#75 | 1.9%(+0.042)#7,321 |
| 76. | Putnam | 1.9% | 1.7%(+0.234)#76 | 1.9%(-0.005)#7,504 |
| 77. | Waterbury | 1.9% | 1.7%(+0.223)#77 | 1.9%(-0.016)#7,546 |
| 78. | Lakes West | 1.8% | 1.7%(+0.163)#78 | 1.9%(-0.076)#7,786 |
| 79. | Waterford | 1.8% | 1.7%(+0.132)#79 | 1.9%(-0.107)#7,904 |
| 80. | Hartford | 1.8% | 1.7%(+0.131)#80 | 1.9%(-0.108)#7,908 |
| 81. | Sandy Hook | 1.8% | 1.7%(+0.110)#81 | 1.9%(-0.130)#7,991 |
| 82. | East Hartford | 1.7% | 1.7%(+0.083)#82 | 1.9%(-0.156)#8,122 |
| 83. | Bantam Borough | 1.7% | 1.7%(+0.082)#83 | 1.9%(-0.158)#8,131 |
| 84. | Danbury | 1.7% | 1.7%(+0.014)#84 | 1.9%(-0.225)#8,457 |
| 85. | Naugatuck Borough | 1.7% | 1.7%(+0.009)#85 | 1.9%(-0.231)#8,481 |
| 86. | Plantsville | 1.6% | 1.7%(-0.010)#86 | 1.9%(-0.250)#8,568 |
| 87. | Durham | 1.6% | 1.7%(-0.016)#87 | 1.9%(-0.255)#8,589 |
| 88. | Higganum | 1.6% | 1.7%(-0.043)#88 | 1.9%(-0.282)#8,727 |
| 89. | West Hartford | 1.6% | 1.7%(-0.078)#89 | 1.9%(-0.317)#8,898 |
| 90. | Thomaston | 1.5% | 1.7%(-0.108)#90 | 1.9%(-0.347)#9,059 |
| 91. | Pawcatuck | 1.5% | 1.7%(-0.148)#91 | 1.9%(-0.387)#9,276 |
| 92. | Westbrook Center | 1.5% | 1.7%(-0.193)#92 | 1.9%(-0.432)#9,510 |
| 93. | Oxoboxo River | 1.5% | 1.7%(-0.198)#93 | 1.9%(-0.437)#9,531 |
| 94. | Byram | 1.5% | 1.7%(-0.198)#94 | 1.9%(-0.437)#9,533 |
| 95. | Middletown | 1.4% | 1.7%(-0.243)#95 | 1.9%(-0.482)#9,762 |
| 96. | Hazardville | 1.4% | 1.7%(-0.286)#96 | 1.9%(-0.526)#9,971 |
| 97. | Manchester | 1.4% | 1.7%(-0.291)#97 | 1.9%(-0.530)#10,000 |
| 98. | Old Mystic | 1.4% | 1.7%(-0.299)#98 | 1.9%(-0.538)#10,036 |
| 99. | East Haven | 1.3% | 1.7%(-0.354)#99 | 1.9%(-0.593)#10,327 |
| 100. | Trumbull Center | 1.3% | 1.7%(-0.390)#100 | 1.9%(-0.630)#10,531 |
Common Questions
What are the Top 10 Cities with the Highest Percentage of Population Employed in Real Estate, Rental & Leasing in Connecticut?
Top 10 Cities with the Highest Percentage of Population Employed in Real Estate, Rental & Leasing in Connecticut are:
#1
10.7%
#2
9.1%
#3
7.6%
#4
7.5%
#5
7.0%
#6
5.9%
#7
5.8%
#8
5.4%
#9
5.4%
#10
5.3%
What city has the Highest Percentage of Population Employed in Real Estate, Rental & Leasing in Connecticut?
Southport has the Highest Percentage of Population Employed in Real Estate, Rental & Leasing in Connecticut with 10.7%.
What is the Percentage of Population Employed in Real Estate, Rental & Leasing in the State of Connecticut?
Percentage of Population Employed in Real Estate, Rental & Leasing in Connecticut is 1.7%.
What is the Percentage of Population Employed in Real Estate, Rental & Leasing in the United States?
Percentage of Population Employed in Real Estate, Rental & Leasing in the United States is 1.9%.