Cities with the Highest Percentage of Population Employed in Real Estate, Rental & Leasing in Kansas
RELATED REPORTS & OPTIONS
Real Estate, Rental & Leasing
Kansas
Compare Cities
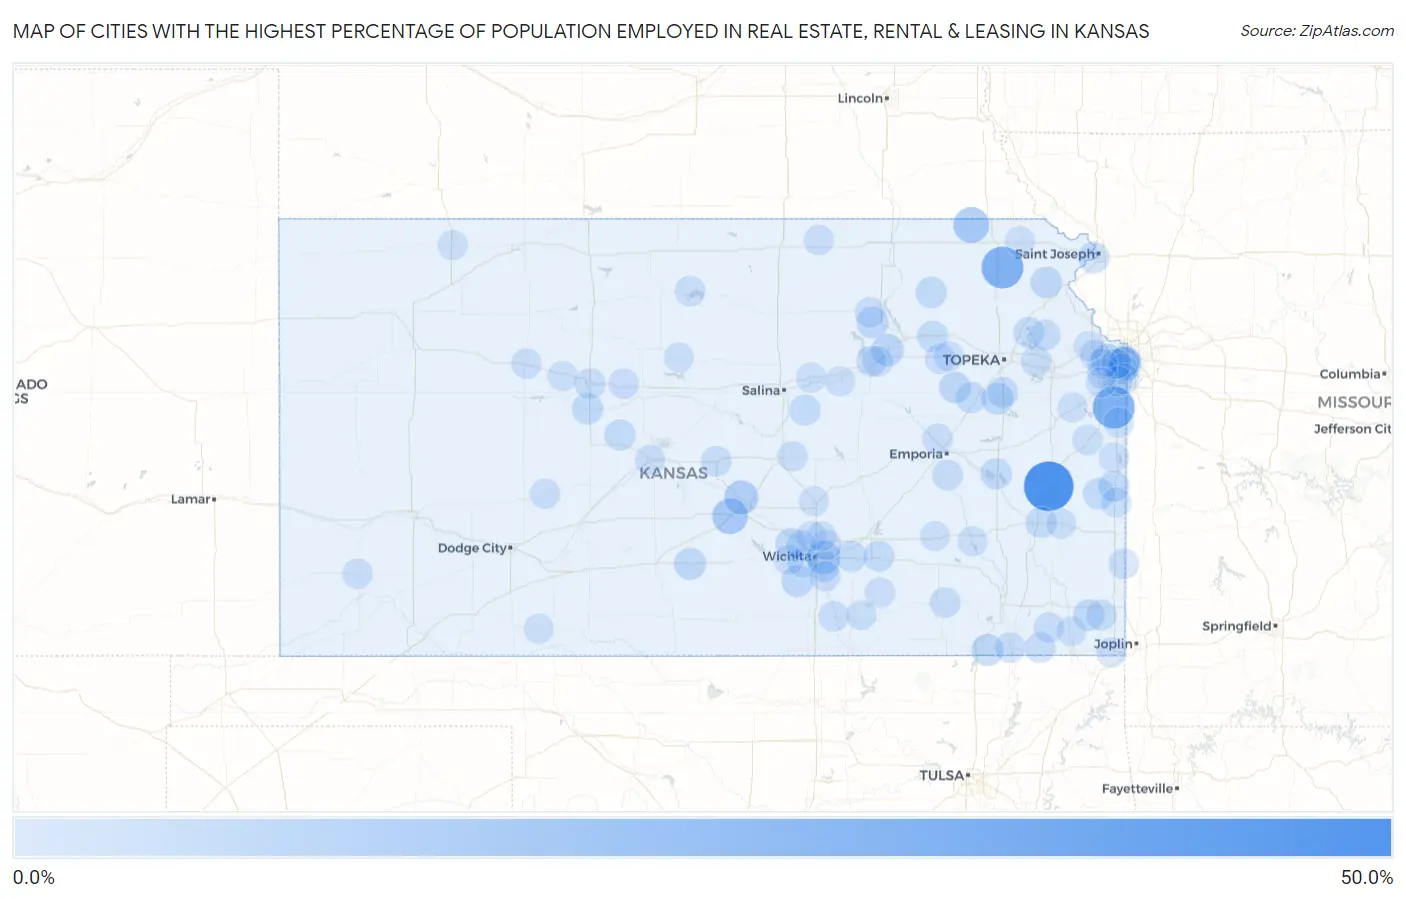
Map of Cities with the Highest Percentage of Population Employed in Real Estate, Rental & Leasing in Kansas
0.0%
50.0%
Cities with the Highest Percentage of Population Employed in Real Estate, Rental & Leasing in Kansas
| City | % Employed | vs State | vs National | |
| 1. | Welda | 44.4% | 1.4%(+43.1)#1 | 1.9%(+42.6)#28 |
| 2. | Bucyrus | 27.3% | 1.4%(+25.9)#2 | 1.9%(+25.4)#84 |
| 3. | Kickapoo Site 5 | 26.7% | 1.4%(+25.3)#3 | 1.9%(+24.8)#88 |
| 4. | Furley | 21.4% | 1.4%(+20.1)#4 | 1.9%(+19.5)#138 |
| 5. | Bern | 13.3% | 1.4%(+12.0)#5 | 1.9%(+11.4)#299 |
| 6. | Partridge | 12.6% | 1.4%(+11.3)#6 | 1.9%(+10.8)#337 |
| 7. | Willowbrook | 9.7% | 1.4%(+8.30)#7 | 1.9%(+7.79)#573 |
| 8. | Eastborough | 8.5% | 1.4%(+7.09)#8 | 1.9%(+6.58)#729 |
| 9. | Mission Hills | 8.1% | 1.4%(+6.70)#9 | 1.9%(+6.19)#809 |
| 10. | Ogden | 6.2% | 1.4%(+4.86)#10 | 1.9%(+4.35)#1,282 |
| 11. | Lake Quivira | 6.2% | 1.4%(+4.80)#11 | 1.9%(+4.28)#1,308 |
| 12. | Tyro | 5.3% | 1.4%(+3.89)#12 | 1.9%(+3.37)#1,708 |
| 13. | Scranton | 5.2% | 1.4%(+3.81)#13 | 1.9%(+3.30)#1,755 |
| 14. | Cunningham | 4.9% | 1.4%(+3.54)#14 | 1.9%(+3.03)#1,908 |
| 15. | Westwood | 4.8% | 1.4%(+3.45)#15 | 1.9%(+2.93)#1,979 |
| 16. | Eskridge | 4.7% | 1.4%(+3.36)#16 | 1.9%(+2.84)#2,037 |
| 17. | Riley | 4.7% | 1.4%(+3.35)#17 | 1.9%(+2.83)#2,044 |
| 18. | Fairway | 4.6% | 1.4%(+3.27)#18 | 1.9%(+2.76)#2,104 |
| 19. | Clearwater | 4.6% | 1.4%(+3.23)#19 | 1.9%(+2.71)#2,133 |
| 20. | Colwich | 4.6% | 1.4%(+3.20)#20 | 1.9%(+2.68)#2,153 |
| 21. | Lancaster | 4.5% | 1.4%(+3.12)#21 | 1.9%(+2.61)#2,212 |
| 22. | Elwood | 4.2% | 1.4%(+2.78)#22 | 1.9%(+2.27)#2,486 |
| 23. | Mound City | 4.1% | 1.4%(+2.73)#23 | 1.9%(+2.21)#2,546 |
| 24. | Wheaton | 4.1% | 1.4%(+2.70)#24 | 1.9%(+2.19)#2,578 |
| 25. | New Strawn | 4.0% | 1.4%(+2.62)#25 | 1.9%(+2.11)#2,657 |
| 26. | West Mineral | 3.9% | 1.4%(+2.54)#26 | 1.9%(+2.03)#2,744 |
| 27. | Schoenchen | 3.9% | 1.4%(+2.50)#27 | 1.9%(+1.98)#2,802 |
| 28. | Harveyville | 3.7% | 1.4%(+2.37)#28 | 1.9%(+1.86)#2,952 |
| 29. | Mcconnell Afb | 3.6% | 1.4%(+2.25)#29 | 1.9%(+1.74)#3,117 |
| 30. | Otis | 3.6% | 1.4%(+2.25)#30 | 1.9%(+1.73)#3,129 |
| 31. | Gypsum | 3.6% | 1.4%(+2.19)#31 | 1.9%(+1.68)#3,197 |
| 32. | Wamego | 3.6% | 1.4%(+2.18)#32 | 1.9%(+1.66)#3,217 |
| 33. | Gas | 3.5% | 1.4%(+2.14)#33 | 1.9%(+1.63)#3,269 |
| 34. | Carbondale | 3.4% | 1.4%(+1.98)#34 | 1.9%(+1.47)#3,476 |
| 35. | Augusta | 3.3% | 1.4%(+1.89)#35 | 1.9%(+1.37)#3,646 |
| 36. | Ozawkie | 3.2% | 1.4%(+1.83)#36 | 1.9%(+1.31)#3,763 |
| 37. | Leon | 3.1% | 1.4%(+1.72)#37 | 1.9%(+1.20)#3,940 |
| 38. | Pleasanton | 3.1% | 1.4%(+1.71)#38 | 1.9%(+1.20)#3,943 |
| 39. | Leawood | 3.1% | 1.4%(+1.68)#39 | 1.9%(+1.17)#4,002 |
| 40. | Hays | 2.9% | 1.4%(+1.55)#40 | 1.9%(+1.03)#4,275 |
| 41. | Prairie Village | 2.9% | 1.4%(+1.50)#41 | 1.9%(+0.989)#4,363 |
| 42. | Lecompton | 2.8% | 1.4%(+1.40)#42 | 1.9%(+0.886)#4,582 |
| 43. | Edna | 2.7% | 1.4%(+1.37)#43 | 1.9%(+0.856)#4,662 |
| 44. | Olpe | 2.7% | 1.4%(+1.36)#44 | 1.9%(+0.843)#4,699 |
| 45. | Scammon | 2.7% | 1.4%(+1.33)#45 | 1.9%(+0.811)#4,779 |
| 46. | Overland Park | 2.6% | 1.4%(+1.24)#46 | 1.9%(+0.726)#5,019 |
| 47. | Oskaloosa | 2.6% | 1.4%(+1.24)#47 | 1.9%(+0.725)#5,021 |
| 48. | Elk Falls | 2.6% | 1.4%(+1.19)#48 | 1.9%(+0.672)#5,177 |
| 49. | Lyons | 2.4% | 1.4%(+0.988)#49 | 1.9%(+0.473)#5,770 |
| 50. | Grandview Plaza | 2.4% | 1.4%(+0.974)#50 | 1.9%(+0.460)#5,807 |
| 51. | Oxford | 2.3% | 1.4%(+0.903)#51 | 1.9%(+0.388)#6,026 |
| 52. | Junction City | 2.3% | 1.4%(+0.891)#52 | 1.9%(+0.377)#6,073 |
| 53. | Osawatomie | 2.2% | 1.4%(+0.832)#53 | 1.9%(+0.317)#6,276 |
| 54. | Coffeyville | 2.2% | 1.4%(+0.812)#54 | 1.9%(+0.298)#6,352 |
| 55. | Arcadia | 2.2% | 1.4%(+0.797)#55 | 1.9%(+0.282)#6,422 |
| 56. | Gorham | 2.2% | 1.4%(+0.785)#56 | 1.9%(+0.270)#6,464 |
| 57. | Louisburg | 2.1% | 1.4%(+0.753)#57 | 1.9%(+0.238)#6,571 |
| 58. | Bonner Springs | 2.1% | 1.4%(+0.753)#58 | 1.9%(+0.238)#6,574 |
| 59. | Lenexa | 2.1% | 1.4%(+0.745)#59 | 1.9%(+0.231)#6,603 |
| 60. | Americus | 2.1% | 1.4%(+0.742)#60 | 1.9%(+0.228)#6,614 |
| 61. | Leonardville | 2.1% | 1.4%(+0.706)#61 | 1.9%(+0.192)#6,729 |
| 62. | Merriam | 2.0% | 1.4%(+0.672)#62 | 1.9%(+0.158)#6,855 |
| 63. | Atlanta | 2.0% | 1.4%(+0.663)#63 | 1.9%(+0.149)#6,888 |
| 64. | Ulysses | 2.0% | 1.4%(+0.652)#64 | 1.9%(+0.138)#6,923 |
| 65. | Cawker City | 2.0% | 1.4%(+0.623)#65 | 1.9%(+0.108)#7,052 |
| 66. | Mcfarland | 1.9% | 1.4%(+0.501)#66 | 1.9%(-0.014)#7,538 |
| 67. | Wakeeney | 1.9% | 1.4%(+0.484)#67 | 1.9%(-0.031)#7,595 |
| 68. | Haddam | 1.9% | 1.4%(+0.475)#68 | 1.9%(-0.040)#7,636 |
| 69. | Wichita | 1.7% | 1.4%(+0.363)#69 | 1.9%(-0.152)#8,099 |
| 70. | Goddard | 1.7% | 1.4%(+0.360)#70 | 1.9%(-0.155)#8,117 |
| 71. | Bel Aire | 1.7% | 1.4%(+0.326)#71 | 1.9%(-0.188)#8,266 |
| 72. | Altamont | 1.7% | 1.4%(+0.320)#72 | 1.9%(-0.194)#8,295 |
| 73. | Shawnee | 1.7% | 1.4%(+0.316)#73 | 1.9%(-0.198)#8,322 |
| 74. | Galva | 1.7% | 1.4%(+0.298)#74 | 1.9%(-0.217)#8,417 |
| 75. | Derby | 1.7% | 1.4%(+0.288)#75 | 1.9%(-0.226)#8,459 |
| 76. | Winfield | 1.7% | 1.4%(+0.275)#76 | 1.9%(-0.240)#8,524 |
| 77. | Hanston | 1.6% | 1.4%(+0.236)#77 | 1.9%(-0.279)#8,712 |
| 78. | Great Bend | 1.6% | 1.4%(+0.222)#78 | 1.9%(-0.292)#8,780 |
| 79. | Valley Center | 1.6% | 1.4%(+0.212)#79 | 1.9%(-0.302)#8,815 |
| 80. | Solomon | 1.6% | 1.4%(+0.196)#80 | 1.9%(-0.319)#8,905 |
| 81. | Olathe | 1.6% | 1.4%(+0.194)#81 | 1.9%(-0.320)#8,916 |
| 82. | Basehor | 1.5% | 1.4%(+0.171)#82 | 1.9%(-0.344)#9,040 |
| 83. | Ellis | 1.5% | 1.4%(+0.170)#83 | 1.9%(-0.344)#9,043 |
| 84. | North Newton | 1.5% | 1.4%(+0.150)#84 | 1.9%(-0.364)#9,152 |
| 85. | Moran | 1.5% | 1.4%(+0.138)#85 | 1.9%(-0.377)#9,232 |
| 86. | Wellsville | 1.5% | 1.4%(+0.135)#86 | 1.9%(-0.380)#9,247 |
| 87. | Linn Valley | 1.5% | 1.4%(+0.106)#87 | 1.9%(-0.409)#9,378 |
| 88. | Oswego | 1.4% | 1.4%(+0.068)#88 | 1.9%(-0.447)#9,589 |
| 89. | Paxico | 1.4% | 1.4%(+0.031)#89 | 1.9%(-0.483)#9,772 |
| 90. | Baxter Springs | 1.4% | 1.4%(-0.011)#90 | 1.9%(-0.526)#9,969 |
| 91. | Kechi | 1.3% | 1.4%(-0.035)#91 | 1.9%(-0.549)#10,095 |
| 92. | Enterprise | 1.3% | 1.4%(-0.035)#92 | 1.9%(-0.549)#10,100 |
| 93. | Maize | 1.3% | 1.4%(-0.043)#93 | 1.9%(-0.557)#10,137 |
| 94. | Lucas | 1.3% | 1.4%(-0.050)#94 | 1.9%(-0.564)#10,176 |
| 95. | Ashland | 1.3% | 1.4%(-0.062)#95 | 1.9%(-0.576)#10,231 |
| 96. | Prescott | 1.3% | 1.4%(-0.079)#96 | 1.9%(-0.593)#10,322 |
| 97. | Eureka | 1.3% | 1.4%(-0.091)#97 | 1.9%(-0.606)#10,390 |
| 98. | Oberlin | 1.3% | 1.4%(-0.108)#98 | 1.9%(-0.622)#10,487 |
| 99. | Hiawatha | 1.2% | 1.4%(-0.137)#99 | 1.9%(-0.651)#10,641 |
| 100. | Toronto | 1.2% | 1.4%(-0.143)#100 | 1.9%(-0.657)#10,689 |
Common Questions
What are the Top 10 Cities with the Highest Percentage of Population Employed in Real Estate, Rental & Leasing in Kansas?
Top 10 Cities with the Highest Percentage of Population Employed in Real Estate, Rental & Leasing in Kansas are:
#1
44.4%
#2
27.3%
#3
26.7%
#4
13.3%
#5
12.6%
#6
9.7%
#7
8.5%
#8
8.1%
#9
6.2%
#10
6.2%
What city has the Highest Percentage of Population Employed in Real Estate, Rental & Leasing in Kansas?
Welda has the Highest Percentage of Population Employed in Real Estate, Rental & Leasing in Kansas with 44.4%.
What is the Percentage of Population Employed in Real Estate, Rental & Leasing in the State of Kansas?
Percentage of Population Employed in Real Estate, Rental & Leasing in Kansas is 1.4%.
What is the Percentage of Population Employed in Real Estate, Rental & Leasing in the United States?
Percentage of Population Employed in Real Estate, Rental & Leasing in the United States is 1.9%.