Cities with the Highest Percentage of Population Employed in Real Estate, Rental & Leasing in South Carolina
RELATED REPORTS & OPTIONS
Real Estate, Rental & Leasing
South Carolina
Compare Cities
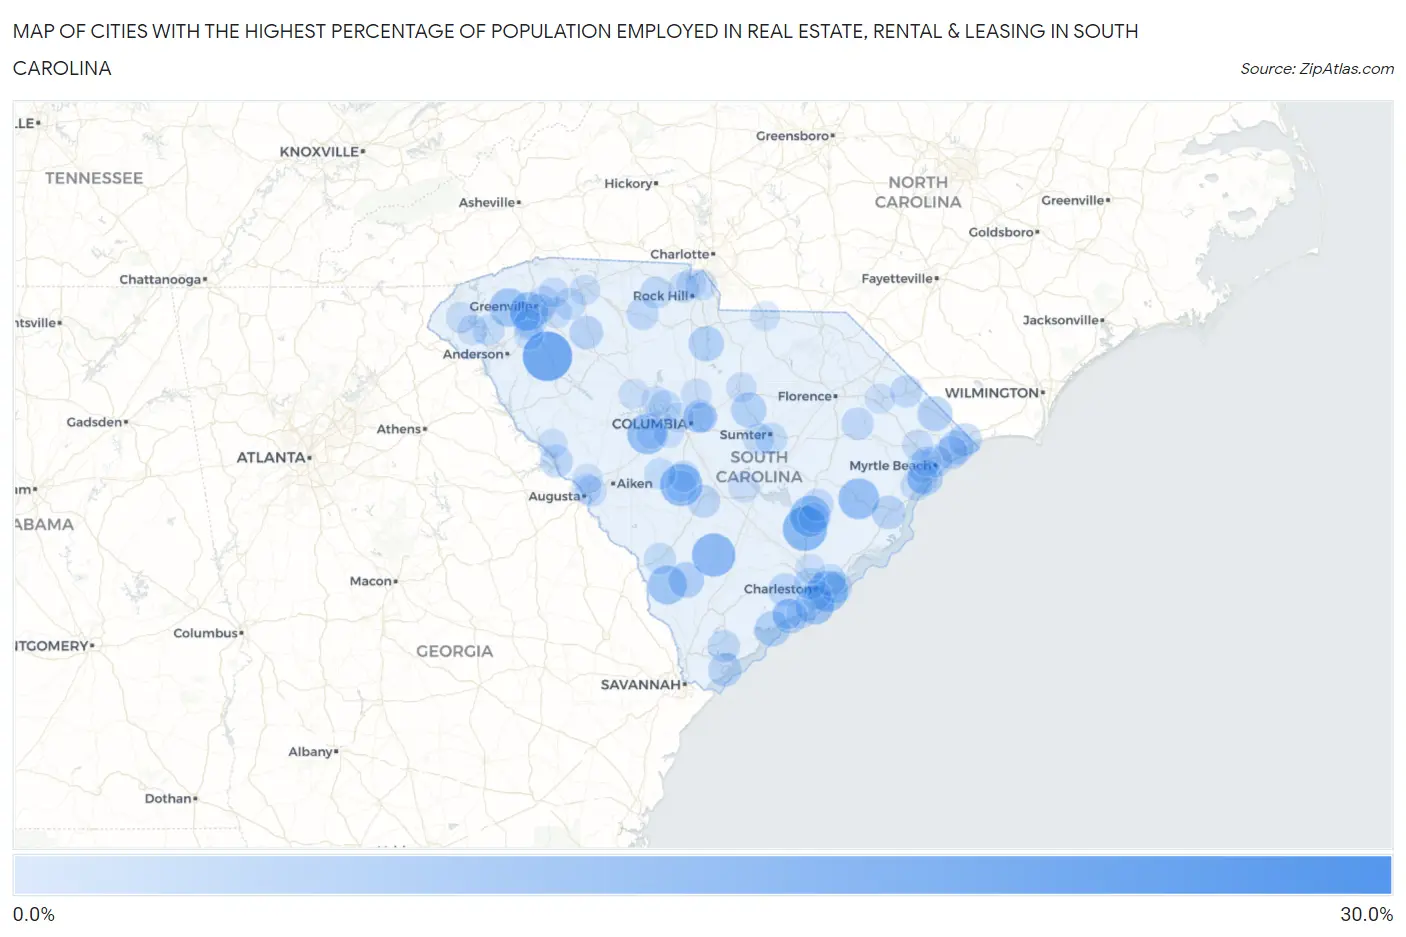
Map of Cities with the Highest Percentage of Population Employed in Real Estate, Rental & Leasing in South Carolina
0.0%
30.0%
Cities with the Highest Percentage of Population Employed in Real Estate, Rental & Leasing in South Carolina
| City | % Employed | vs State | vs National | |
| 1. | Pimlico | 29.0% | 2.0%(+27.0)#1 | 1.9%(+27.1)#71 |
| 2. | Princeton | 20.8% | 2.0%(+18.9)#2 | 1.9%(+18.9)#143 |
| 3. | Pinopolis | 15.7% | 2.0%(+13.8)#3 | 1.9%(+13.8)#225 |
| 4. | Williams | 14.8% | 2.0%(+12.9)#4 | 1.9%(+12.9)#254 |
| 5. | Livingston | 13.7% | 2.0%(+11.8)#5 | 1.9%(+11.8)#290 |
| 6. | Sullivan S Island | 12.4% | 2.0%(+10.4)#6 | 1.9%(+10.5)#352 |
| 7. | Bonneau Beach | 12.3% | 2.0%(+10.3)#7 | 1.9%(+10.4)#359 |
| 8. | Andrews | 12.3% | 2.0%(+10.3)#8 | 1.9%(+10.4)#361 |
| 9. | Summit | 12.3% | 2.0%(+10.3)#9 | 1.9%(+10.4)#362 |
| 10. | Luray | 10.6% | 2.0%(+8.62)#10 | 1.9%(+8.69)#480 |
| 11. | Folly Beach | 10.4% | 2.0%(+8.45)#11 | 1.9%(+8.52)#491 |
| 12. | Arial | 10.3% | 2.0%(+8.31)#12 | 1.9%(+8.38)#507 |
| 13. | Welcome | 10.0% | 2.0%(+8.07)#13 | 1.9%(+8.14)#530 |
| 14. | Fripp Island | 9.9% | 2.0%(+7.90)#14 | 1.9%(+7.97)#553 |
| 15. | Newtown | 8.4% | 2.0%(+6.48)#15 | 1.9%(+6.55)#737 |
| 16. | Surfside Beach | 7.6% | 2.0%(+5.59)#16 | 1.9%(+5.66)#916 |
| 17. | Varnville | 7.4% | 2.0%(+5.47)#17 | 1.9%(+5.54)#944 |
| 18. | Edisto Beach | 7.2% | 2.0%(+5.25)#18 | 1.9%(+5.32)#990 |
| 19. | Great Falls | 7.2% | 2.0%(+5.22)#19 | 1.9%(+5.29)#998 |
| 20. | Rembert | 6.9% | 2.0%(+4.97)#20 | 1.9%(+5.04)#1,060 |
| 21. | Loris | 6.7% | 2.0%(+4.73)#21 | 1.9%(+4.80)#1,115 |
| 22. | Seabrook Island | 6.6% | 2.0%(+4.68)#22 | 1.9%(+4.75)#1,136 |
| 23. | Drayton | 6.2% | 2.0%(+4.25)#23 | 1.9%(+4.32)#1,293 |
| 24. | North Myrtle Beach | 6.2% | 2.0%(+4.20)#24 | 1.9%(+4.27)#1,313 |
| 25. | Enoree | 5.5% | 2.0%(+3.57)#25 | 1.9%(+3.64)#1,577 |
| 26. | Georgetown | 5.5% | 2.0%(+3.55)#26 | 1.9%(+3.62)#1,590 |
| 27. | Ravenel | 5.4% | 2.0%(+3.47)#27 | 1.9%(+3.54)#1,619 |
| 28. | Hilton Head Island | 5.4% | 2.0%(+3.44)#28 | 1.9%(+3.51)#1,638 |
| 29. | Little River | 5.4% | 2.0%(+3.43)#29 | 1.9%(+3.50)#1,642 |
| 30. | Wyboo | 5.4% | 2.0%(+3.41)#30 | 1.9%(+3.48)#1,657 |
| 31. | Briarcliffe Acres | 5.2% | 2.0%(+3.19)#31 | 1.9%(+3.26)#1,780 |
| 32. | Arcadia Lakes | 5.1% | 2.0%(+3.14)#32 | 1.9%(+3.21)#1,799 |
| 33. | Modoc | 4.8% | 2.0%(+2.88)#33 | 1.9%(+2.95)#1,970 |
| 34. | Cordova | 4.8% | 2.0%(+2.80)#34 | 1.9%(+2.87)#2,011 |
| 35. | Debordieu Colony | 4.7% | 2.0%(+2.76)#35 | 1.9%(+2.83)#2,049 |
| 36. | Port Royal | 4.5% | 2.0%(+2.51)#36 | 1.9%(+2.58)#2,235 |
| 37. | Socastee | 4.5% | 2.0%(+2.49)#37 | 1.9%(+2.56)#2,246 |
| 38. | Pamplico | 4.5% | 2.0%(+2.49)#38 | 1.9%(+2.56)#2,249 |
| 39. | Myrtle Beach | 4.4% | 2.0%(+2.39)#39 | 1.9%(+2.46)#2,320 |
| 40. | St Stephen | 4.3% | 2.0%(+2.35)#40 | 1.9%(+2.42)#2,356 |
| 41. | Nichols | 4.3% | 2.0%(+2.32)#41 | 1.9%(+2.39)#2,374 |
| 42. | Lockhart | 4.3% | 2.0%(+2.29)#42 | 1.9%(+2.36)#2,395 |
| 43. | Sharon | 4.2% | 2.0%(+2.20)#43 | 1.9%(+2.27)#2,478 |
| 44. | Lake Murray Of Richland | 4.1% | 2.0%(+2.11)#44 | 1.9%(+2.18)#2,586 |
| 45. | Isle Of Palms | 4.0% | 2.0%(+2.03)#45 | 1.9%(+2.10)#2,666 |
| 46. | Mount Pleasant | 4.0% | 2.0%(+1.99)#46 | 1.9%(+2.06)#2,712 |
| 47. | South Sumter | 3.9% | 2.0%(+1.97)#47 | 1.9%(+2.04)#2,735 |
| 48. | Allendale | 3.9% | 2.0%(+1.95)#48 | 1.9%(+2.02)#2,754 |
| 49. | Carolina Forest | 3.9% | 2.0%(+1.92)#49 | 1.9%(+1.99)#2,787 |
| 50. | Charleston | 3.8% | 2.0%(+1.82)#50 | 1.9%(+1.89)#2,905 |
| 51. | Cane Savannah | 3.7% | 2.0%(+1.79)#51 | 1.9%(+1.86)#2,947 |
| 52. | Reidville | 3.7% | 2.0%(+1.69)#52 | 1.9%(+1.76)#3,071 |
| 53. | Clemson | 3.7% | 2.0%(+1.69)#53 | 1.9%(+1.76)#3,084 |
| 54. | Baxter | 3.6% | 2.0%(+1.69)#54 | 1.9%(+1.76)#3,087 |
| 55. | Golden Grove | 3.6% | 2.0%(+1.65)#55 | 1.9%(+1.72)#3,141 |
| 56. | Neeses | 3.6% | 2.0%(+1.61)#56 | 1.9%(+1.68)#3,195 |
| 57. | North | 3.6% | 2.0%(+1.59)#57 | 1.9%(+1.66)#3,225 |
| 58. | Perry | 3.5% | 2.0%(+1.58)#58 | 1.9%(+1.65)#3,240 |
| 59. | Murrells Inlet | 3.5% | 2.0%(+1.57)#59 | 1.9%(+1.64)#3,258 |
| 60. | Wade Hampton | 3.2% | 2.0%(+1.25)#60 | 1.9%(+1.32)#3,757 |
| 61. | Five Forks | 3.1% | 2.0%(+1.16)#61 | 1.9%(+1.23)#3,902 |
| 62. | Walhalla | 3.1% | 2.0%(+1.16)#62 | 1.9%(+1.23)#3,910 |
| 63. | Clearwater | 3.1% | 2.0%(+1.10)#63 | 1.9%(+1.17)#3,994 |
| 64. | Fort Mill | 3.0% | 2.0%(+1.06)#64 | 1.9%(+1.13)#4,080 |
| 65. | Newport | 3.0% | 2.0%(+1.05)#65 | 1.9%(+1.12)#4,093 |
| 66. | Conway | 2.8% | 2.0%(+0.868)#66 | 1.9%(+0.938)#4,474 |
| 67. | Forest Acres | 2.8% | 2.0%(+0.855)#67 | 1.9%(+0.925)#4,505 |
| 68. | Elloree | 2.8% | 2.0%(+0.829)#68 | 1.9%(+0.899)#4,570 |
| 69. | Red Bank | 2.7% | 2.0%(+0.788)#69 | 1.9%(+0.858)#4,656 |
| 70. | Chickasaw Point | 2.7% | 2.0%(+0.741)#70 | 1.9%(+0.811)#4,778 |
| 71. | Blythewood | 2.7% | 2.0%(+0.708)#71 | 1.9%(+0.778)#4,861 |
| 72. | Chapin | 2.6% | 2.0%(+0.687)#72 | 1.9%(+0.757)#4,926 |
| 73. | Seneca | 2.6% | 2.0%(+0.614)#73 | 1.9%(+0.684)#5,136 |
| 74. | Camden | 2.5% | 2.0%(+0.583)#74 | 1.9%(+0.653)#5,223 |
| 75. | Saxon | 2.5% | 2.0%(+0.581)#75 | 1.9%(+0.651)#5,229 |
| 76. | Litchfield Beach | 2.5% | 2.0%(+0.563)#76 | 1.9%(+0.633)#5,277 |
| 77. | Gilbert | 2.5% | 2.0%(+0.547)#77 | 1.9%(+0.617)#5,311 |
| 78. | Garden City | 2.5% | 2.0%(+0.501)#78 | 1.9%(+0.571)#5,440 |
| 79. | Greenville | 2.5% | 2.0%(+0.500)#79 | 1.9%(+0.570)#5,442 |
| 80. | Greer | 2.5% | 2.0%(+0.500)#80 | 1.9%(+0.570)#5,443 |
| 81. | Piedmont | 2.5% | 2.0%(+0.496)#81 | 1.9%(+0.566)#5,453 |
| 82. | James Island | 2.5% | 2.0%(+0.495)#82 | 1.9%(+0.565)#5,462 |
| 83. | Rockville | 2.4% | 2.0%(+0.477)#83 | 1.9%(+0.547)#5,528 |
| 84. | Marion | 2.4% | 2.0%(+0.460)#84 | 1.9%(+0.530)#5,572 |
| 85. | Powdersville | 2.4% | 2.0%(+0.424)#85 | 1.9%(+0.494)#5,685 |
| 86. | North Augusta | 2.4% | 2.0%(+0.419)#86 | 1.9%(+0.489)#5,714 |
| 87. | Seabrook | 2.3% | 2.0%(+0.369)#87 | 1.9%(+0.439)#5,865 |
| 88. | Hanahan | 2.3% | 2.0%(+0.343)#88 | 1.9%(+0.413)#5,949 |
| 89. | India Hook | 2.3% | 2.0%(+0.333)#89 | 1.9%(+0.403)#5,975 |
| 90. | Murphys Estates | 2.3% | 2.0%(+0.325)#90 | 1.9%(+0.395)#6,001 |
| 91. | Kiawah Island | 2.3% | 2.0%(+0.304)#91 | 1.9%(+0.374)#6,083 |
| 92. | Seven Oaks | 2.3% | 2.0%(+0.303)#92 | 1.9%(+0.373)#6,088 |
| 93. | Pelzer | 2.3% | 2.0%(+0.291)#93 | 1.9%(+0.361)#6,135 |
| 94. | Plum Branch | 2.2% | 2.0%(+0.260)#94 | 1.9%(+0.331)#6,246 |
| 95. | Whitney | 2.2% | 2.0%(+0.254)#95 | 1.9%(+0.324)#6,255 |
| 96. | Prosperity | 2.2% | 2.0%(+0.236)#96 | 1.9%(+0.306)#6,322 |
| 97. | Pageland | 2.2% | 2.0%(+0.212)#97 | 1.9%(+0.282)#6,416 |
| 98. | Columbia | 2.2% | 2.0%(+0.195)#98 | 1.9%(+0.265)#6,478 |
| 99. | Forestbrook | 2.1% | 2.0%(+0.179)#99 | 1.9%(+0.249)#6,530 |
| 100. | Bonneau | 2.1% | 2.0%(+0.166)#100 | 1.9%(+0.236)#6,585 |
Common Questions
What are the Top 10 Cities with the Highest Percentage of Population Employed in Real Estate, Rental & Leasing in South Carolina?
Top 10 Cities with the Highest Percentage of Population Employed in Real Estate, Rental & Leasing in South Carolina are:
#1
20.8%
#2
15.7%
#3
14.8%
#4
13.7%
#5
12.4%
#6
12.3%
#7
12.3%
#8
12.3%
#9
10.6%
#10
10.4%
What city has the Highest Percentage of Population Employed in Real Estate, Rental & Leasing in South Carolina?
Princeton has the Highest Percentage of Population Employed in Real Estate, Rental & Leasing in South Carolina with 20.8%.
What is the Percentage of Population Employed in Real Estate, Rental & Leasing in the State of South Carolina?
Percentage of Population Employed in Real Estate, Rental & Leasing in South Carolina is 2.0%.
What is the Percentage of Population Employed in Real Estate, Rental & Leasing in the United States?
Percentage of Population Employed in Real Estate, Rental & Leasing in the United States is 1.9%.