Zip Codes with the Highest Percentage of Population Employed in Real Estate, Rental & Leasing in Santa Clarita, CA
RELATED REPORTS & OPTIONS
Real Estate, Rental & Leasing
Santa Clarita
Compare Zip Codes
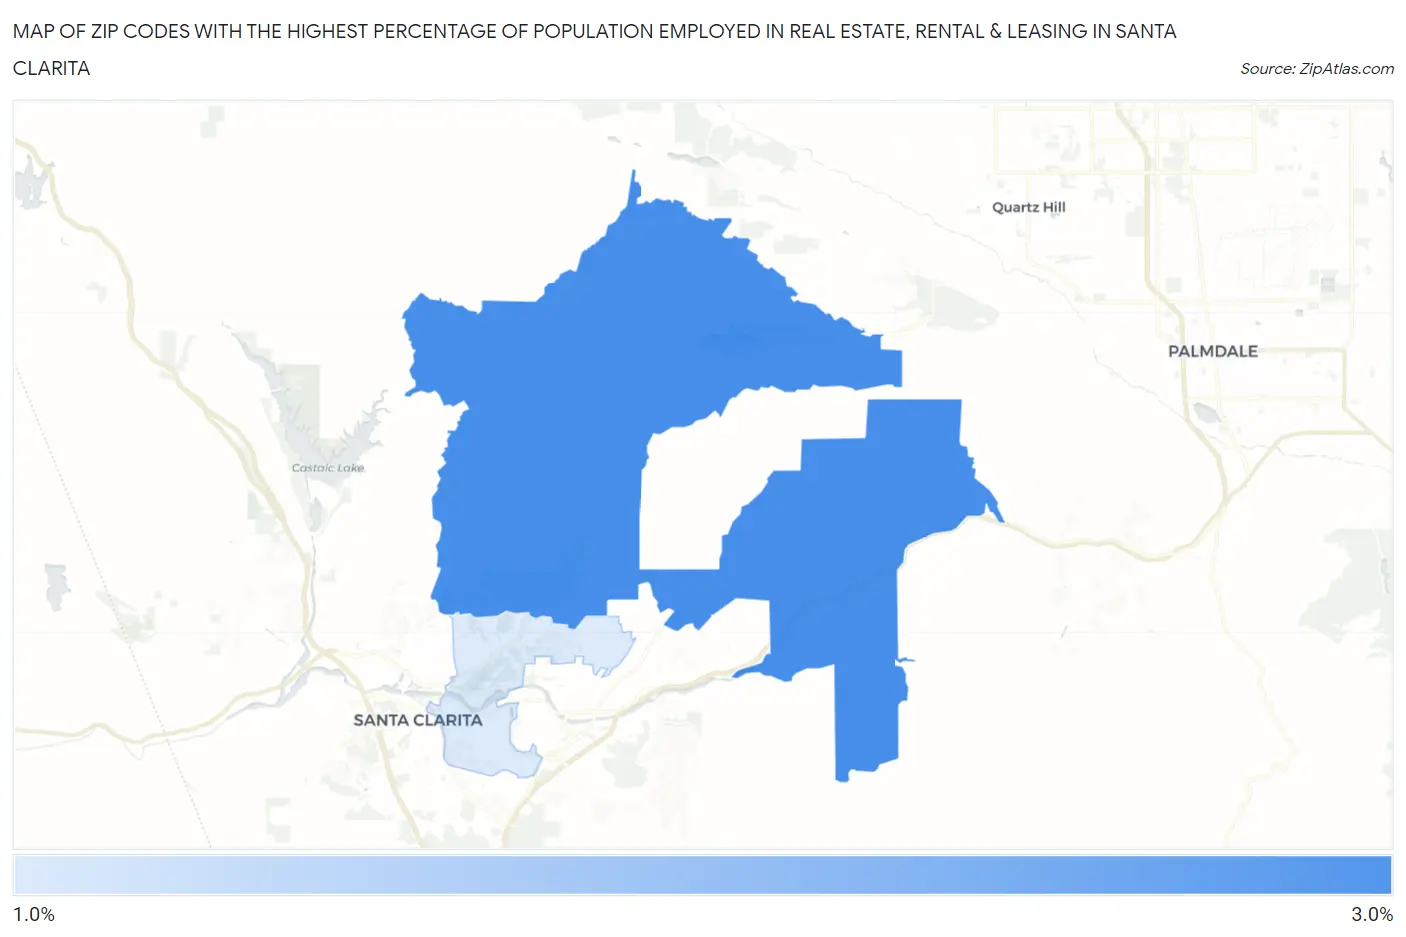
Map of Zip Codes with the Highest Percentage of Population Employed in Real Estate, Rental & Leasing in Santa Clarita
1.3%
2.7%
Zip Codes with the Highest Percentage of Population Employed in Real Estate, Rental & Leasing in Santa Clarita, CA
| Zip Code | % Employed | vs State | vs National | |
| 1. | 91390 | 2.7% | 2.1%(+0.555)#447 | 1.9%(+0.782)#4,832 |
| 2. | 91350 | 1.3% | 2.1%(-0.790)#1,022 | 1.9%(-0.562)#12,492 |
1
Common Questions
What are the Top Zip Codes with the Highest Percentage of Population Employed in Real Estate, Rental & Leasing in Santa Clarita, CA?
Top Zip Codes with the Highest Percentage of Population Employed in Real Estate, Rental & Leasing in Santa Clarita, CA are:
What zip code has the Highest Percentage of Population Employed in Real Estate, Rental & Leasing in Santa Clarita, CA?
91390 has the Highest Percentage of Population Employed in Real Estate, Rental & Leasing in Santa Clarita, CA with 2.7%.
What is the Percentage of Population Employed in Real Estate, Rental & Leasing in Santa Clarita, CA?
Percentage of Population Employed in Real Estate, Rental & Leasing in Santa Clarita is 2.2%.
What is the Percentage of Population Employed in Real Estate, Rental & Leasing in California?
Percentage of Population Employed in Real Estate, Rental & Leasing in California is 2.1%.
What is the Percentage of Population Employed in Real Estate, Rental & Leasing in the United States?
Percentage of Population Employed in Real Estate, Rental & Leasing in the United States is 1.9%.