Cities with the Highest Percentage of Population Employed in Real Estate, Rental & Leasing in Illinois
RELATED REPORTS & OPTIONS
Real Estate, Rental & Leasing
Illinois
Compare Cities
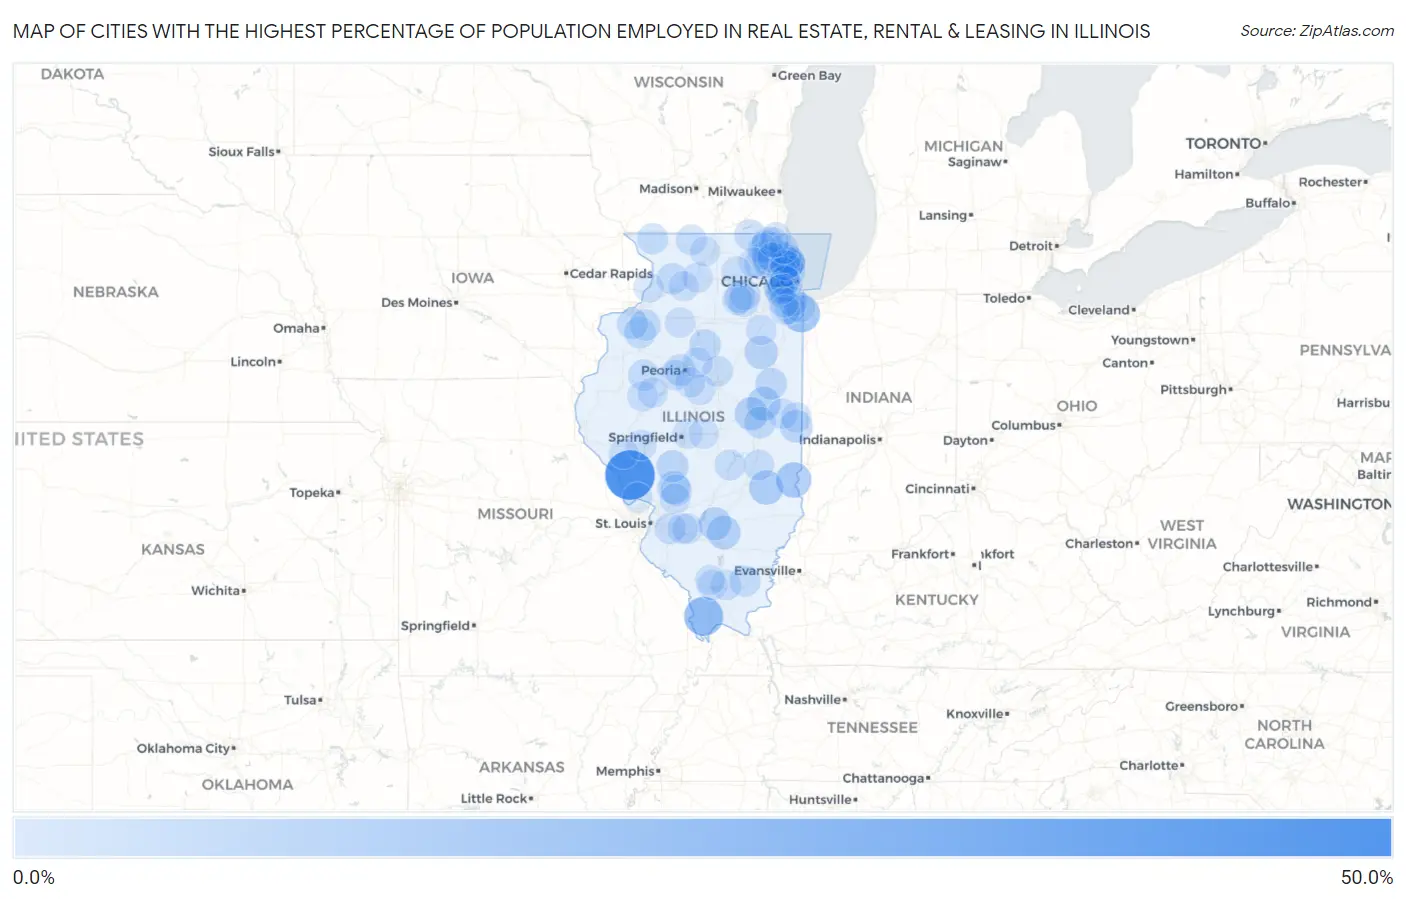
Map of Cities with the Highest Percentage of Population Employed in Real Estate, Rental & Leasing in Illinois
0.0%
50.0%
Cities with the Highest Percentage of Population Employed in Real Estate, Rental & Leasing in Illinois
| City | % Employed | vs State | vs National | |
| 1. | Eldred | 43.8% | 1.7%(+42.0)#1 | 1.9%(+41.9)#30 |
| 2. | Mill Creek | 21.4% | 1.7%(+19.7)#2 | 1.9%(+19.5)#139 |
| 3. | Willowbrook | 17.9% | 1.7%(+16.2)#3 | 1.9%(+16.0)#185 |
| 4. | West Union | 13.7% | 1.7%(+12.0)#4 | 1.9%(+11.8)#289 |
| 5. | Riverside | 12.5% | 1.7%(+10.8)#5 | 1.9%(+10.6)#343 |
| 6. | Rose Hill | 11.8% | 1.7%(+10.1)#6 | 1.9%(+9.87)#392 |
| 7. | Thomasboro | 10.6% | 1.7%(+8.85)#7 | 1.9%(+8.66)#483 |
| 8. | Kings | 10.3% | 1.7%(+8.61)#8 | 1.9%(+8.43)#501 |
| 9. | Kell | 10.1% | 1.7%(+8.44)#9 | 1.9%(+8.25)#518 |
| 10. | Seymour | 9.6% | 1.7%(+7.88)#10 | 1.9%(+7.69)#580 |
| 11. | Kempton | 9.3% | 1.7%(+7.62)#11 | 1.9%(+7.43)#607 |
| 12. | Lawrence | 9.2% | 1.7%(+7.46)#12 | 1.9%(+7.27)#624 |
| 13. | Odin | 9.1% | 1.7%(+7.39)#13 | 1.9%(+7.20)#638 |
| 14. | Northfield | 8.2% | 1.7%(+6.54)#14 | 1.9%(+6.35)#767 |
| 15. | Eagarville | 8.2% | 1.7%(+6.51)#15 | 1.9%(+6.33)#773 |
| 16. | Glencoe | 8.2% | 1.7%(+6.49)#16 | 1.9%(+6.30)#783 |
| 17. | Olivet | 8.1% | 1.7%(+6.40)#17 | 1.9%(+6.22)#806 |
| 18. | Edgington | 7.5% | 1.7%(+5.84)#18 | 1.9%(+5.66)#918 |
| 19. | Willow Lake | 7.1% | 1.7%(+5.39)#19 | 1.9%(+5.20)#1,024 |
| 20. | Nilwood | 7.0% | 1.7%(+5.31)#20 | 1.9%(+5.13)#1,039 |
| 21. | Loda | 6.9% | 1.7%(+5.17)#21 | 1.9%(+4.98)#1,081 |
| 22. | Varna | 6.3% | 1.7%(+4.64)#22 | 1.9%(+4.46)#1,235 |
| 23. | Tolono | 6.3% | 1.7%(+4.56)#23 | 1.9%(+4.38)#1,257 |
| 24. | Alpha | 6.1% | 1.7%(+4.42)#24 | 1.9%(+4.24)#1,324 |
| 25. | Andover | 5.9% | 1.7%(+4.15)#25 | 1.9%(+3.96)#1,436 |
| 26. | Coleta | 5.8% | 1.7%(+4.11)#26 | 1.9%(+3.92)#1,454 |
| 27. | Mount Olive | 5.8% | 1.7%(+4.08)#27 | 1.9%(+3.90)#1,465 |
| 28. | Wilmette | 5.8% | 1.7%(+4.05)#28 | 1.9%(+3.86)#1,478 |
| 29. | Bellevue | 5.7% | 1.7%(+3.96)#29 | 1.9%(+3.77)#1,515 |
| 30. | Inverness | 5.7% | 1.7%(+3.95)#30 | 1.9%(+3.76)#1,521 |
| 31. | Hebron | 5.6% | 1.7%(+3.93)#31 | 1.9%(+3.74)#1,527 |
| 32. | Riverwoods | 5.6% | 1.7%(+3.90)#32 | 1.9%(+3.71)#1,543 |
| 33. | Sherrard | 5.5% | 1.7%(+3.82)#33 | 1.9%(+3.64)#1,576 |
| 34. | Ellisville | 5.3% | 1.7%(+3.56)#34 | 1.9%(+3.37)#1,711 |
| 35. | Apple Canyon Lake | 5.2% | 1.7%(+3.54)#35 | 1.9%(+3.35)#1,722 |
| 36. | Raleigh | 5.2% | 1.7%(+3.50)#36 | 1.9%(+3.32)#1,739 |
| 37. | Millbrook | 5.1% | 1.7%(+3.42)#37 | 1.9%(+3.24)#1,788 |
| 38. | Volo | 5.0% | 1.7%(+3.28)#38 | 1.9%(+3.09)#1,870 |
| 39. | Hinsdale | 4.9% | 1.7%(+3.20)#39 | 1.9%(+3.01)#1,922 |
| 40. | East Dundee | 4.9% | 1.7%(+3.15)#40 | 1.9%(+2.96)#1,958 |
| 41. | Shelbyville | 4.8% | 1.7%(+3.11)#41 | 1.9%(+2.92)#1,986 |
| 42. | Scott Afb | 4.7% | 1.7%(+3.04)#42 | 1.9%(+2.85)#2,029 |
| 43. | Lincolnwood | 4.7% | 1.7%(+3.03)#43 | 1.9%(+2.84)#2,039 |
| 44. | Rock City | 4.7% | 1.7%(+2.95)#44 | 1.9%(+2.76)#2,096 |
| 45. | Golf | 4.5% | 1.7%(+2.84)#45 | 1.9%(+2.65)#2,174 |
| 46. | Lerna | 4.5% | 1.7%(+2.84)#46 | 1.9%(+2.65)#2,176 |
| 47. | Willow Springs | 4.5% | 1.7%(+2.81)#47 | 1.9%(+2.62)#2,204 |
| 48. | Highland Park | 4.4% | 1.7%(+2.65)#48 | 1.9%(+2.47)#2,316 |
| 49. | Long Lake | 4.3% | 1.7%(+2.62)#49 | 1.9%(+2.43)#2,351 |
| 50. | Kappa | 4.3% | 1.7%(+2.61)#50 | 1.9%(+2.42)#2,359 |
| 51. | Sandwich | 4.3% | 1.7%(+2.57)#51 | 1.9%(+2.38)#2,379 |
| 52. | Lake Camelot | 4.2% | 1.7%(+2.51)#52 | 1.9%(+2.33)#2,429 |
| 53. | Plano | 4.2% | 1.7%(+2.49)#53 | 1.9%(+2.30)#2,449 |
| 54. | Germantown | 4.2% | 1.7%(+2.47)#54 | 1.9%(+2.28)#2,471 |
| 55. | Pittsburg | 4.1% | 1.7%(+2.42)#55 | 1.9%(+2.24)#2,515 |
| 56. | Metamora | 4.1% | 1.7%(+2.42)#56 | 1.9%(+2.23)#2,527 |
| 57. | Albers | 4.1% | 1.7%(+2.40)#57 | 1.9%(+2.22)#2,537 |
| 58. | Livingston | 4.1% | 1.7%(+2.36)#58 | 1.9%(+2.17)#2,592 |
| 59. | Fithian | 4.1% | 1.7%(+2.35)#59 | 1.9%(+2.16)#2,603 |
| 60. | Winnetka | 4.0% | 1.7%(+2.34)#60 | 1.9%(+2.15)#2,619 |
| 61. | Ipava | 4.0% | 1.7%(+2.34)#61 | 1.9%(+2.15)#2,622 |
| 62. | Lynnville | 4.0% | 1.7%(+2.29)#62 | 1.9%(+2.11)#2,660 |
| 63. | Braceville | 4.0% | 1.7%(+2.27)#63 | 1.9%(+2.08)#2,687 |
| 64. | Barrington | 3.9% | 1.7%(+2.19)#64 | 1.9%(+2.01)#2,768 |
| 65. | Matteson | 3.9% | 1.7%(+2.18)#65 | 1.9%(+1.99)#2,791 |
| 66. | Lewistown | 3.9% | 1.7%(+2.15)#66 | 1.9%(+1.96)#2,824 |
| 67. | Lake Barrington | 3.8% | 1.7%(+2.10)#67 | 1.9%(+1.91)#2,877 |
| 68. | River Forest | 3.8% | 1.7%(+2.07)#68 | 1.9%(+1.89)#2,910 |
| 69. | Old Mill Creek | 3.8% | 1.7%(+2.07)#69 | 1.9%(+1.88)#2,919 |
| 70. | Lost Nation | 3.8% | 1.7%(+2.06)#70 | 1.9%(+1.88)#2,925 |
| 71. | Buda | 3.8% | 1.7%(+2.06)#71 | 1.9%(+1.87)#2,929 |
| 72. | Markham | 3.7% | 1.7%(+2.02)#72 | 1.9%(+1.84)#2,970 |
| 73. | Belgium | 3.7% | 1.7%(+2.00)#73 | 1.9%(+1.81)#3,016 |
| 74. | Carterville | 3.7% | 1.7%(+1.99)#74 | 1.9%(+1.80)#3,028 |
| 75. | Lake Holiday | 3.7% | 1.7%(+1.97)#75 | 1.9%(+1.78)#3,054 |
| 76. | Rosemont | 3.7% | 1.7%(+1.95)#76 | 1.9%(+1.76)#3,074 |
| 77. | Minier | 3.6% | 1.7%(+1.93)#77 | 1.9%(+1.74)#3,106 |
| 78. | Holiday Hills | 3.6% | 1.7%(+1.93)#78 | 1.9%(+1.74)#3,109 |
| 79. | Gilberts | 3.6% | 1.7%(+1.89)#79 | 1.9%(+1.71)#3,158 |
| 80. | Nelson | 3.6% | 1.7%(+1.87)#80 | 1.9%(+1.68)#3,201 |
| 81. | Forest Park | 3.6% | 1.7%(+1.86)#81 | 1.9%(+1.67)#3,205 |
| 82. | Milton | 3.5% | 1.7%(+1.80)#82 | 1.9%(+1.62)#3,285 |
| 83. | Kildeer | 3.5% | 1.7%(+1.77)#83 | 1.9%(+1.58)#3,318 |
| 84. | Albany | 3.5% | 1.7%(+1.77)#84 | 1.9%(+1.58)#3,321 |
| 85. | Tremont | 3.5% | 1.7%(+1.76)#85 | 1.9%(+1.58)#3,327 |
| 86. | Grafton | 3.4% | 1.7%(+1.74)#86 | 1.9%(+1.56)#3,357 |
| 87. | Glenview | 3.4% | 1.7%(+1.72)#87 | 1.9%(+1.54)#3,381 |
| 88. | Lake Bluff | 3.4% | 1.7%(+1.71)#88 | 1.9%(+1.52)#3,405 |
| 89. | Ridgewood | 3.4% | 1.7%(+1.70)#89 | 1.9%(+1.51)#3,416 |
| 90. | Riverton | 3.4% | 1.7%(+1.69)#90 | 1.9%(+1.51)#3,426 |
| 91. | Lynwood | 3.4% | 1.7%(+1.68)#91 | 1.9%(+1.50)#3,446 |
| 92. | Countryside | 3.4% | 1.7%(+1.67)#92 | 1.9%(+1.48)#3,471 |
| 93. | Burr Ridge | 3.4% | 1.7%(+1.65)#93 | 1.9%(+1.46)#3,484 |
| 94. | Third Lake | 3.4% | 1.7%(+1.65)#94 | 1.9%(+1.46)#3,486 |
| 95. | Frankfort | 3.3% | 1.7%(+1.64)#95 | 1.9%(+1.45)#3,502 |
| 96. | Illiopolis | 3.3% | 1.7%(+1.63)#96 | 1.9%(+1.44)#3,514 |
| 97. | Sycamore | 3.3% | 1.7%(+1.62)#97 | 1.9%(+1.43)#3,543 |
| 98. | Hurst | 3.3% | 1.7%(+1.62)#98 | 1.9%(+1.43)#3,545 |
| 99. | Winnebago | 3.3% | 1.7%(+1.56)#99 | 1.9%(+1.37)#3,640 |
| 100. | Orland Hills | 3.3% | 1.7%(+1.55)#100 | 1.9%(+1.36)#3,672 |
Common Questions
What are the Top 10 Cities with the Highest Percentage of Population Employed in Real Estate, Rental & Leasing in Illinois?
Top 10 Cities with the Highest Percentage of Population Employed in Real Estate, Rental & Leasing in Illinois are:
#1
43.8%
#2
21.4%
#3
17.9%
#4
13.7%
#5
12.5%
#6
11.8%
#7
10.6%
#8
10.1%
#9
9.6%
#10
9.3%
What city has the Highest Percentage of Population Employed in Real Estate, Rental & Leasing in Illinois?
Eldred has the Highest Percentage of Population Employed in Real Estate, Rental & Leasing in Illinois with 43.8%.
What is the Percentage of Population Employed in Real Estate, Rental & Leasing in the State of Illinois?
Percentage of Population Employed in Real Estate, Rental & Leasing in Illinois is 1.7%.
What is the Percentage of Population Employed in Real Estate, Rental & Leasing in the United States?
Percentage of Population Employed in Real Estate, Rental & Leasing in the United States is 1.9%.