Zip Codes with the Highest Percentage of Population Employed in Real Estate, Rental & Leasing in Los Angeles, CA
RELATED REPORTS & OPTIONS
Real Estate, Rental & Leasing
Los Angeles
Compare Zip Codes
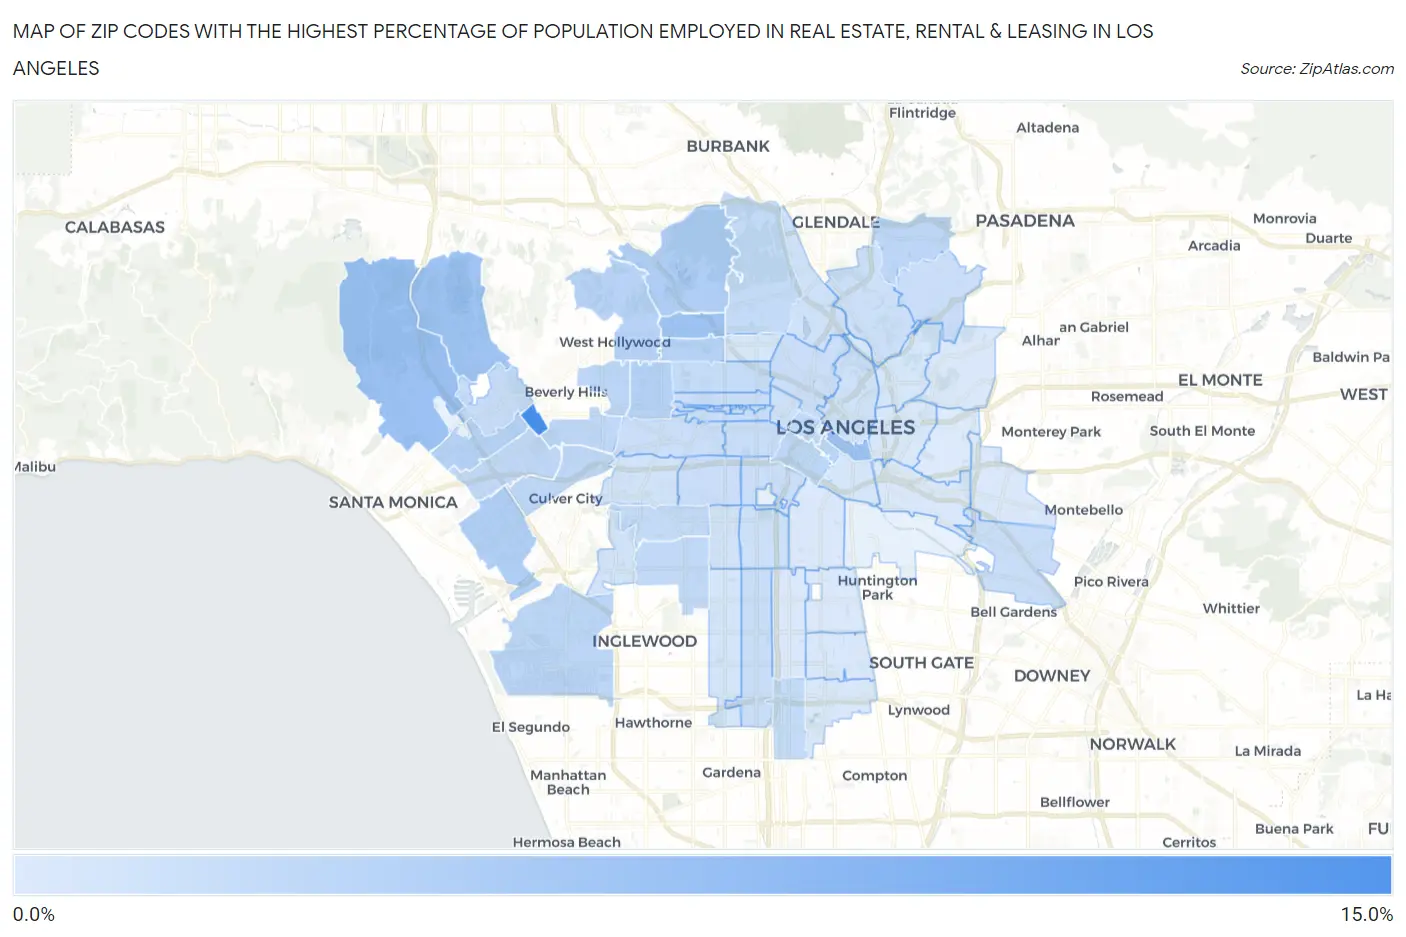
Map of Zip Codes with the Highest Percentage of Population Employed in Real Estate, Rental & Leasing in Los Angeles
0.76%
12.3%
Zip Codes with the Highest Percentage of Population Employed in Real Estate, Rental & Leasing in Los Angeles, CA
| Zip Code | % Employed | vs State | vs National | |
| 1. | 90067 | 12.3% | 2.1%(+10.2)#26 | 1.9%(+10.4)#253 |
| 2. | 90013 | 5.7% | 2.1%(+3.59)#90 | 1.9%(+3.82)#1,072 |
| 3. | 90049 | 5.5% | 2.1%(+3.40)#98 | 1.9%(+3.63)#1,138 |
| 4. | 90028 | 5.4% | 2.1%(+3.25)#103 | 1.9%(+3.48)#1,211 |
| 5. | 90077 | 5.2% | 2.1%(+3.10)#116 | 1.9%(+3.33)#1,281 |
| 6. | 90068 | 4.1% | 2.1%(+1.98)#188 | 1.9%(+2.20)#2,069 |
| 7. | 90066 | 3.9% | 2.1%(+1.81)#202 | 1.9%(+2.04)#2,253 |
| 8. | 90038 | 3.7% | 2.1%(+1.61)#220 | 1.9%(+1.83)#2,481 |
| 9. | 90036 | 3.6% | 2.1%(+1.53)#235 | 1.9%(+1.75)#2,592 |
| 10. | 90025 | 3.6% | 2.1%(+1.47)#245 | 1.9%(+1.69)#2,694 |
| 11. | 90014 | 3.5% | 2.1%(+1.40)#258 | 1.9%(+1.62)#2,814 |
| 12. | 90046 | 3.5% | 2.1%(+1.39)#259 | 1.9%(+1.62)#2,816 |
| 13. | 90041 | 3.2% | 2.1%(+1.05)#328 | 1.9%(+1.27)#3,488 |
| 14. | 90015 | 3.1% | 2.1%(+1.01)#334 | 1.9%(+1.23)#3,567 |
| 15. | 90048 | 3.1% | 2.1%(+0.998)#335 | 1.9%(+1.23)#3,589 |
| 16. | 90045 | 3.1% | 2.1%(+0.976)#339 | 1.9%(+1.20)#3,631 |
| 17. | 90035 | 3.0% | 2.1%(+0.902)#358 | 1.9%(+1.13)#3,835 |
| 18. | 90034 | 2.9% | 2.1%(+0.809)#380 | 1.9%(+1.04)#4,087 |
| 19. | 90064 | 2.8% | 2.1%(+0.645)#407 | 1.9%(+0.873)#4,536 |
| 20. | 90043 | 2.8% | 2.1%(+0.641)#408 | 1.9%(+0.869)#4,542 |
| 21. | 90017 | 2.8% | 2.1%(+0.634)#414 | 1.9%(+0.862)#4,568 |
| 22. | 90061 | 2.6% | 2.1%(+0.513)#461 | 1.9%(+0.740)#4,987 |
| 23. | 90027 | 2.6% | 2.1%(+0.480)#467 | 1.9%(+0.708)#5,104 |
| 24. | 90008 | 2.6% | 2.1%(+0.438)#485 | 1.9%(+0.665)#5,264 |
| 25. | 90004 | 2.4% | 2.1%(+0.317)#524 | 1.9%(+0.545)#5,732 |
| 26. | 90040 | 2.3% | 2.1%(+0.210)#565 | 1.9%(+0.438)#6,180 |
| 27. | 90010 | 2.3% | 2.1%(+0.189)#574 | 1.9%(+0.417)#6,274 |
| 28. | 90024 | 2.3% | 2.1%(+0.188)#575 | 1.9%(+0.416)#6,276 |
| 29. | 90006 | 2.3% | 2.1%(+0.178)#578 | 1.9%(+0.405)#6,314 |
| 30. | 90005 | 2.3% | 2.1%(+0.149)#587 | 1.9%(+0.376)#6,475 |
| 31. | 90020 | 2.3% | 2.1%(+0.135)#592 | 1.9%(+0.362)#6,546 |
| 32. | 90044 | 2.2% | 2.1%(+0.107)#598 | 1.9%(+0.335)#6,679 |
| 33. | 90026 | 2.2% | 2.1%(+0.040)#622 | 1.9%(+0.268)#7,021 |
| 34. | 90007 | 2.1% | 2.1%(-0.020)#649 | 1.9%(+0.207)#7,321 |
| 35. | 90018 | 2.1% | 2.1%(-0.021)#650 | 1.9%(+0.207)#7,322 |
| 36. | 90019 | 2.1% | 2.1%(-0.040)#662 | 1.9%(+0.187)#7,427 |
| 37. | 90042 | 2.1% | 2.1%(-0.063)#678 | 1.9%(+0.164)#7,557 |
| 38. | 90065 | 1.9% | 2.1%(-0.205)#734 | 1.9%(+0.023)#8,376 |
| 39. | 90037 | 1.9% | 2.1%(-0.239)#754 | 1.9%(-0.011)#8,594 |
| 40. | 90039 | 1.8% | 2.1%(-0.283)#778 | 1.9%(-0.056)#8,894 |
| 41. | 90012 | 1.8% | 2.1%(-0.367)#822 | 1.9%(-0.139)#9,426 |
| 42. | 90057 | 1.7% | 2.1%(-0.418)#852 | 1.9%(-0.190)#9,738 |
| 43. | 90016 | 1.7% | 2.1%(-0.445)#866 | 1.9%(-0.217)#9,940 |
| 44. | 90062 | 1.6% | 2.1%(-0.493)#892 | 1.9%(-0.266)#10,270 |
| 45. | 90056 | 1.5% | 2.1%(-0.572)#926 | 1.9%(-0.345)#10,813 |
| 46. | 90047 | 1.4% | 2.1%(-0.749)#1,004 | 1.9%(-0.521)#12,204 |
| 47. | 90029 | 1.3% | 2.1%(-0.783)#1,015 | 1.9%(-0.555)#12,443 |
| 48. | 90031 | 1.3% | 2.1%(-0.861)#1,064 | 1.9%(-0.634)#13,028 |
| 49. | 90021 | 1.3% | 2.1%(-0.864)#1,065 | 1.9%(-0.636)#13,044 |
| 50. | 90002 | 1.1% | 2.1%(-1.04)#1,133 | 1.9%(-0.816)#14,489 |
| 51. | 90033 | 1.1% | 2.1%(-1.07)#1,145 | 1.9%(-0.838)#14,688 |
| 52. | 90059 | 1.0% | 2.1%(-1.11)#1,161 | 1.9%(-0.879)#15,051 |
| 53. | 90022 | 0.99% | 2.1%(-1.13)#1,168 | 1.9%(-0.898)#15,213 |
| 54. | 90023 | 0.96% | 2.1%(-1.16)#1,185 | 1.9%(-0.935)#15,508 |
| 55. | 90011 | 0.94% | 2.1%(-1.18)#1,189 | 1.9%(-0.950)#15,627 |
| 56. | 90001 | 0.93% | 2.1%(-1.19)#1,192 | 1.9%(-0.961)#15,706 |
| 57. | 90003 | 0.86% | 2.1%(-1.25)#1,210 | 1.9%(-1.03)#16,225 |
| 58. | 90032 | 0.85% | 2.1%(-1.27)#1,217 | 1.9%(-1.05)#16,385 |
| 59. | 90063 | 0.76% | 2.1%(-1.36)#1,246 | 1.9%(-1.14)#17,038 |
1
Common Questions
What are the Top 10 Zip Codes with the Highest Percentage of Population Employed in Real Estate, Rental & Leasing in Los Angeles, CA?
Top 10 Zip Codes with the Highest Percentage of Population Employed in Real Estate, Rental & Leasing in Los Angeles, CA are:
What zip code has the Highest Percentage of Population Employed in Real Estate, Rental & Leasing in Los Angeles, CA?
90067 has the Highest Percentage of Population Employed in Real Estate, Rental & Leasing in Los Angeles, CA with 12.3%.
What is the Percentage of Population Employed in Real Estate, Rental & Leasing in Los Angeles, CA?
Percentage of Population Employed in Real Estate, Rental & Leasing in Los Angeles is 2.4%.
What is the Percentage of Population Employed in Real Estate, Rental & Leasing in California?
Percentage of Population Employed in Real Estate, Rental & Leasing in California is 2.1%.
What is the Percentage of Population Employed in Real Estate, Rental & Leasing in the United States?
Percentage of Population Employed in Real Estate, Rental & Leasing in the United States is 1.9%.