Cities with the Highest Percentage of Population Employed in Real Estate, Rental & Leasing in Missouri
RELATED REPORTS & OPTIONS
Real Estate, Rental & Leasing
Missouri
Compare Cities
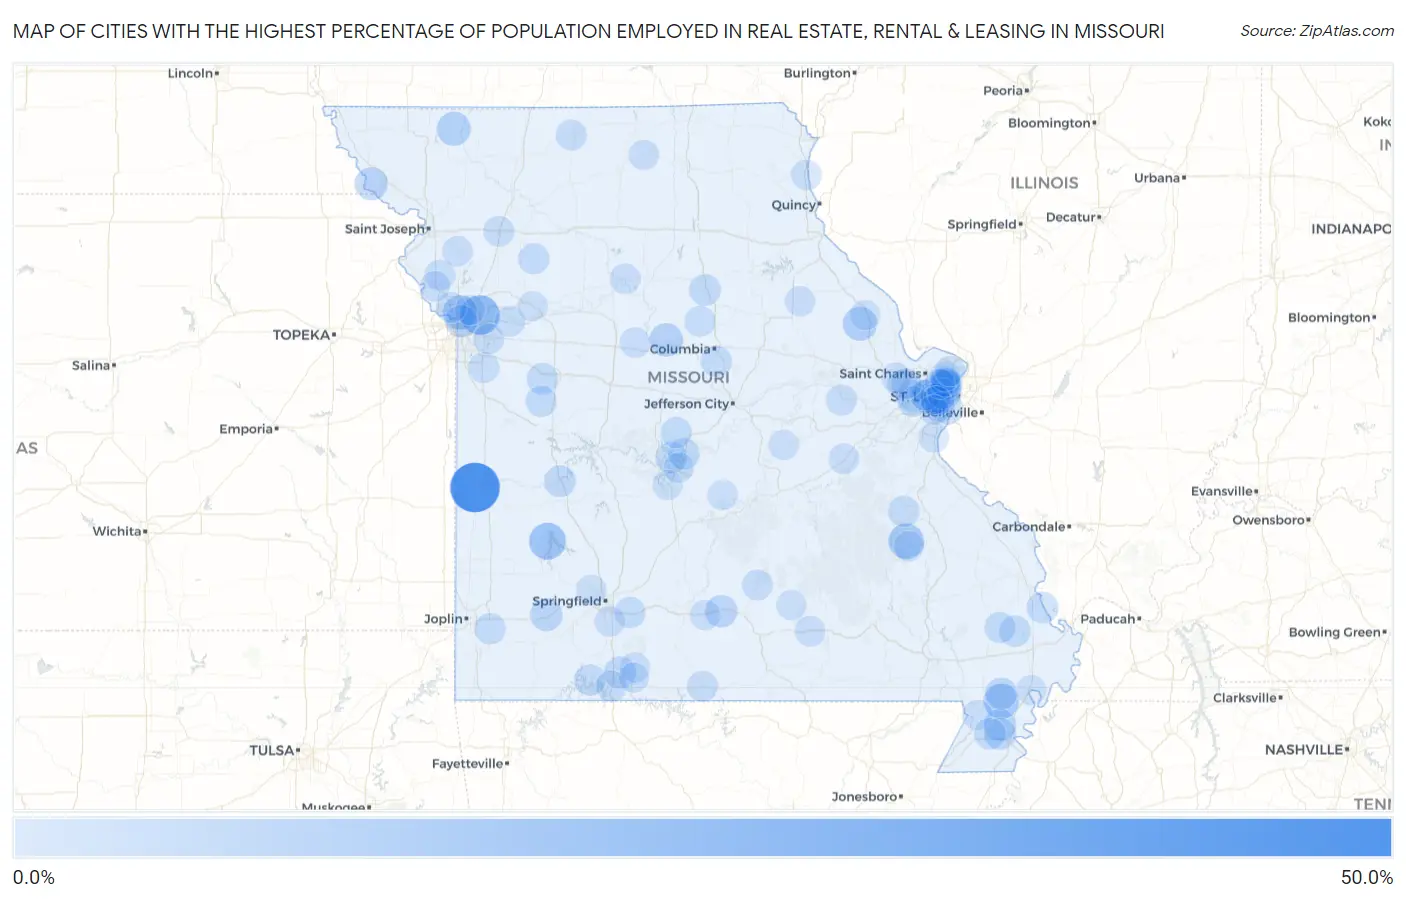
Map of Cities with the Highest Percentage of Population Employed in Real Estate, Rental & Leasing in Missouri
0.0%
50.0%
Cities with the Highest Percentage of Population Employed in Real Estate, Rental & Leasing in Missouri
| City | % Employed | vs State | vs National | |
| 1. | Metz | 50.0% | 1.6%(+48.4)#1 | 1.9%(+48.1)#24 |
| 2. | River Bend | 25.0% | 1.6%(+23.4)#2 | 1.9%(+23.1)#106 |
| 3. | Umber View Heights | 18.8% | 1.6%(+17.1)#3 | 1.9%(+16.9)#167 |
| 4. | Pilot Knob | 15.7% | 1.6%(+14.1)#4 | 1.9%(+13.8)#227 |
| 5. | Tallapoosa | 15.0% | 1.6%(+13.4)#5 | 1.9%(+13.1)#248 |
| 6. | Oakwood | 13.3% | 1.6%(+11.7)#6 | 1.9%(+11.4)#298 |
| 7. | Silex | 12.3% | 1.6%(+10.7)#7 | 1.9%(+10.5)#355 |
| 8. | Parnell | 12.0% | 1.6%(+10.4)#8 | 1.9%(+10.2)#374 |
| 9. | Pagedale | 11.3% | 1.6%(+9.65)#9 | 1.9%(+9.39)#426 |
| 10. | Franklin | 10.9% | 1.6%(+9.24)#10 | 1.9%(+8.98)#456 |
| 11. | Country Life Acres | 10.9% | 1.6%(+9.24)#11 | 1.9%(+8.98)#457 |
| 12. | Huntleigh | 9.7% | 1.6%(+8.06)#12 | 1.9%(+7.80)#570 |
| 13. | Big Lake | 9.5% | 1.6%(+7.89)#13 | 1.9%(+7.63)#590 |
| 14. | Mount Vernon | 8.5% | 1.6%(+6.86)#14 | 1.9%(+6.60)#724 |
| 15. | Mountain Grove | 8.4% | 1.6%(+6.77)#15 | 1.9%(+6.50)#743 |
| 16. | North Kansas City | 8.3% | 1.6%(+6.63)#16 | 1.9%(+6.37)#764 |
| 17. | Homestown | 7.8% | 1.6%(+6.21)#17 | 1.9%(+5.95)#854 |
| 18. | Rockaway Beach | 7.6% | 1.6%(+5.96)#18 | 1.9%(+5.70)#901 |
| 19. | Westwood | 7.6% | 1.6%(+5.96)#19 | 1.9%(+5.69)#904 |
| 20. | Risco | 7.5% | 1.6%(+5.90)#20 | 1.9%(+5.64)#927 |
| 21. | Bel Nor | 7.2% | 1.6%(+5.56)#21 | 1.9%(+5.30)#993 |
| 22. | Pascola | 7.1% | 1.6%(+5.51)#22 | 1.9%(+5.25)#1,010 |
| 23. | Normandy | 7.1% | 1.6%(+5.47)#23 | 1.9%(+5.21)#1,022 |
| 24. | Bella Villa | 7.0% | 1.6%(+5.40)#24 | 1.9%(+5.14)#1,033 |
| 25. | Osceola | 6.9% | 1.6%(+5.31)#25 | 1.9%(+5.05)#1,058 |
| 26. | Summer Set | 6.9% | 1.6%(+5.25)#26 | 1.9%(+4.99)#1,076 |
| 27. | Commerce | 6.7% | 1.6%(+5.04)#27 | 1.9%(+4.77)#1,126 |
| 28. | Renick | 6.7% | 1.6%(+5.04)#28 | 1.9%(+4.77)#1,128 |
| 29. | Bragg City | 6.7% | 1.6%(+5.04)#29 | 1.9%(+4.77)#1,129 |
| 30. | Village Of Four Seasons | 6.5% | 1.6%(+4.86)#30 | 1.9%(+4.60)#1,192 |
| 31. | Clarkson Valley | 6.5% | 1.6%(+4.82)#31 | 1.9%(+4.56)#1,203 |
| 32. | Vanduser | 6.2% | 1.6%(+4.62)#32 | 1.9%(+4.36)#1,275 |
| 33. | Bagnell | 6.2% | 1.6%(+4.62)#33 | 1.9%(+4.36)#1,278 |
| 34. | Centerview | 6.1% | 1.6%(+4.51)#34 | 1.9%(+4.25)#1,319 |
| 35. | Kimberling City | 6.0% | 1.6%(+4.33)#35 | 1.9%(+4.07)#1,394 |
| 36. | Diamond | 5.9% | 1.6%(+4.31)#36 | 1.9%(+4.05)#1,402 |
| 37. | Brentwood | 5.9% | 1.6%(+4.25)#37 | 1.9%(+3.99)#1,427 |
| 38. | Barnett | 5.8% | 1.6%(+4.14)#38 | 1.9%(+3.88)#1,471 |
| 39. | Chilhowee | 5.7% | 1.6%(+4.05)#39 | 1.9%(+3.79)#1,507 |
| 40. | Bell City | 5.6% | 1.6%(+3.99)#40 | 1.9%(+3.73)#1,537 |
| 41. | Irondale | 5.6% | 1.6%(+3.96)#41 | 1.9%(+3.69)#1,550 |
| 42. | Pierpont | 5.6% | 1.6%(+3.92)#42 | 1.9%(+3.66)#1,568 |
| 43. | Rogersville | 5.6% | 1.6%(+3.92)#43 | 1.9%(+3.66)#1,569 |
| 44. | Cowgill | 5.4% | 1.6%(+3.77)#44 | 1.9%(+3.51)#1,636 |
| 45. | Rock Hill | 5.3% | 1.6%(+3.66)#45 | 1.9%(+3.40)#1,694 |
| 46. | Bellerive Acres | 5.3% | 1.6%(+3.66)#46 | 1.9%(+3.40)#1,696 |
| 47. | Lake Winnebago | 5.3% | 1.6%(+3.64)#47 | 1.9%(+3.38)#1,704 |
| 48. | New Hamburg | 5.2% | 1.6%(+3.60)#48 | 1.9%(+3.34)#1,728 |
| 49. | Hollister | 5.2% | 1.6%(+3.57)#49 | 1.9%(+3.31)#1,742 |
| 50. | New Haven | 5.1% | 1.6%(+3.52)#50 | 1.9%(+3.26)#1,781 |
| 51. | Weldon Spring Heights | 5.1% | 1.6%(+3.45)#51 | 1.9%(+3.19)#1,820 |
| 52. | Princeton | 5.0% | 1.6%(+3.38)#52 | 1.9%(+3.12)#1,851 |
| 53. | Harrisburg | 4.9% | 1.6%(+3.31)#53 | 1.9%(+3.05)#1,893 |
| 54. | Camden Point | 4.9% | 1.6%(+3.23)#54 | 1.9%(+2.97)#1,954 |
| 55. | Gainesville | 4.7% | 1.6%(+3.11)#55 | 1.9%(+2.85)#2,035 |
| 56. | Levasy | 4.7% | 1.6%(+3.02)#56 | 1.9%(+2.76)#2,102 |
| 57. | Houston | 4.6% | 1.6%(+3.00)#57 | 1.9%(+2.74)#2,115 |
| 58. | Ellisville | 4.6% | 1.6%(+2.99)#58 | 1.9%(+2.73)#2,122 |
| 59. | Cameron | 4.6% | 1.6%(+2.96)#59 | 1.9%(+2.70)#2,138 |
| 60. | Lake Tapawingo | 4.5% | 1.6%(+2.89)#60 | 1.9%(+2.63)#2,190 |
| 61. | Glen Echo Park | 4.4% | 1.6%(+2.81)#61 | 1.9%(+2.55)#2,255 |
| 62. | Fremont Hills | 4.4% | 1.6%(+2.80)#62 | 1.9%(+2.54)#2,266 |
| 63. | Town And Country | 4.3% | 1.6%(+2.64)#63 | 1.9%(+2.38)#2,383 |
| 64. | Platte Woods | 4.2% | 1.6%(+2.58)#64 | 1.9%(+2.32)#2,432 |
| 65. | Nelson | 4.2% | 1.6%(+2.54)#65 | 1.9%(+2.27)#2,480 |
| 66. | Green City | 4.1% | 1.6%(+2.50)#66 | 1.9%(+2.24)#2,516 |
| 67. | West Sullivan | 4.1% | 1.6%(+2.49)#67 | 1.9%(+2.23)#2,523 |
| 68. | Birch Tree | 4.1% | 1.6%(+2.47)#68 | 1.9%(+2.21)#2,551 |
| 69. | Brunswick | 4.1% | 1.6%(+2.45)#69 | 1.9%(+2.19)#2,574 |
| 70. | Norwood | 4.0% | 1.6%(+2.41)#70 | 1.9%(+2.15)#2,621 |
| 71. | Gower | 4.0% | 1.6%(+2.37)#71 | 1.9%(+2.11)#2,653 |
| 72. | Warson Woods | 4.0% | 1.6%(+2.35)#72 | 1.9%(+2.09)#2,680 |
| 73. | Clayton | 4.0% | 1.6%(+2.33)#73 | 1.9%(+2.07)#2,701 |
| 74. | Taneyville | 3.9% | 1.6%(+2.32)#74 | 1.9%(+2.06)#2,720 |
| 75. | Grantwood Village | 3.9% | 1.6%(+2.27)#75 | 1.9%(+2.01)#2,762 |
| 76. | Willard | 3.9% | 1.6%(+2.25)#76 | 1.9%(+1.99)#2,786 |
| 77. | Tracy | 3.9% | 1.6%(+2.25)#77 | 1.9%(+1.99)#2,790 |
| 78. | Weldon Spring | 3.9% | 1.6%(+2.25)#78 | 1.9%(+1.99)#2,798 |
| 79. | Arcadia | 3.8% | 1.6%(+2.17)#79 | 1.9%(+1.91)#2,886 |
| 80. | Canton | 3.8% | 1.6%(+2.15)#80 | 1.9%(+1.89)#2,909 |
| 81. | Farber | 3.8% | 1.6%(+2.13)#81 | 1.9%(+1.87)#2,930 |
| 82. | Cool Valley | 3.7% | 1.6%(+2.08)#82 | 1.9%(+1.82)#2,994 |
| 83. | Whiteside | 3.7% | 1.6%(+2.07)#83 | 1.9%(+1.81)#3,019 |
| 84. | Barnhart | 3.7% | 1.6%(+2.07)#84 | 1.9%(+1.81)#3,024 |
| 85. | Crocker | 3.7% | 1.6%(+2.04)#85 | 1.9%(+1.78)#3,052 |
| 86. | Holcomb | 3.7% | 1.6%(+2.02)#86 | 1.9%(+1.76)#3,075 |
| 87. | Osage Beach | 3.6% | 1.6%(+1.98)#87 | 1.9%(+1.72)#3,135 |
| 88. | Henrietta | 3.5% | 1.6%(+1.91)#88 | 1.9%(+1.65)#3,239 |
| 89. | Kissee Mills | 3.5% | 1.6%(+1.90)#89 | 1.9%(+1.64)#3,245 |
| 90. | Calverton Park | 3.5% | 1.6%(+1.88)#90 | 1.9%(+1.62)#3,280 |
| 91. | Sunset Hills | 3.5% | 1.6%(+1.85)#91 | 1.9%(+1.59)#3,312 |
| 92. | Dardenne Prairie | 3.5% | 1.6%(+1.84)#92 | 1.9%(+1.58)#3,324 |
| 93. | St John | 3.4% | 1.6%(+1.80)#93 | 1.9%(+1.54)#3,374 |
| 94. | Belle | 3.4% | 1.6%(+1.78)#94 | 1.9%(+1.52)#3,411 |
| 95. | Camdenton | 3.4% | 1.6%(+1.76)#95 | 1.9%(+1.50)#3,436 |
| 96. | Summersville | 3.4% | 1.6%(+1.76)#96 | 1.9%(+1.50)#3,438 |
| 97. | Black Jack | 3.4% | 1.6%(+1.76)#97 | 1.9%(+1.49)#3,448 |
| 98. | Glendale | 3.4% | 1.6%(+1.75)#98 | 1.9%(+1.49)#3,457 |
| 99. | Pleasant Valley | 3.4% | 1.6%(+1.74)#99 | 1.9%(+1.48)#3,464 |
| 100. | New Madrid | 3.3% | 1.6%(+1.71)#100 | 1.9%(+1.45)#3,505 |
Common Questions
What are the Top 10 Cities with the Highest Percentage of Population Employed in Real Estate, Rental & Leasing in Missouri?
Top 10 Cities with the Highest Percentage of Population Employed in Real Estate, Rental & Leasing in Missouri are:
#1
50.0%
#2
25.0%
#3
18.8%
#4
15.7%
#5
15.0%
#6
13.3%
#7
12.3%
#8
12.0%
#9
11.3%
#10
10.9%
What city has the Highest Percentage of Population Employed in Real Estate, Rental & Leasing in Missouri?
Metz has the Highest Percentage of Population Employed in Real Estate, Rental & Leasing in Missouri with 50.0%.
What is the Percentage of Population Employed in Real Estate, Rental & Leasing in the State of Missouri?
Percentage of Population Employed in Real Estate, Rental & Leasing in Missouri is 1.6%.
What is the Percentage of Population Employed in Real Estate, Rental & Leasing in the United States?
Percentage of Population Employed in Real Estate, Rental & Leasing in the United States is 1.9%.