Myrtletown, CA Map & Demographics
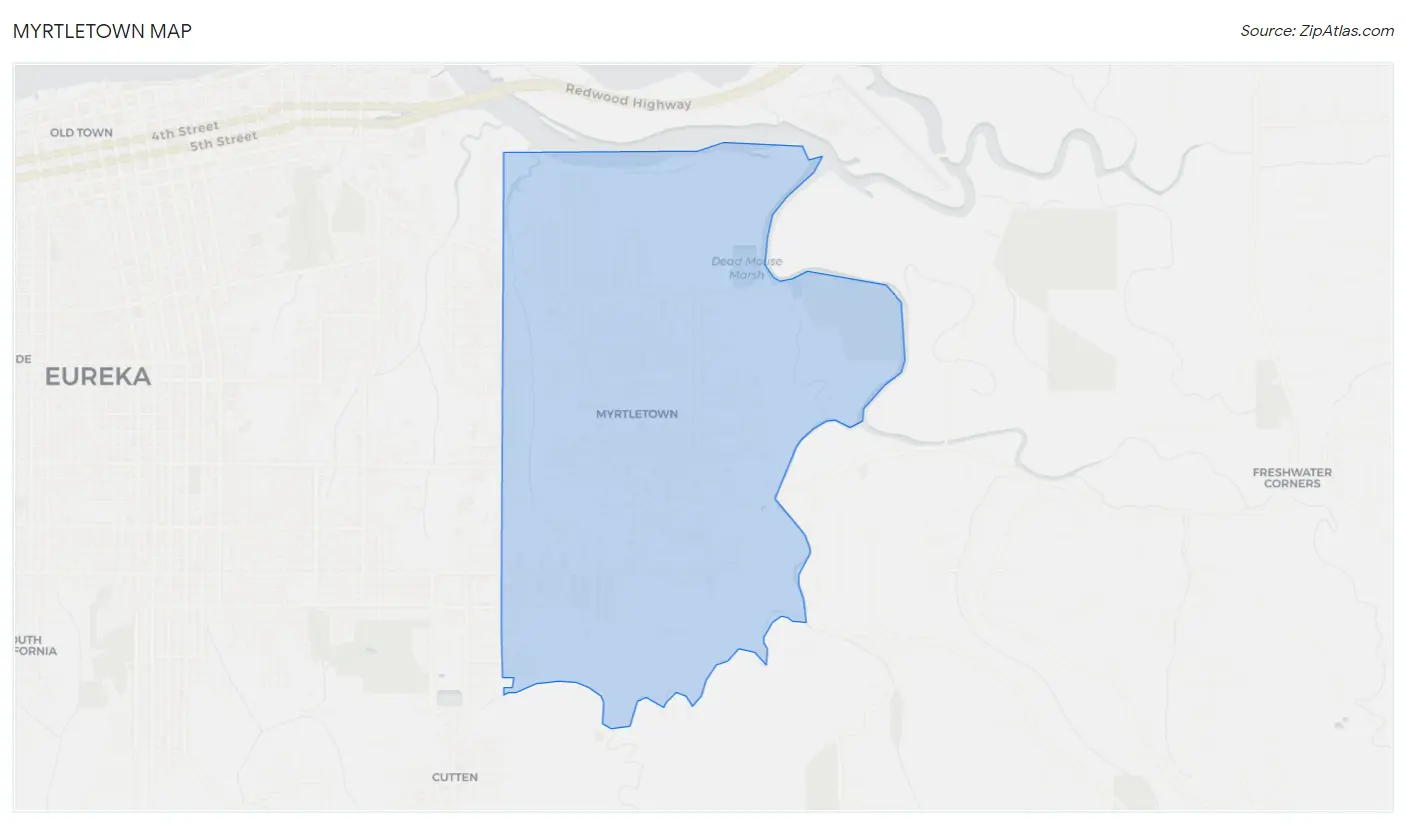
Myrtletown Map
Myrtletown Overview
$40,555
PER CAPITA INCOME
$106,313
AVG FAMILY INCOME
$60,032
AVG HOUSEHOLD INCOME
16.4%
WAGE / INCOME GAP [ % ]
83.6¢/ $1
WAGE / INCOME GAP [ $ ]
0.54
INEQUALITY / GINI INDEX
4,946
TOTAL POPULATION
2,477
MALE POPULATION
2,469
FEMALE POPULATION
100.32
MALES / 100 FEMALES
99.68
FEMALES / 100 MALES
48.1
MEDIAN AGE
2.9
AVG FAMILY SIZE
2.2
AVG HOUSEHOLD SIZE
2,058
LABOR FORCE [ PEOPLE ]
49.8%
PERCENT IN LABOR FORCE
7.5%
UNEMPLOYMENT RATE
Income in Myrtletown
Income Overview in Myrtletown
Per Capita Income in Myrtletown is $40,555, while median incomes of families and households are $106,313 and $60,032 respectively.
| Characteristic | Number | Measure |
| Per Capita Income | 4,946 | $40,555 |
| Median Family Income | 1,061 | $106,313 |
| Mean Family Income | 1,061 | $130,772 |
| Median Household Income | 2,142 | $60,032 |
| Mean Household Income | 2,142 | $89,311 |
| Income Deficit | 1,061 | $0 |
| Wage / Income Gap (%) | 4,946 | 16.37% |
| Wage / Income Gap ($) | 4,946 | 83.63¢ per $1 |
| Gini / Inequality Index | 4,946 | 0.54 |
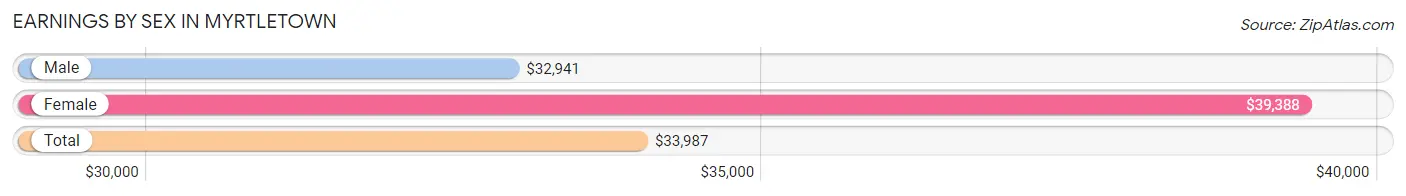
Earnings by Sex in Myrtletown
Average Earnings in Myrtletown are $33,987, $32,941 for men and $39,388 for women, a difference of 16.4%.
| Sex | Number | Average Earnings |
| Male | 1,190 (56.4%) | $32,941 |
| Female | 920 (43.6%) | $39,388 |
| Total | 2,110 (100.0%) | $33,987 |
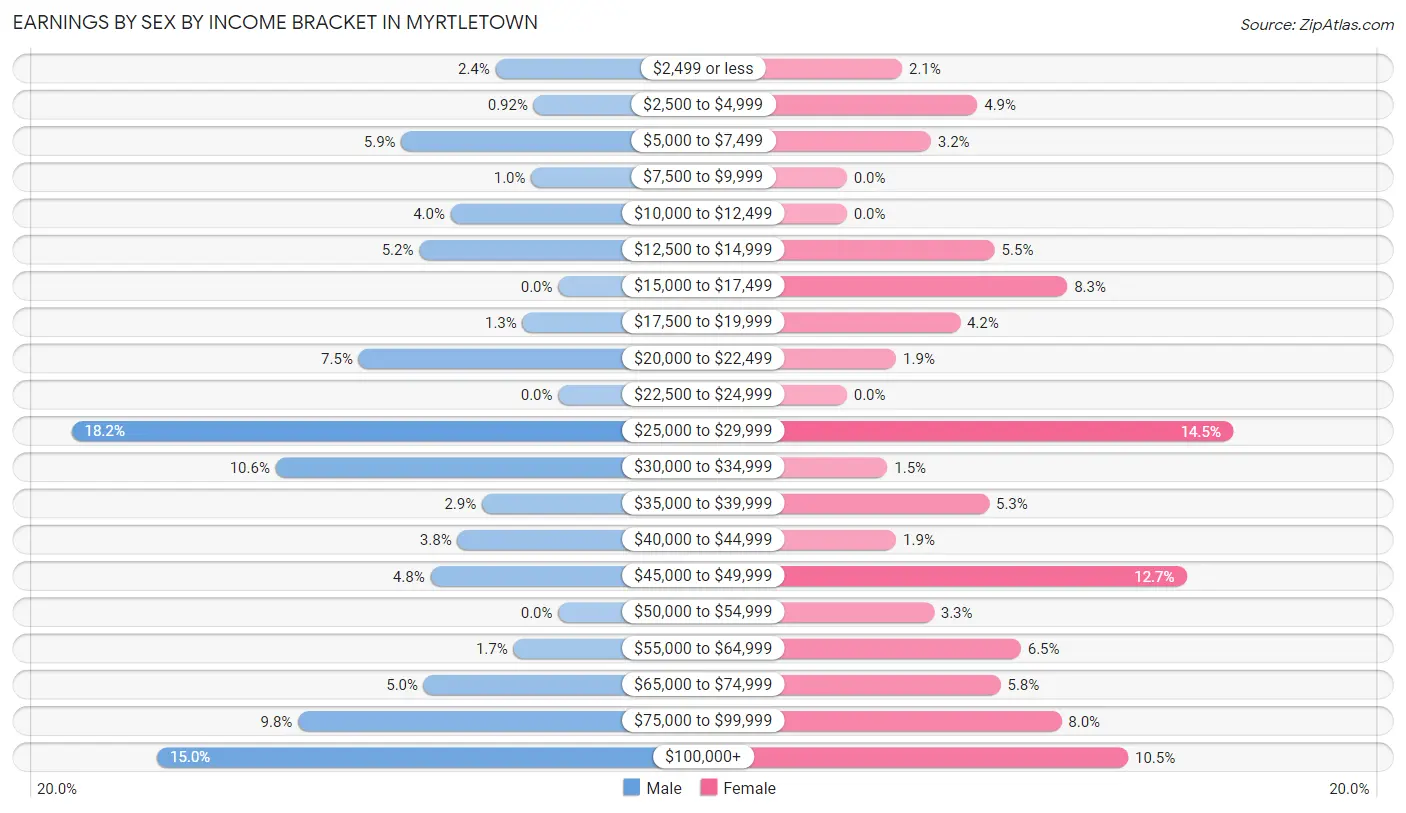
Earnings by Sex by Income Bracket in Myrtletown
The most common earnings brackets in Myrtletown are $25,000 to $29,999 for men (217 | 18.2%) and $25,000 to $29,999 for women (133 | 14.5%).
| Income | Male | Female |
| $2,499 or less | 28 (2.4%) | 19 (2.1%) |
| $2,500 to $4,999 | 11 (0.9%) | 45 (4.9%) |
| $5,000 to $7,499 | 70 (5.9%) | 29 (3.2%) |
| $7,500 to $9,999 | 12 (1.0%) | 0 (0.0%) |
| $10,000 to $12,499 | 48 (4.0%) | 0 (0.0%) |
| $12,500 to $14,999 | 62 (5.2%) | 51 (5.5%) |
| $15,000 to $17,499 | 0 (0.0%) | 76 (8.3%) |
| $17,500 to $19,999 | 16 (1.3%) | 39 (4.2%) |
| $20,000 to $22,499 | 89 (7.5%) | 17 (1.8%) |
| $22,500 to $24,999 | 0 (0.0%) | 0 (0.0%) |
| $25,000 to $29,999 | 217 (18.2%) | 133 (14.5%) |
| $30,000 to $34,999 | 126 (10.6%) | 14 (1.5%) |
| $35,000 to $39,999 | 34 (2.9%) | 49 (5.3%) |
| $40,000 to $44,999 | 45 (3.8%) | 17 (1.8%) |
| $45,000 to $49,999 | 57 (4.8%) | 117 (12.7%) |
| $50,000 to $54,999 | 0 (0.0%) | 30 (3.3%) |
| $55,000 to $64,999 | 20 (1.7%) | 60 (6.5%) |
| $65,000 to $74,999 | 60 (5.0%) | 53 (5.8%) |
| $75,000 to $99,999 | 116 (9.8%) | 74 (8.0%) |
| $100,000+ | 179 (15.0%) | 97 (10.5%) |
| Total | 1,190 (100.0%) | 920 (100.0%) |
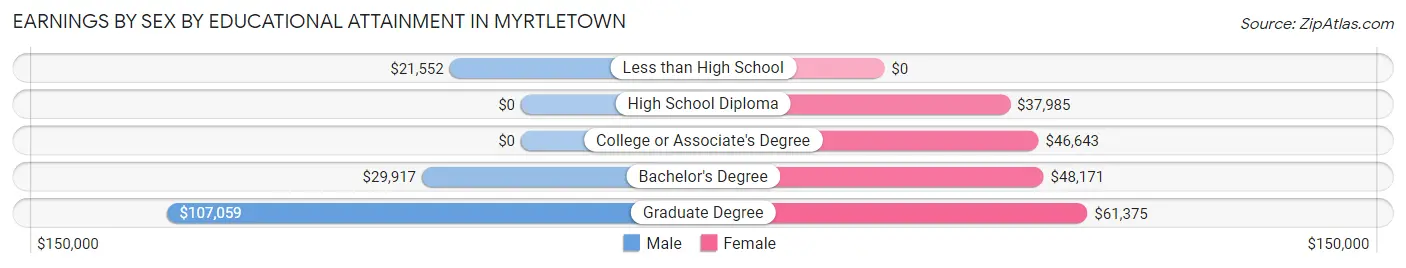
Earnings by Sex by Educational Attainment in Myrtletown
Average earnings in Myrtletown are $33,836 for men and $45,714 for women, a difference of 26.0%. Men with an educational attainment of graduate degree enjoy the highest average annual earnings of $107,059, while those with less than high school education earn the least with $21,552. Women with an educational attainment of graduate degree earn the most with the average annual earnings of $61,375, while those with high school diploma education have the smallest earnings of $37,985.
| Educational Attainment | Male Income | Female Income |
| Less than High School | $21,552 | $0 |
| High School Diploma | - | - |
| College or Associate's Degree | - | - |
| Bachelor's Degree | $29,917 | $48,171 |
| Graduate Degree | $107,059 | $61,375 |
| Total | $33,836 | $45,714 |
Family Income in Myrtletown
Family Income Brackets in Myrtletown
According to the Myrtletown family income data, there are 255 families falling into the $150,000 to $199,999 income range, which is the most common income bracket and makes up 24.0% of all families. Conversely, the less than $10,000 income bracket is the least frequent group with only 30 families (2.8%) belonging to this category.
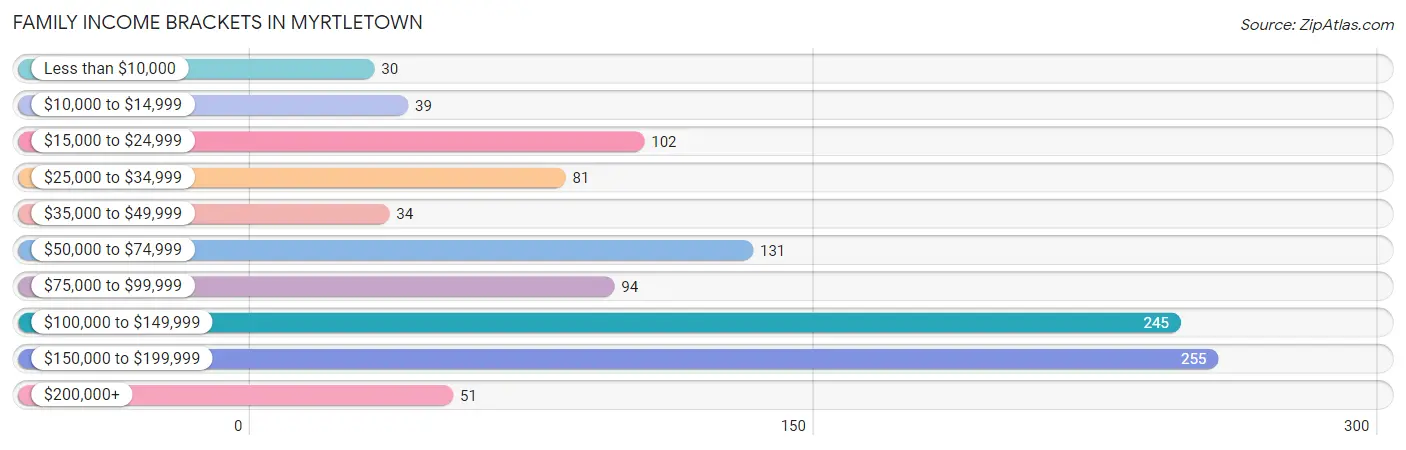
| Income Bracket | # Families | % Families |
| Less than $10,000 | 30 | 2.8% |
| $10,000 to $14,999 | 39 | 3.7% |
| $15,000 to $24,999 | 102 | 9.6% |
| $25,000 to $34,999 | 81 | 7.6% |
| $35,000 to $49,999 | 34 | 3.2% |
| $50,000 to $74,999 | 131 | 12.3% |
| $75,000 to $99,999 | 94 | 8.9% |
| $100,000 to $149,999 | 245 | 23.1% |
| $150,000 to $199,999 | 255 | 24.0% |
| $200,000+ | 51 | 4.8% |
Family Income by Famaliy Size in Myrtletown
2-person families (618 | 58.3%) account for the highest median family income in Myrtletown with $120,407 per family, while 2-person families (618 | 58.3%) have the highest median income of $60,204 per family member.
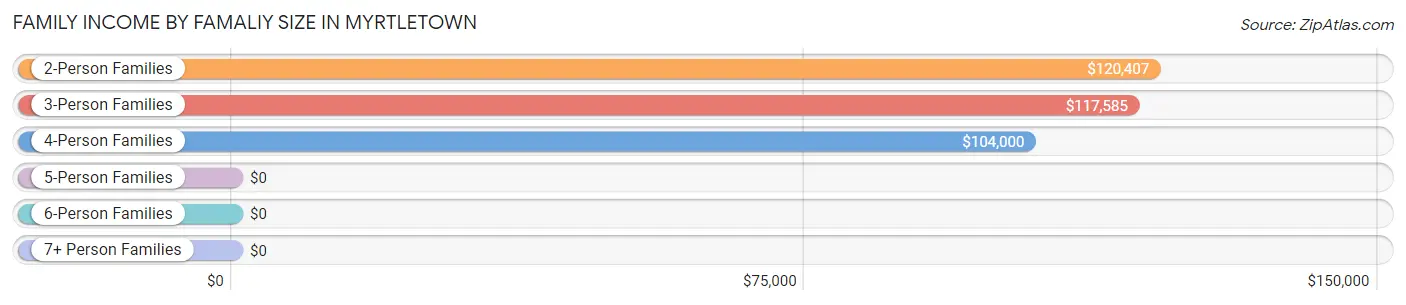
| Income Bracket | # Families | Median Income |
| 2-Person Families | 618 (58.3%) | $120,407 |
| 3-Person Families | 185 (17.4%) | $117,585 |
| 4-Person Families | 162 (15.3%) | $104,000 |
| 5-Person Families | 75 (7.1%) | $0 |
| 6-Person Families | 21 (2.0%) | $0 |
| 7+ Person Families | 0 (0.0%) | $0 |
| Total | 1,061 (100.0%) | $106,313 |
Family Income by Number of Earners in Myrtletown
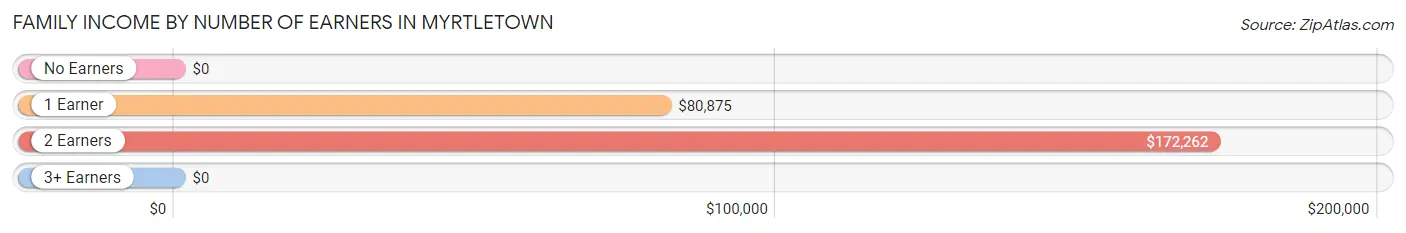
| Number of Earners | # Families | Median Income |
| No Earners | 216 (20.4%) | $0 |
| 1 Earner | 449 (42.3%) | $80,875 |
| 2 Earners | 384 (36.2%) | $172,262 |
| 3+ Earners | 12 (1.1%) | $0 |
| Total | 1,061 (100.0%) | $106,313 |
Household Income in Myrtletown
Household Income Brackets in Myrtletown
With 441 households falling in the category, the $50,000 to $74,999 income range is the most frequent in Myrtletown, accounting for 20.6% of all households. In contrast, only 90 households (4.2%) fall into the $200,000+ income bracket, making it the least populous group.
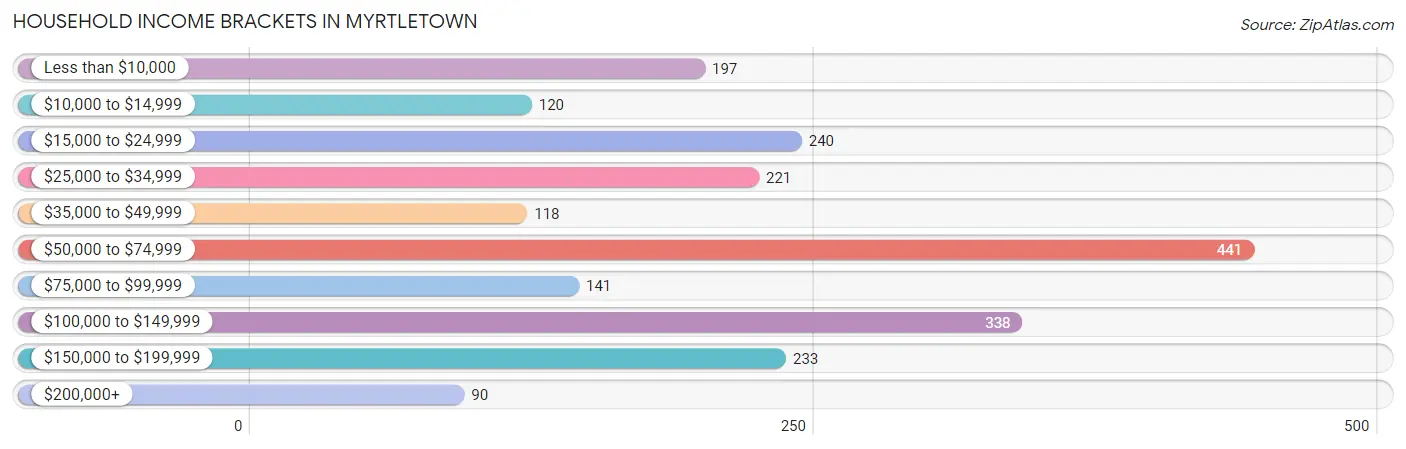
| Income Bracket | # Households | % Households |
| Less than $10,000 | 197 | 9.2% |
| $10,000 to $14,999 | 120 | 5.6% |
| $15,000 to $24,999 | 240 | 11.2% |
| $25,000 to $34,999 | 221 | 10.3% |
| $35,000 to $49,999 | 118 | 5.5% |
| $50,000 to $74,999 | 441 | 20.6% |
| $75,000 to $99,999 | 141 | 6.6% |
| $100,000 to $149,999 | 338 | 15.8% |
| $150,000 to $199,999 | 233 | 10.9% |
| $200,000+ | 90 | 4.2% |
Household Income by Householder Age in Myrtletown
The median household income in Myrtletown is $60,032, with the highest median household income of $69,821 found in the 65+ years age bracket for the primary householder. A total of 908 households (42.4%) fall into this category. Meanwhile, the 15 to 24 years age bracket for the primary householder has the lowest median household income of $0, with 30 households (1.4%) in this group.
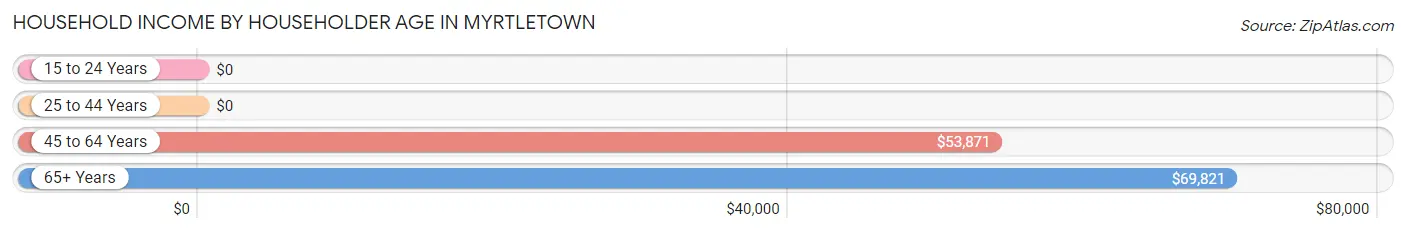
| Income Bracket | # Households | Median Income |
| 15 to 24 Years | 30 (1.4%) | $0 |
| 25 to 44 Years | 498 (23.3%) | $0 |
| 45 to 64 Years | 706 (33.0%) | $53,871 |
| 65+ Years | 908 (42.4%) | $69,821 |
| Total | 2,142 (100.0%) | $60,032 |
Poverty in Myrtletown
Income Below Poverty by Sex and Age in Myrtletown
With 13.6% poverty level for males and 24.1% for females among the residents of Myrtletown, 15 year old males and 5 year old females are the most vulnerable to poverty, with 18 males (58.1%) and 16 females (100.0%) in their respective age groups living below the poverty level.
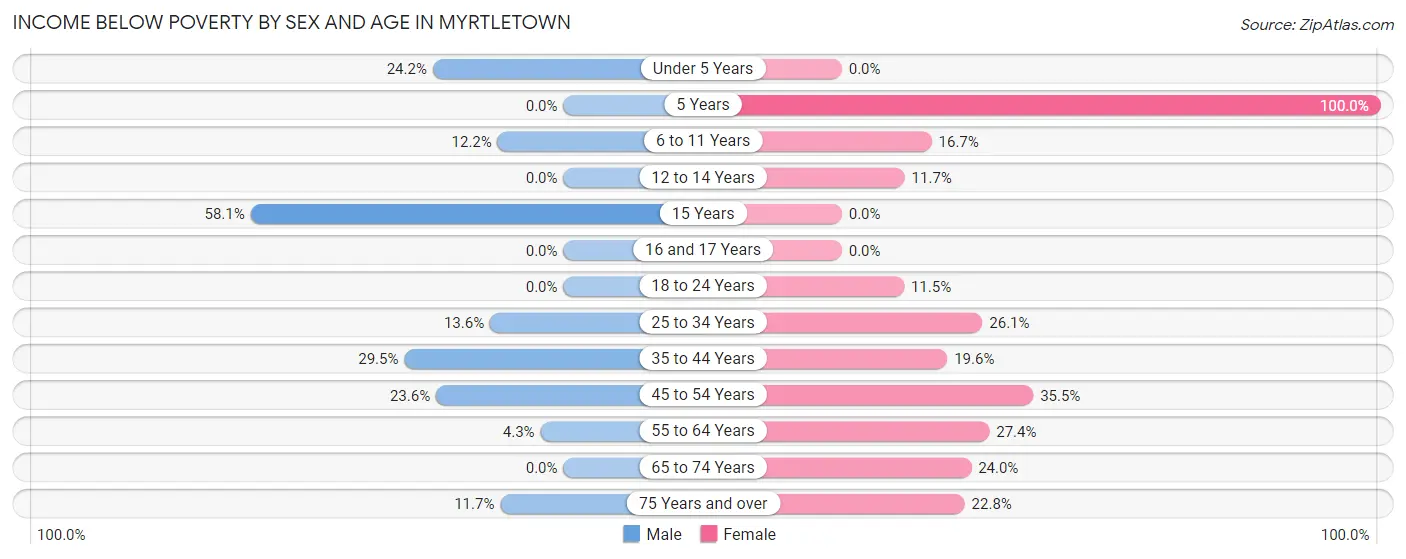
| Age Bracket | Male | Female |
| Under 5 Years | 32 (24.2%) | 0 (0.0%) |
| 5 Years | 0 (0.0%) | 16 (100.0%) |
| 6 to 11 Years | 15 (12.2%) | 15 (16.7%) |
| 12 to 14 Years | 0 (0.0%) | 7 (11.7%) |
| 15 Years | 18 (58.1%) | 0 (0.0%) |
| 16 and 17 Years | 0 (0.0%) | 0 (0.0%) |
| 18 to 24 Years | 0 (0.0%) | 9 (11.5%) |
| 25 to 34 Years | 29 (13.6%) | 90 (26.1%) |
| 35 to 44 Years | 111 (29.5%) | 46 (19.6%) |
| 45 to 54 Years | 87 (23.6%) | 124 (35.5%) |
| 55 to 64 Years | 11 (4.3%) | 135 (27.4%) |
| 65 to 74 Years | 0 (0.0%) | 49 (24.0%) |
| 75 Years and over | 24 (11.7%) | 70 (22.8%) |
| Total | 327 (13.6%) | 561 (24.1%) |
Income Above Poverty by Sex and Age in Myrtletown
According to the poverty statistics in Myrtletown, males aged 5 years and females aged under 5 years are the age groups that are most secure financially, with 100.0% of males and 100.0% of females in these age groups living above the poverty line.
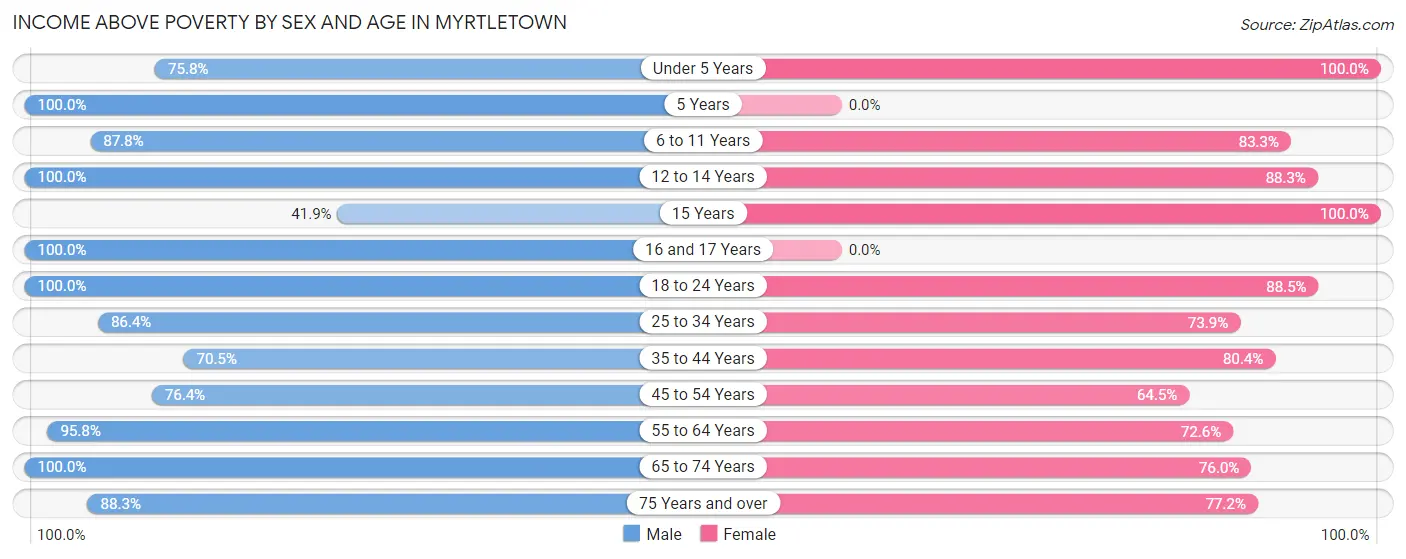
| Age Bracket | Male | Female |
| Under 5 Years | 100 (75.8%) | 136 (100.0%) |
| 5 Years | 27 (100.0%) | 0 (0.0%) |
| 6 to 11 Years | 108 (87.8%) | 75 (83.3%) |
| 12 to 14 Years | 57 (100.0%) | 53 (88.3%) |
| 15 Years | 13 (41.9%) | 17 (100.0%) |
| 16 and 17 Years | 104 (100.0%) | 0 (0.0%) |
| 18 to 24 Years | 57 (100.0%) | 69 (88.5%) |
| 25 to 34 Years | 184 (86.4%) | 255 (73.9%) |
| 35 to 44 Years | 265 (70.5%) | 189 (80.4%) |
| 45 to 54 Years | 281 (76.4%) | 225 (64.5%) |
| 55 to 64 Years | 248 (95.8%) | 358 (72.6%) |
| 65 to 74 Years | 445 (100.0%) | 155 (76.0%) |
| 75 Years and over | 181 (88.3%) | 237 (77.2%) |
| Total | 2,070 (86.4%) | 1,769 (75.9%) |
Income Below Poverty Among Married-Couple Families in Myrtletown
The poverty statistics for married-couple families in Myrtletown show that 11.0% or 89 of the total 810 families live below the poverty line. Families with no children have the highest poverty rate of 13.7%, comprising of 77 families. On the other hand, families with 3 or 4 children have the lowest poverty rate of 0.0%, which includes 0 families.
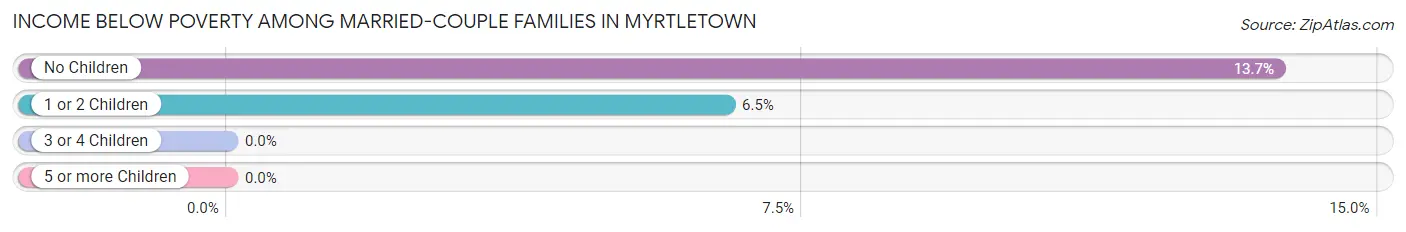
| Children | Above Poverty | Below Poverty |
| No Children | 486 (86.3%) | 77 (13.7%) |
| 1 or 2 Children | 173 (93.5%) | 12 (6.5%) |
| 3 or 4 Children | 62 (100.0%) | 0 (0.0%) |
| 5 or more Children | 0 (0.0%) | 0 (0.0%) |
| Total | 721 (89.0%) | 89 (11.0%) |
Income Below Poverty Among Single-Parent Households in Myrtletown
According to the poverty data in Myrtletown, 13.8% or 13 single-father households and 33.8% or 53 single-mother households are living below the poverty line. Among single-father households, those with no children have the highest poverty rate, with 13 households (22.8%) experiencing poverty. Likewise, among single-mother households, those with 3 or 4 children have the highest poverty rate, with 7 households (100.0%) falling below the poverty line.
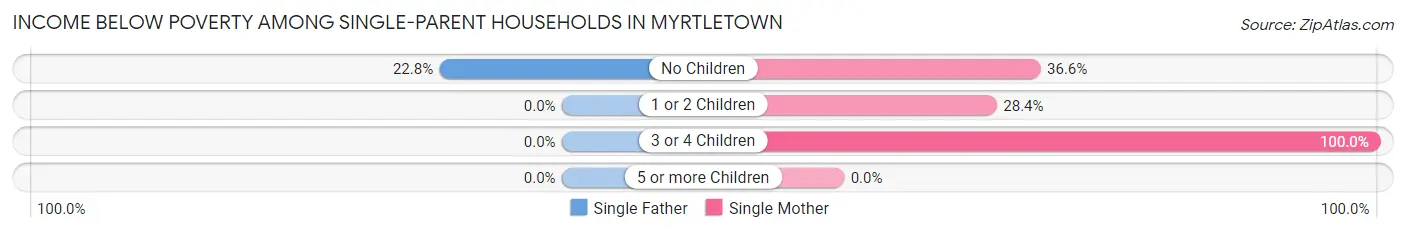
| Children | Single Father | Single Mother |
| No Children | 13 (22.8%) | 15 (36.6%) |
| 1 or 2 Children | 0 (0.0%) | 31 (28.4%) |
| 3 or 4 Children | 0 (0.0%) | 7 (100.0%) |
| 5 or more Children | 0 (0.0%) | 0 (0.0%) |
| Total | 13 (13.8%) | 53 (33.8%) |
Income Below Poverty Among Married-Couple vs Single-Parent Households in Myrtletown
The poverty data for Myrtletown shows that 89 of the married-couple family households (11.0%) and 66 of the single-parent households (26.3%) are living below the poverty level. Within the married-couple family households, those with no children have the highest poverty rate, with 77 households (13.7%) falling below the poverty line. Among the single-parent households, those with no children have the highest poverty rate, with 28 household (28.6%) living below poverty.
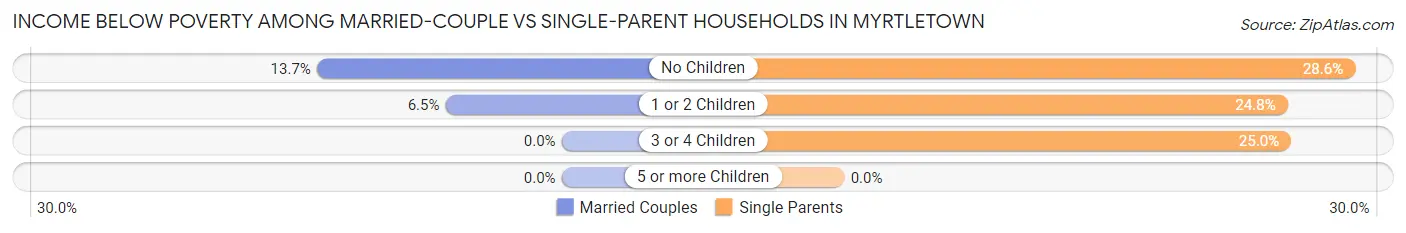
| Children | Married-Couple Families | Single-Parent Households |
| No Children | 77 (13.7%) | 28 (28.6%) |
| 1 or 2 Children | 12 (6.5%) | 31 (24.8%) |
| 3 or 4 Children | 0 (0.0%) | 7 (25.0%) |
| 5 or more Children | 0 (0.0%) | 0 (0.0%) |
| Total | 89 (11.0%) | 66 (26.3%) |
Race in Myrtletown
The most populous races in Myrtletown are White / Caucasian (3,986 | 80.6%), Hispanic or Latino (528 | 10.7%), and Two or more Races (492 | 10.0%).
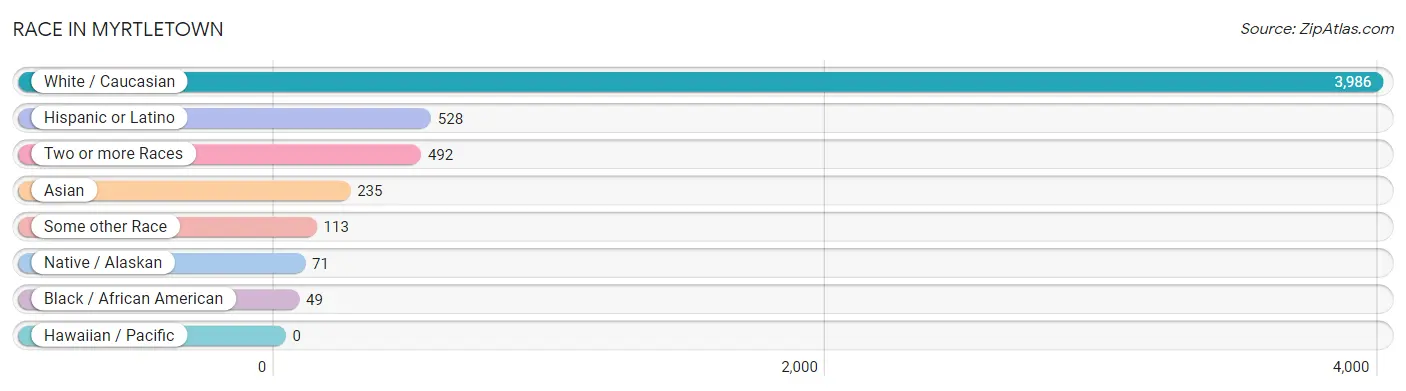
| Race | # Population | % Population |
| Asian | 235 | 4.8% |
| Black / African American | 49 | 1.0% |
| Hawaiian / Pacific | 0 | 0.0% |
| Hispanic or Latino | 528 | 10.7% |
| Native / Alaskan | 71 | 1.4% |
| White / Caucasian | 3,986 | 80.6% |
| Two or more Races | 492 | 10.0% |
| Some other Race | 113 | 2.3% |
| Total | 4,946 | 100.0% |
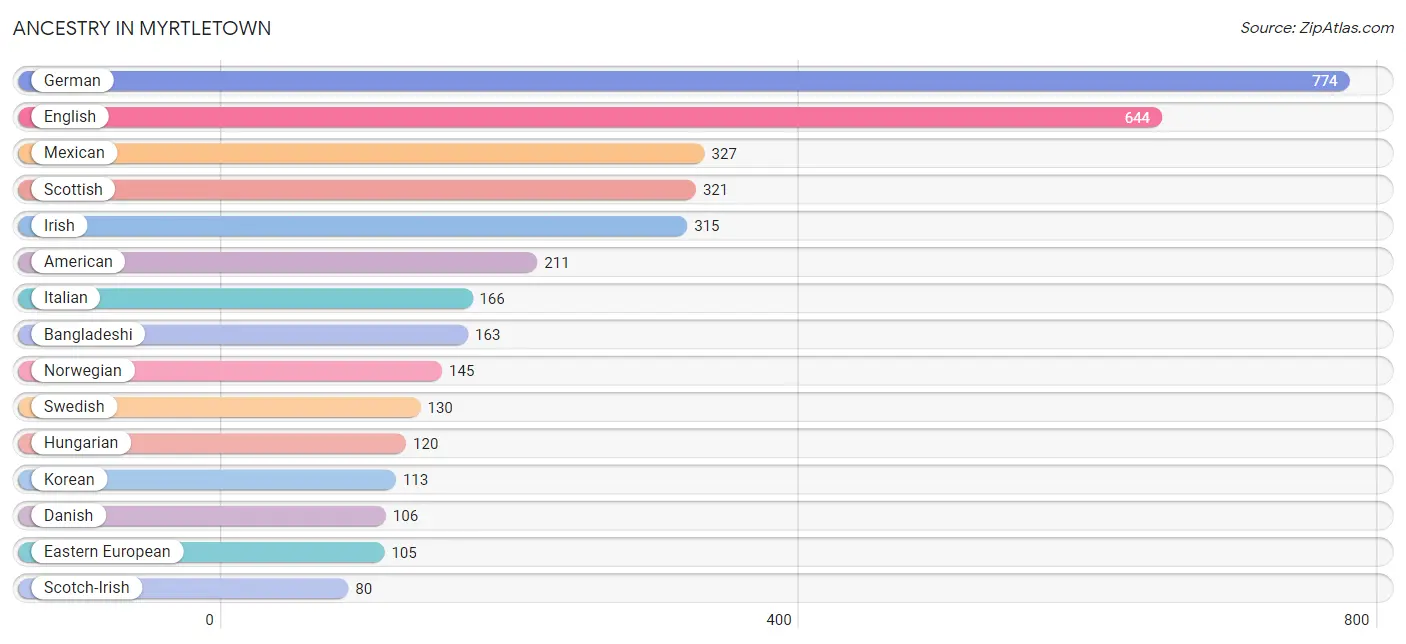
Ancestry in Myrtletown
The most populous ancestries reported in Myrtletown are German (774 | 15.7%), English (644 | 13.0%), Mexican (327 | 6.6%), Scottish (321 | 6.5%), and Irish (315 | 6.4%), together accounting for 48.1% of all Myrtletown residents.
| Ancestry | # Population | % Population |
| American | 211 | 4.3% |
| Arab | 67 | 1.3% |
| Austrian | 14 | 0.3% |
| Bangladeshi | 163 | 3.3% |
| Basque | 15 | 0.3% |
| Belizean | 71 | 1.4% |
| British | 19 | 0.4% |
| Central American Indian | 24 | 0.5% |
| Chilean | 22 | 0.4% |
| Choctaw | 15 | 0.3% |
| Danish | 106 | 2.1% |
| Dutch | 55 | 1.1% |
| Eastern European | 105 | 2.1% |
| English | 644 | 13.0% |
| European | 44 | 0.9% |
| French | 56 | 1.1% |
| French Canadian | 50 | 1.0% |
| German | 774 | 15.7% |
| Hungarian | 120 | 2.4% |
| Irish | 315 | 6.4% |
| Italian | 166 | 3.4% |
| Korean | 113 | 2.3% |
| Lebanese | 18 | 0.4% |
| Malaysian | 47 | 0.9% |
| Mexican | 327 | 6.6% |
| Norwegian | 145 | 2.9% |
| Pima | 25 | 0.5% |
| Polish | 72 | 1.5% |
| Portuguese | 40 | 0.8% |
| Potawatomi | 18 | 0.4% |
| Russian | 20 | 0.4% |
| Scandinavian | 57 | 1.1% |
| Scotch-Irish | 80 | 1.6% |
| Scottish | 321 | 6.5% |
| Slavic | 61 | 1.2% |
| South American | 22 | 0.4% |
| Spaniard | 51 | 1.0% |
| Sri Lankan | 7 | 0.1% |
| Swedish | 130 | 2.6% |
| Welsh | 9 | 0.2% | View All 40 Rows |
Immigrants in Myrtletown
The most numerous immigrant groups reported in Myrtletown came from Central America (156 | 3.2%), Latin America (156 | 3.2%), Mexico (156 | 3.2%), Asia (128 | 2.6%), and South Eastern Asia (72 | 1.5%), together accounting for 13.5% of all Myrtletown residents.
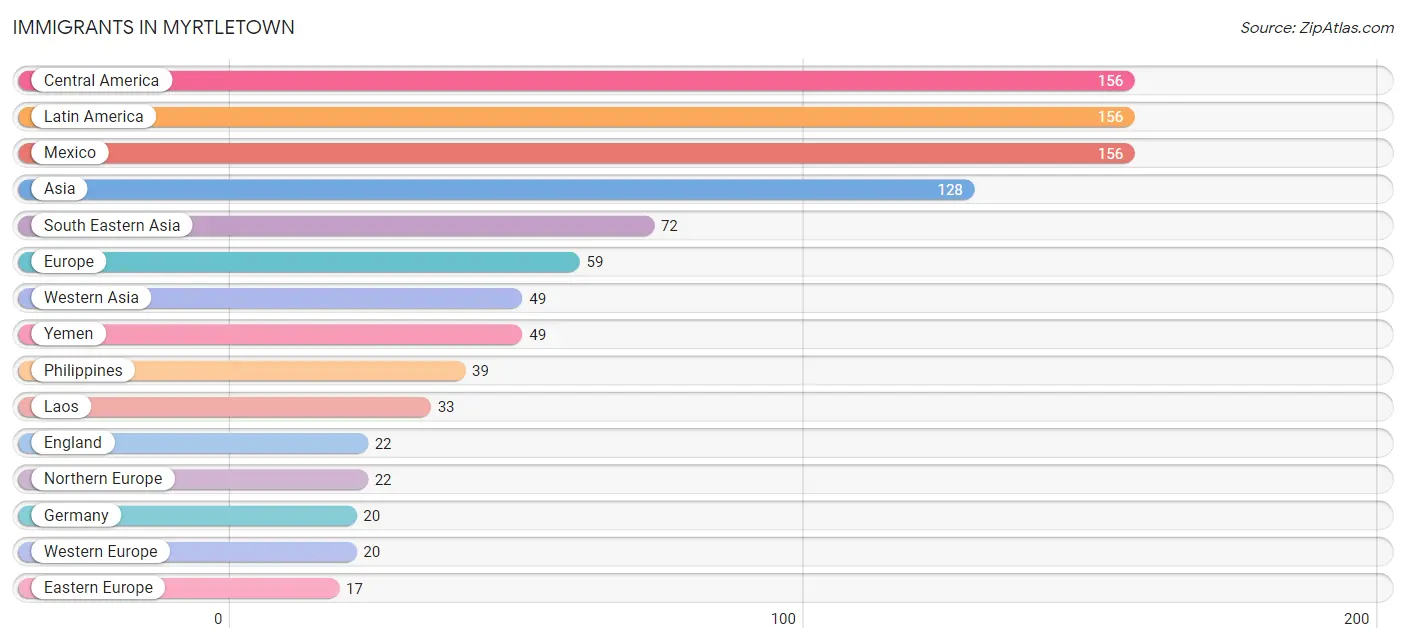
| Immigration Origin | # Population | % Population |
| Asia | 128 | 2.6% |
| Canada | 15 | 0.3% |
| Central America | 156 | 3.2% |
| China | 7 | 0.1% |
| Eastern Asia | 7 | 0.1% |
| Eastern Europe | 17 | 0.3% |
| England | 22 | 0.4% |
| Europe | 59 | 1.2% |
| Germany | 20 | 0.4% |
| Laos | 33 | 0.7% |
| Latin America | 156 | 3.2% |
| Mexico | 156 | 3.2% |
| Northern Europe | 22 | 0.4% |
| Philippines | 39 | 0.8% |
| Poland | 17 | 0.3% |
| South Eastern Asia | 72 | 1.5% |
| Western Asia | 49 | 1.0% |
| Western Europe | 20 | 0.4% |
| Yemen | 49 | 1.0% | View All 19 Rows |
Sex and Age in Myrtletown
Sex and Age in Myrtletown
The most populous age groups in Myrtletown are 70 to 74 Years (266 | 10.7%) for men and 60 to 64 Years (274 | 11.1%) for women.
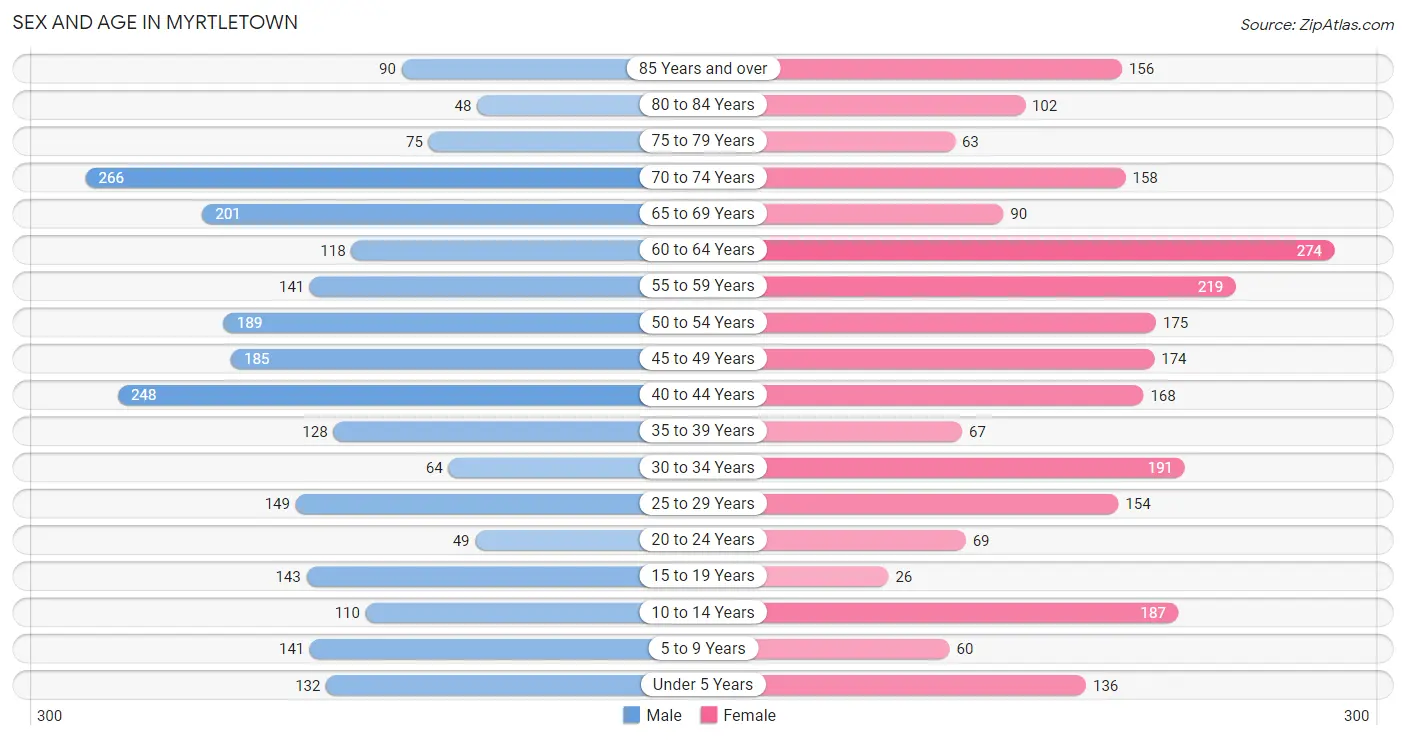
| Age Bracket | Male | Female |
| Under 5 Years | 132 (5.3%) | 136 (5.5%) |
| 5 to 9 Years | 141 (5.7%) | 60 (2.4%) |
| 10 to 14 Years | 110 (4.4%) | 187 (7.6%) |
| 15 to 19 Years | 143 (5.8%) | 26 (1.1%) |
| 20 to 24 Years | 49 (2.0%) | 69 (2.8%) |
| 25 to 29 Years | 149 (6.0%) | 154 (6.2%) |
| 30 to 34 Years | 64 (2.6%) | 191 (7.7%) |
| 35 to 39 Years | 128 (5.2%) | 67 (2.7%) |
| 40 to 44 Years | 248 (10.0%) | 168 (6.8%) |
| 45 to 49 Years | 185 (7.5%) | 174 (7.0%) |
| 50 to 54 Years | 189 (7.6%) | 175 (7.1%) |
| 55 to 59 Years | 141 (5.7%) | 219 (8.9%) |
| 60 to 64 Years | 118 (4.8%) | 274 (11.1%) |
| 65 to 69 Years | 201 (8.1%) | 90 (3.6%) |
| 70 to 74 Years | 266 (10.7%) | 158 (6.4%) |
| 75 to 79 Years | 75 (3.0%) | 63 (2.5%) |
| 80 to 84 Years | 48 (1.9%) | 102 (4.1%) |
| 85 Years and over | 90 (3.6%) | 156 (6.3%) |
| Total | 2,477 (100.0%) | 2,469 (100.0%) |
Families and Households in Myrtletown
Median Family Size in Myrtletown
The median family size in Myrtletown is 2.88 persons per family, with single male/father families (94 | 8.9%) accounting for the largest median family size of 4.33 persons per family. On the other hand, married-couple families (810 | 76.3%) represent the smallest median family size with 2.73 persons per family.
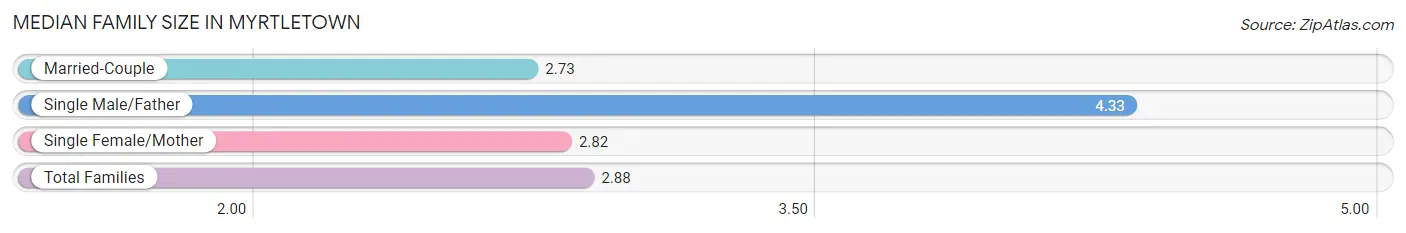
| Family Type | # Families | Family Size |
| Married-Couple | 810 (76.3%) | 2.73 |
| Single Male/Father | 94 (8.9%) | 4.33 |
| Single Female/Mother | 157 (14.8%) | 2.82 |
| Total Families | 1,061 (100.0%) | 2.88 |
Median Household Size in Myrtletown
The median household size in Myrtletown is 2.16 persons per household, with single male/father households (94 | 4.4%) accounting for the largest median household size of 4.78 persons per household. non-family households (1,081 | 50.5%) represent the smallest median household size with 1.27 persons per household.
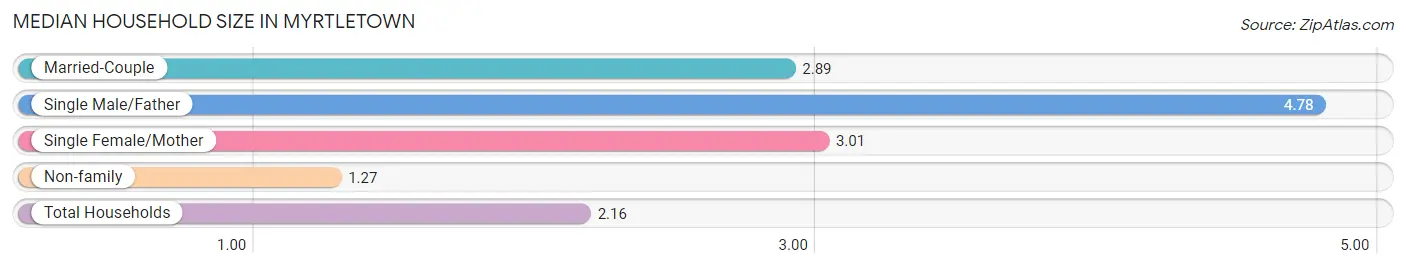
| Household Type | # Households | Household Size |
| Married-Couple | 810 (37.8%) | 2.89 |
| Single Male/Father | 94 (4.4%) | 4.78 |
| Single Female/Mother | 157 (7.3%) | 3.01 |
| Non-family | 1,081 (50.5%) | 1.27 |
| Total Households | 2,142 (100.0%) | 2.16 |
Household Size by Marriage Status in Myrtletown
Out of a total of 2,142 households in Myrtletown, 1,061 (49.5%) are family households, while 1,081 (50.5%) are nonfamily households. The most numerous type of family households are 2-person households, comprising 548, and the most common type of nonfamily households are 1-person households, comprising 853.
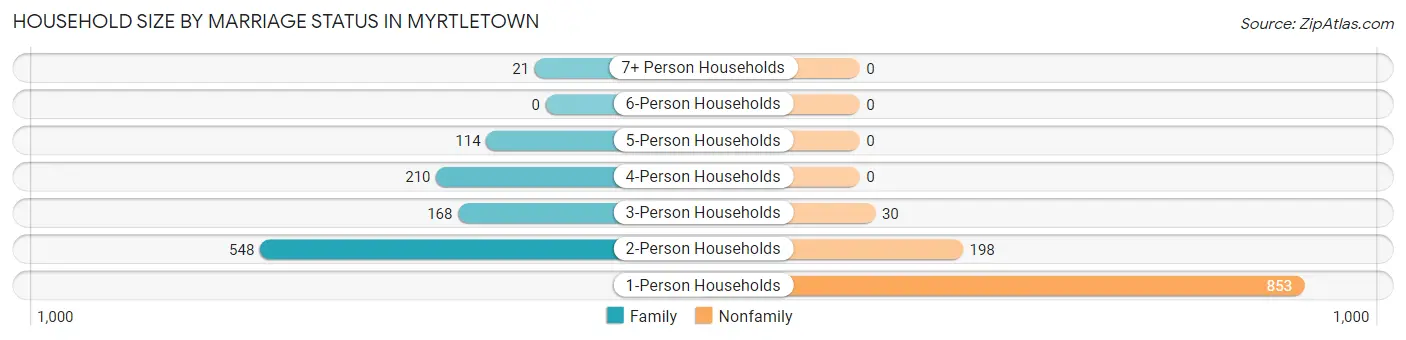
| Household Size | Family Households | Nonfamily Households |
| 1-Person Households | - | 853 (39.8%) |
| 2-Person Households | 548 (25.6%) | 198 (9.2%) |
| 3-Person Households | 168 (7.8%) | 30 (1.4%) |
| 4-Person Households | 210 (9.8%) | 0 (0.0%) |
| 5-Person Households | 114 (5.3%) | 0 (0.0%) |
| 6-Person Households | 0 (0.0%) | 0 (0.0%) |
| 7+ Person Households | 21 (1.0%) | 0 (0.0%) |
| Total | 1,061 (49.5%) | 1,081 (50.5%) |
Female Fertility in Myrtletown
Fertility by Age in Myrtletown
Average fertility rate in Myrtletown is 72.0 births per 1,000 women. Women in the age bracket of 20 to 34 years have the highest fertility rate with 155.0 births per 1,000 women. Women in the age bracket of 20 to 34 years acount for 100.0% of all women with births.
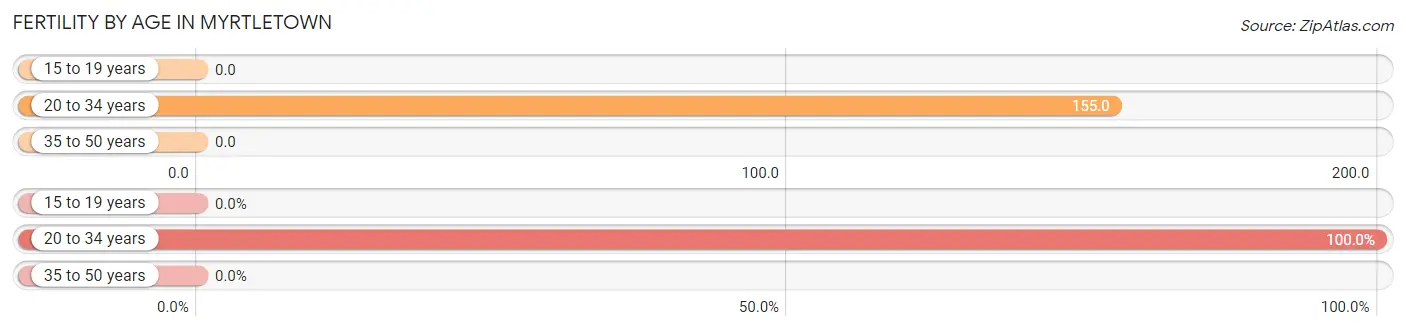
| Age Bracket | Women with Births | Births / 1,000 Women |
| 15 to 19 years | 0 (0.0%) | 0.0 |
| 20 to 34 years | 64 (100.0%) | 155.0 |
| 35 to 50 years | 0 (0.0%) | 0.0 |
| Total | 64 (100.0%) | 72.0 |
Fertility by Age by Marriage Status in Myrtletown
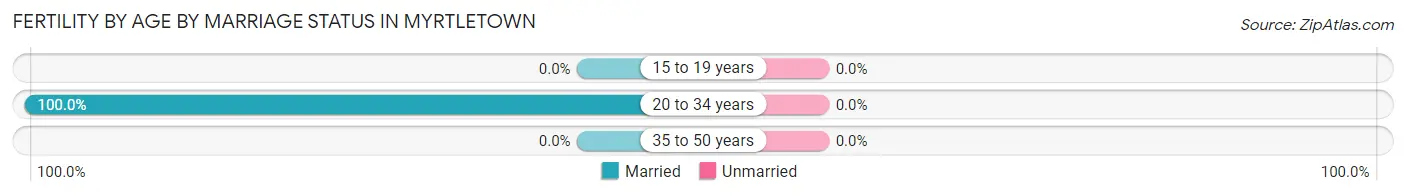
| Age Bracket | Married | Unmarried |
| 15 to 19 years | 0 (0.0%) | 0 (0.0%) |
| 20 to 34 years | 64 (100.0%) | 0 (0.0%) |
| 35 to 50 years | 0 (0.0%) | 0 (0.0%) |
| Total | 64 (100.0%) | 0 (0.0%) |
Fertility by Education in Myrtletown
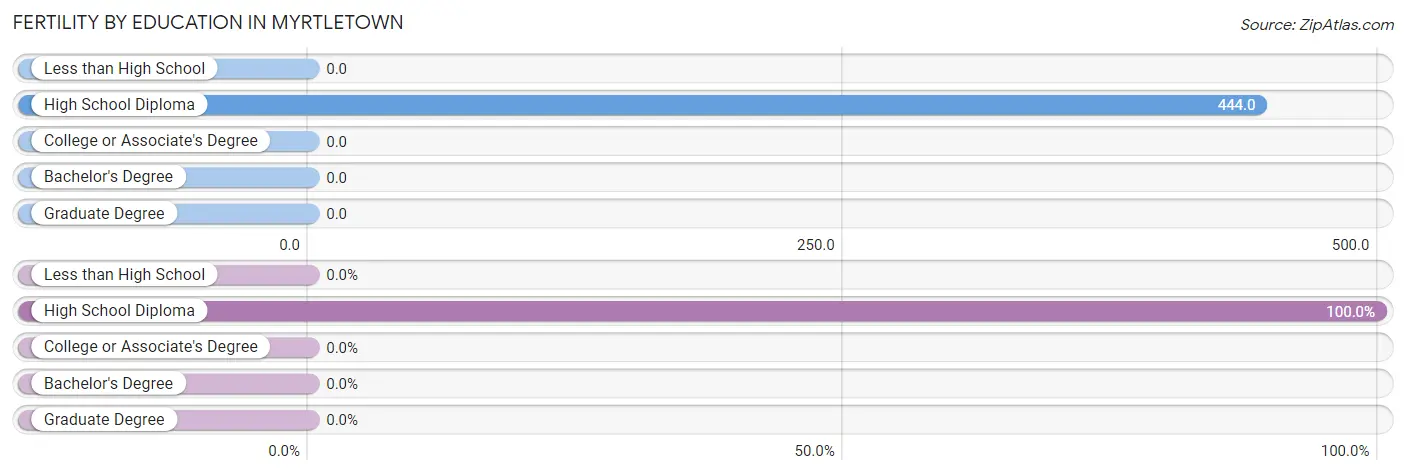
| Educational Attainment | Women with Births | Births / 1,000 Women |
| Less than High School | 0 (0.0%) | 0.0 |
| High School Diploma | 64 (100.0%) | 444.0 |
| College or Associate's Degree | 0 (0.0%) | 0.0 |
| Bachelor's Degree | 0 (0.0%) | 0.0 |
| Graduate Degree | 0 (0.0%) | 0.0 |
| Total | 64 (100.0%) | 72.0 |
Fertility by Education by Marriage Status in Myrtletown
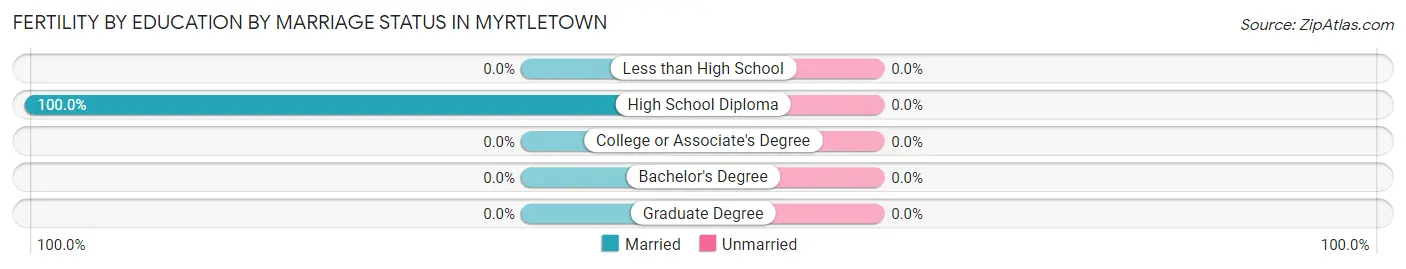
| Educational Attainment | Married | Unmarried |
| Less than High School | 0 (0.0%) | 0 (0.0%) |
| High School Diploma | 64 (100.0%) | 0 (0.0%) |
| College or Associate's Degree | 0 (0.0%) | 0 (0.0%) |
| Bachelor's Degree | 0 (0.0%) | 0 (0.0%) |
| Graduate Degree | 0 (0.0%) | 0 (0.0%) |
| Total | 64 (100.0%) | 0 (0.0%) |
Employment Characteristics in Myrtletown
Employment by Class of Employer in Myrtletown
Among the 1,905 employed individuals in Myrtletown, private company employees (947 | 49.7%), self-employed (not incorporated) (335 | 17.6%), and not-for-profit organizations (262 | 13.8%) make up the most common classes of employment.
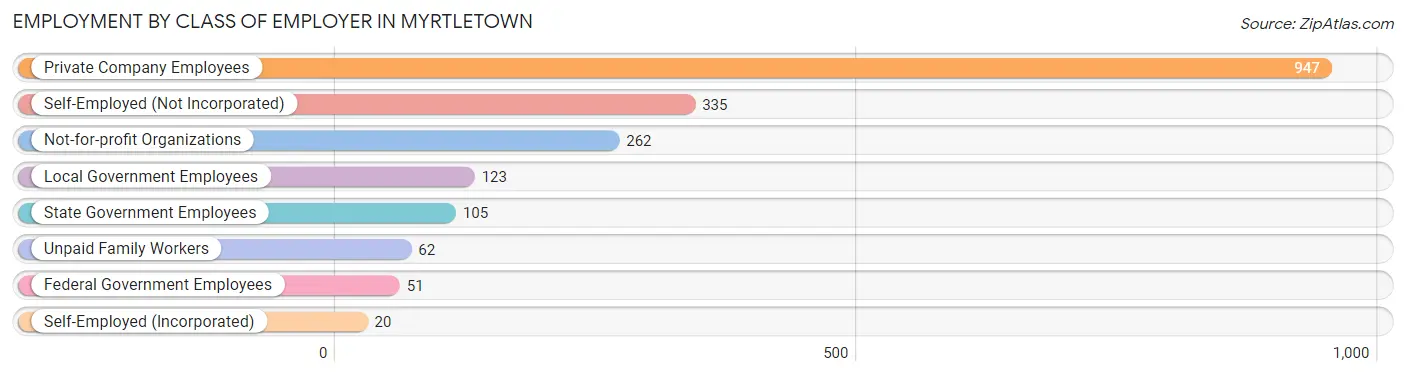
| Employer Class | # Employees | % Employees |
| Private Company Employees | 947 | 49.7% |
| Self-Employed (Incorporated) | 20 | 1.1% |
| Self-Employed (Not Incorporated) | 335 | 17.6% |
| Not-for-profit Organizations | 262 | 13.8% |
| Local Government Employees | 123 | 6.5% |
| State Government Employees | 105 | 5.5% |
| Federal Government Employees | 51 | 2.7% |
| Unpaid Family Workers | 62 | 3.3% |
| Total | 1,905 | 100.0% |
Employment Status by Age in Myrtletown
According to the labor force statistics for Myrtletown, out of the total population over 16 years of age (4,132), 49.8% or 2,058 individuals are in the labor force, with 7.5% or 154 of them unemployed. The age group with the highest labor force participation rate is 20 to 24 years, with 100.0% or 118 individuals in the labor force. Within the labor force, the 75 years and over age range has the highest percentage of unemployed individuals, with 100.0% or 28 of them being unemployed.
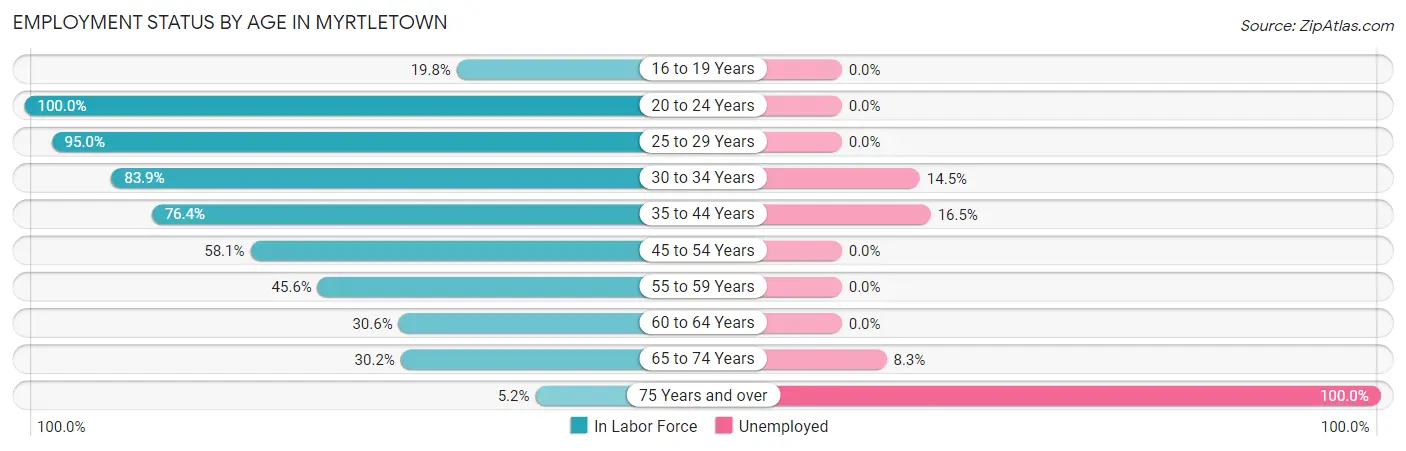
| Age Bracket | In Labor Force | Unemployed |
| 16 to 19 Years | 24 (19.8%) | 0 (0.0%) |
| 20 to 24 Years | 118 (100.0%) | 0 (0.0%) |
| 25 to 29 Years | 288 (95.0%) | 0 (0.0%) |
| 30 to 34 Years | 214 (83.9%) | 31 (14.5%) |
| 35 to 44 Years | 467 (76.4%) | 77 (16.5%) |
| 45 to 54 Years | 420 (58.1%) | 0 (0.0%) |
| 55 to 59 Years | 164 (45.6%) | 0 (0.0%) |
| 60 to 64 Years | 120 (30.6%) | 0 (0.0%) |
| 65 to 74 Years | 216 (30.2%) | 18 (8.3%) |
| 75 Years and over | 28 (5.2%) | 28 (100.0%) |
| Total | 2,058 (49.8%) | 154 (7.5%) |
Employment Status by Educational Attainment in Myrtletown
According to labor force statistics for Myrtletown, 63.3% of individuals (1,674) out of the total population between 25 and 64 years of age (2,644) are in the labor force, with 6.5% or 109 of them being unemployed. The group with the highest labor force participation rate are those with the educational attainment of college / associate degree, with 72.4% or 625 individuals in the labor force. Within the labor force, individuals with high school diploma education have the highest percentage of unemployment, with 34.9% or 91 of them being unemployed.
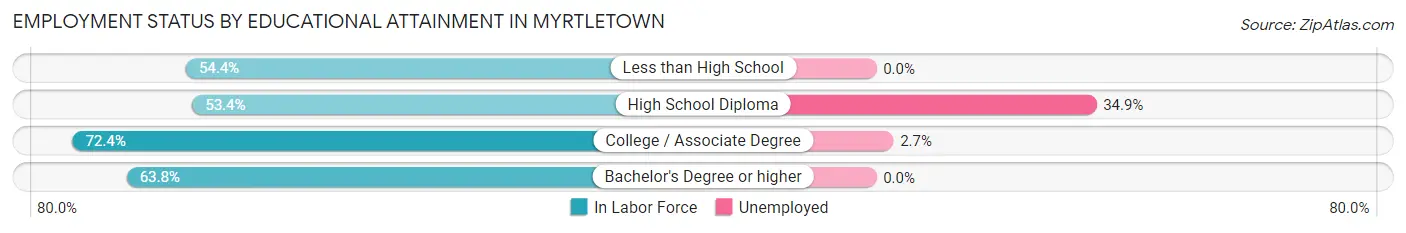
| Educational Attainment | In Labor Force | Unemployed |
| Less than High School | 216 (54.4%) | 0 (0.0%) |
| High School Diploma | 261 (53.4%) | 171 (34.9%) |
| College / Associate Degree | 625 (72.4%) | 23 (2.7%) |
| Bachelor's Degree or higher | 571 (63.8%) | 0 (0.0%) |
| Total | 1,674 (63.3%) | 172 (6.5%) |
Employment Occupations by Sex in Myrtletown
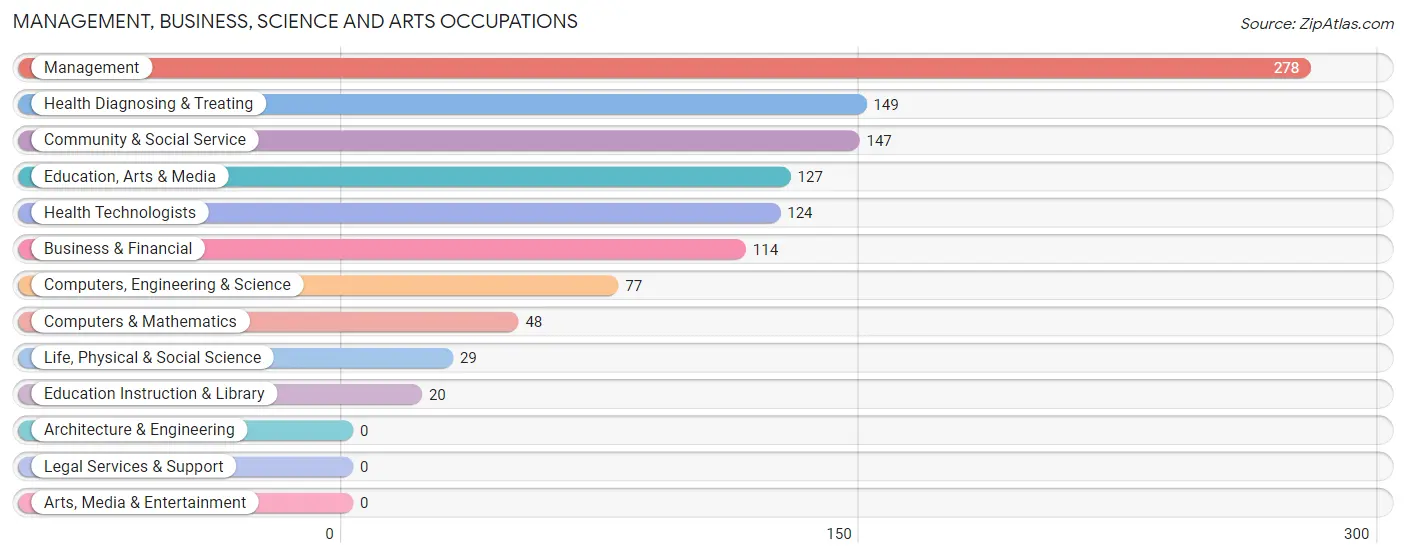
Management, Business, Science and Arts Occupations
The most common Management, Business, Science and Arts occupations in Myrtletown are Management (278 | 14.6%), Health Diagnosing & Treating (149 | 7.8%), Community & Social Service (147 | 7.7%), Education, Arts & Media (127 | 6.7%), and Health Technologists (124 | 6.5%).
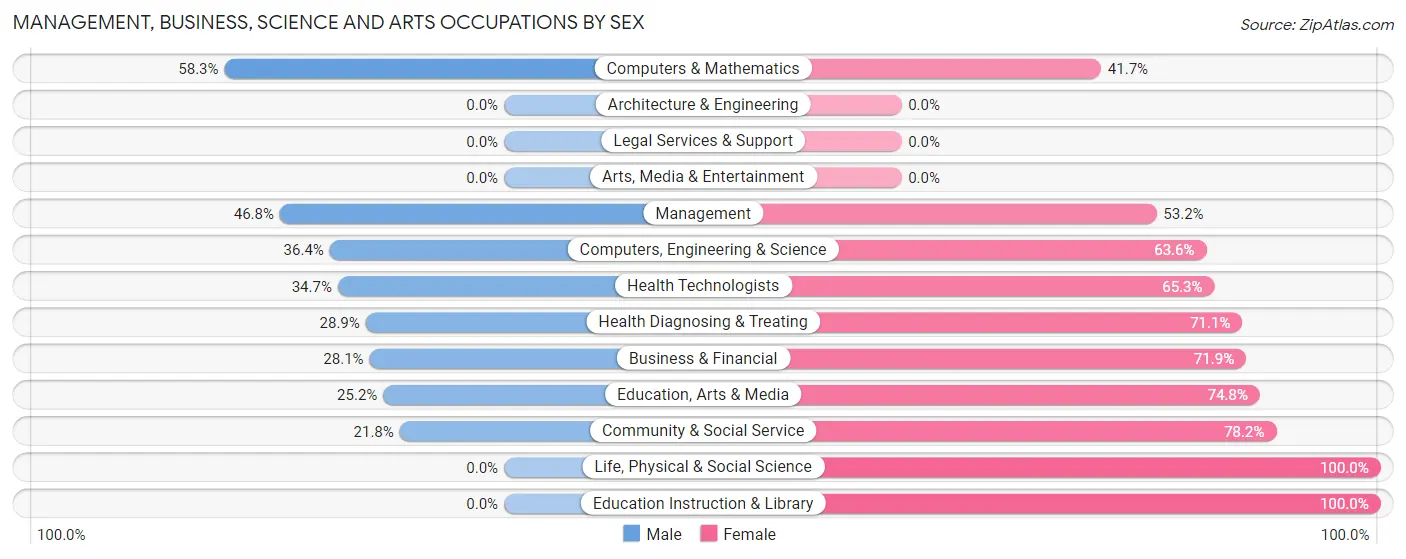
Management, Business, Science and Arts Occupations by Sex
Within the Management, Business, Science and Arts occupations in Myrtletown, the most male-oriented occupations are Computers & Mathematics (58.3%), Management (46.8%), and Computers, Engineering & Science (36.4%), while the most female-oriented occupations are Life, Physical & Social Science (100.0%), Education Instruction & Library (100.0%), and Community & Social Service (78.2%).
| Occupation | Male | Female |
| Management | 130 (46.8%) | 148 (53.2%) |
| Business & Financial | 32 (28.1%) | 82 (71.9%) |
| Computers, Engineering & Science | 28 (36.4%) | 49 (63.6%) |
| Computers & Mathematics | 28 (58.3%) | 20 (41.7%) |
| Architecture & Engineering | 0 (0.0%) | 0 (0.0%) |
| Life, Physical & Social Science | 0 (0.0%) | 29 (100.0%) |
| Community & Social Service | 32 (21.8%) | 115 (78.2%) |
| Education, Arts & Media | 32 (25.2%) | 95 (74.8%) |
| Legal Services & Support | 0 (0.0%) | 0 (0.0%) |
| Education Instruction & Library | 0 (0.0%) | 20 (100.0%) |
| Arts, Media & Entertainment | 0 (0.0%) | 0 (0.0%) |
| Health Diagnosing & Treating | 43 (28.9%) | 106 (71.1%) |
| Health Technologists | 43 (34.7%) | 81 (65.3%) |
| Total (Category) | 265 (34.6%) | 500 (65.4%) |
| Total (Overall) | 1,068 (56.1%) | 837 (43.9%) |
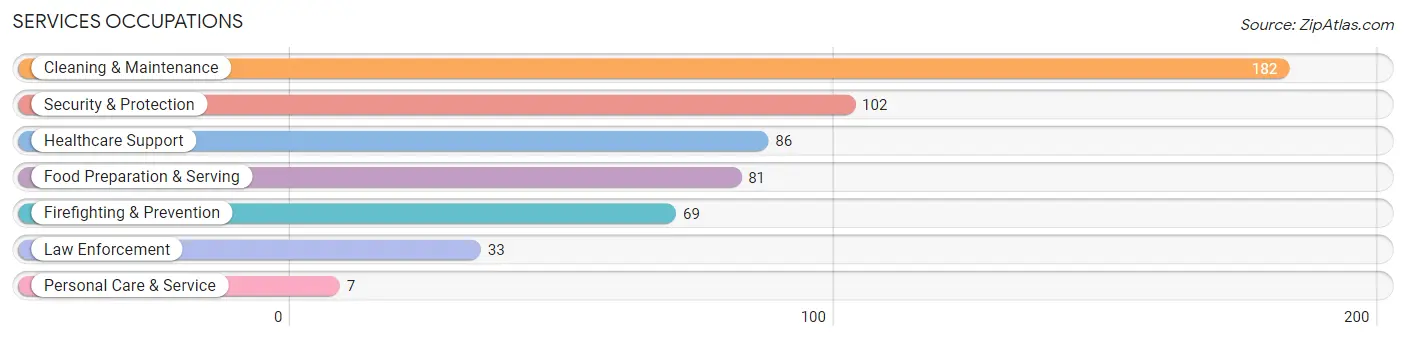
Services Occupations
The most common Services occupations in Myrtletown are Cleaning & Maintenance (182 | 9.6%), Security & Protection (102 | 5.3%), Healthcare Support (86 | 4.5%), Food Preparation & Serving (81 | 4.3%), and Firefighting & Prevention (69 | 3.6%).
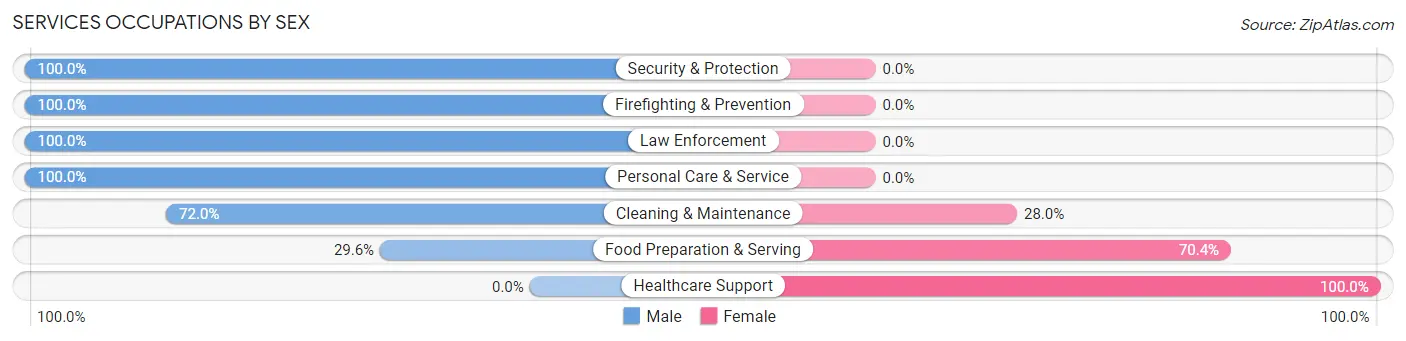
Services Occupations by Sex
Within the Services occupations in Myrtletown, the most male-oriented occupations are Security & Protection (100.0%), Firefighting & Prevention (100.0%), and Law Enforcement (100.0%), while the most female-oriented occupations are Healthcare Support (100.0%), Food Preparation & Serving (70.4%), and Cleaning & Maintenance (28.0%).
| Occupation | Male | Female |
| Healthcare Support | 0 (0.0%) | 86 (100.0%) |
| Security & Protection | 102 (100.0%) | 0 (0.0%) |
| Firefighting & Prevention | 69 (100.0%) | 0 (0.0%) |
| Law Enforcement | 33 (100.0%) | 0 (0.0%) |
| Food Preparation & Serving | 24 (29.6%) | 57 (70.4%) |
| Cleaning & Maintenance | 131 (72.0%) | 51 (28.0%) |
| Personal Care & Service | 7 (100.0%) | 0 (0.0%) |
| Total (Category) | 264 (57.6%) | 194 (42.4%) |
| Total (Overall) | 1,068 (56.1%) | 837 (43.9%) |
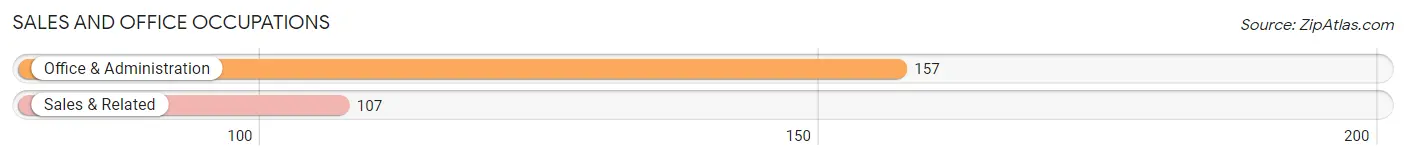
Sales and Office Occupations
The most common Sales and Office occupations in Myrtletown are Office & Administration (157 | 8.2%), and Sales & Related (107 | 5.6%).
Sales and Office Occupations by Sex
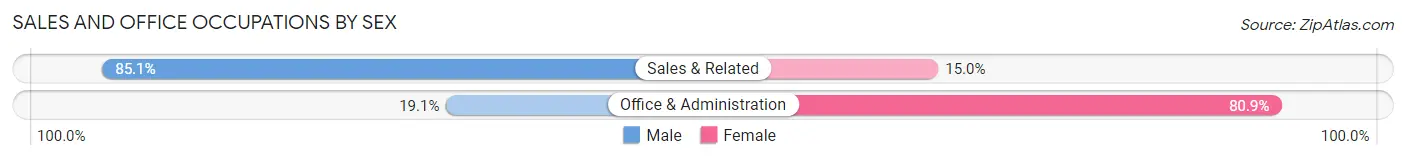
| Occupation | Male | Female |
| Sales & Related | 91 (85.1%) | 16 (14.9%) |
| Office & Administration | 30 (19.1%) | 127 (80.9%) |
| Total (Category) | 121 (45.8%) | 143 (54.2%) |
| Total (Overall) | 1,068 (56.1%) | 837 (43.9%) |
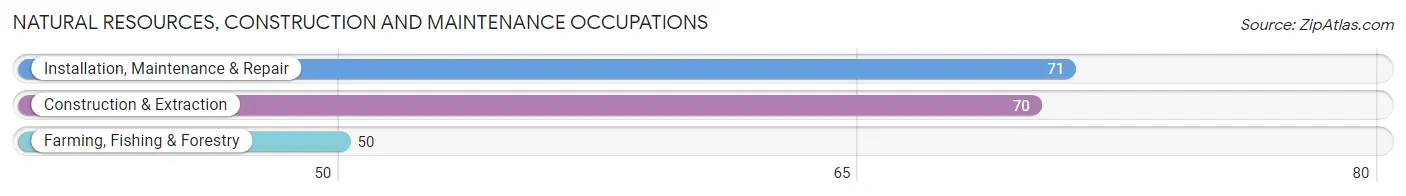
Natural Resources, Construction and Maintenance Occupations
The most common Natural Resources, Construction and Maintenance occupations in Myrtletown are Installation, Maintenance & Repair (71 | 3.7%), Construction & Extraction (70 | 3.7%), and Farming, Fishing & Forestry (50 | 2.6%).
Natural Resources, Construction and Maintenance Occupations by Sex
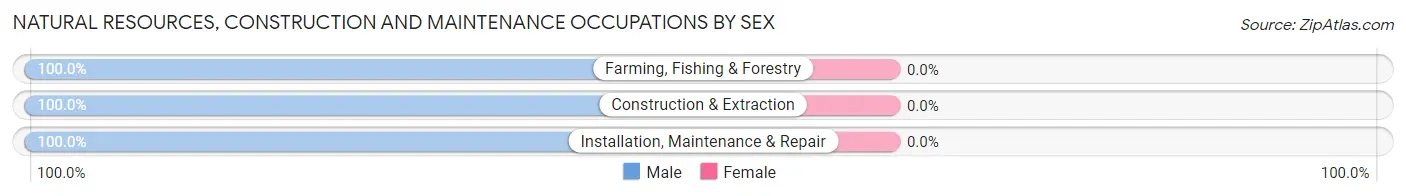
| Occupation | Male | Female |
| Farming, Fishing & Forestry | 50 (100.0%) | 0 (0.0%) |
| Construction & Extraction | 70 (100.0%) | 0 (0.0%) |
| Installation, Maintenance & Repair | 71 (100.0%) | 0 (0.0%) |
| Total (Category) | 191 (100.0%) | 0 (0.0%) |
| Total (Overall) | 1,068 (56.1%) | 837 (43.9%) |
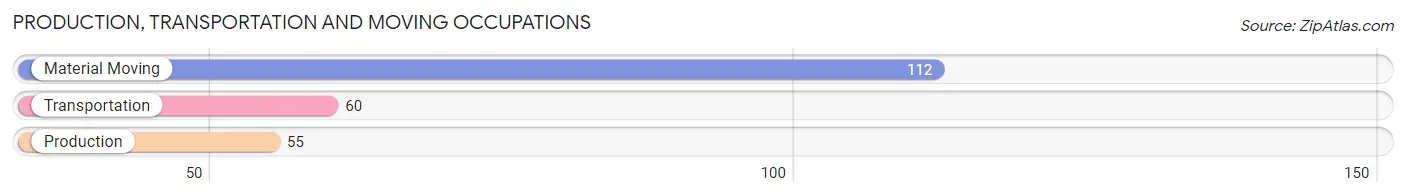
Production, Transportation and Moving Occupations
The most common Production, Transportation and Moving occupations in Myrtletown are Material Moving (112 | 5.9%), Transportation (60 | 3.2%), and Production (55 | 2.9%).
Production, Transportation and Moving Occupations by Sex
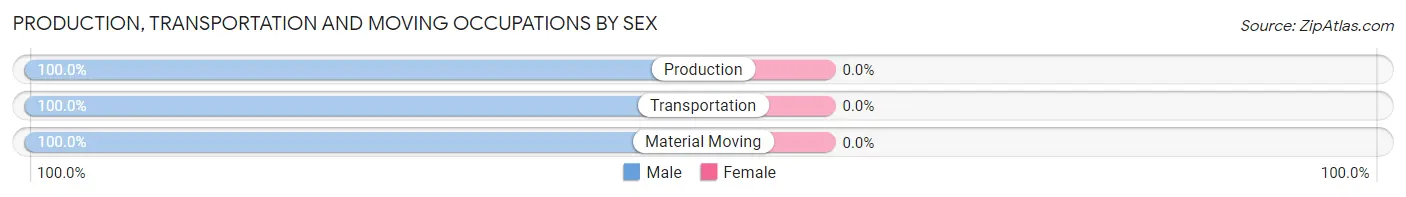
| Occupation | Male | Female |
| Production | 55 (100.0%) | 0 (0.0%) |
| Transportation | 60 (100.0%) | 0 (0.0%) |
| Material Moving | 112 (100.0%) | 0 (0.0%) |
| Total (Category) | 227 (100.0%) | 0 (0.0%) |
| Total (Overall) | 1,068 (56.1%) | 837 (43.9%) |
Employment Industries by Sex in Myrtletown
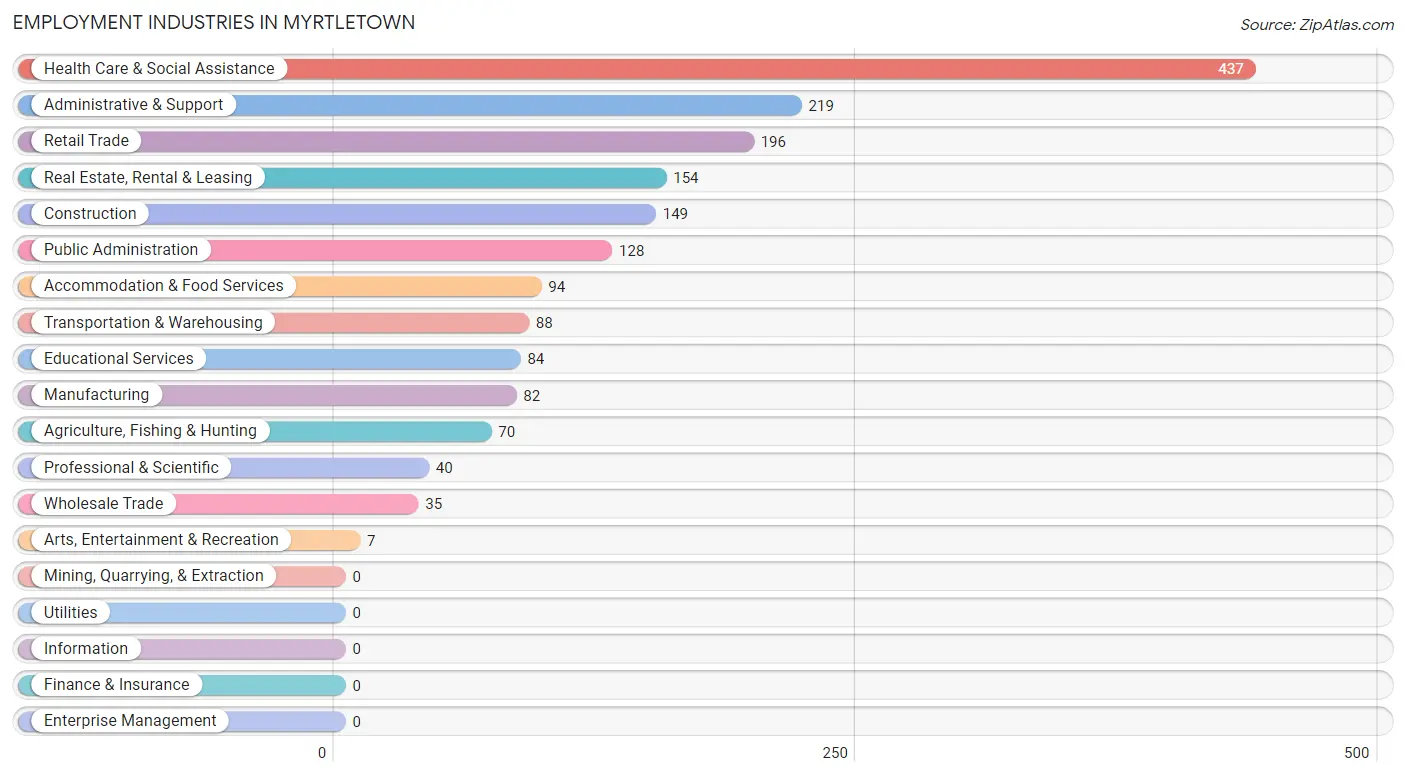
Employment Industries in Myrtletown
The major employment industries in Myrtletown include Health Care & Social Assistance (437 | 22.9%), Administrative & Support (219 | 11.5%), Retail Trade (196 | 10.3%), Real Estate, Rental & Leasing (154 | 8.1%), and Construction (149 | 7.8%).
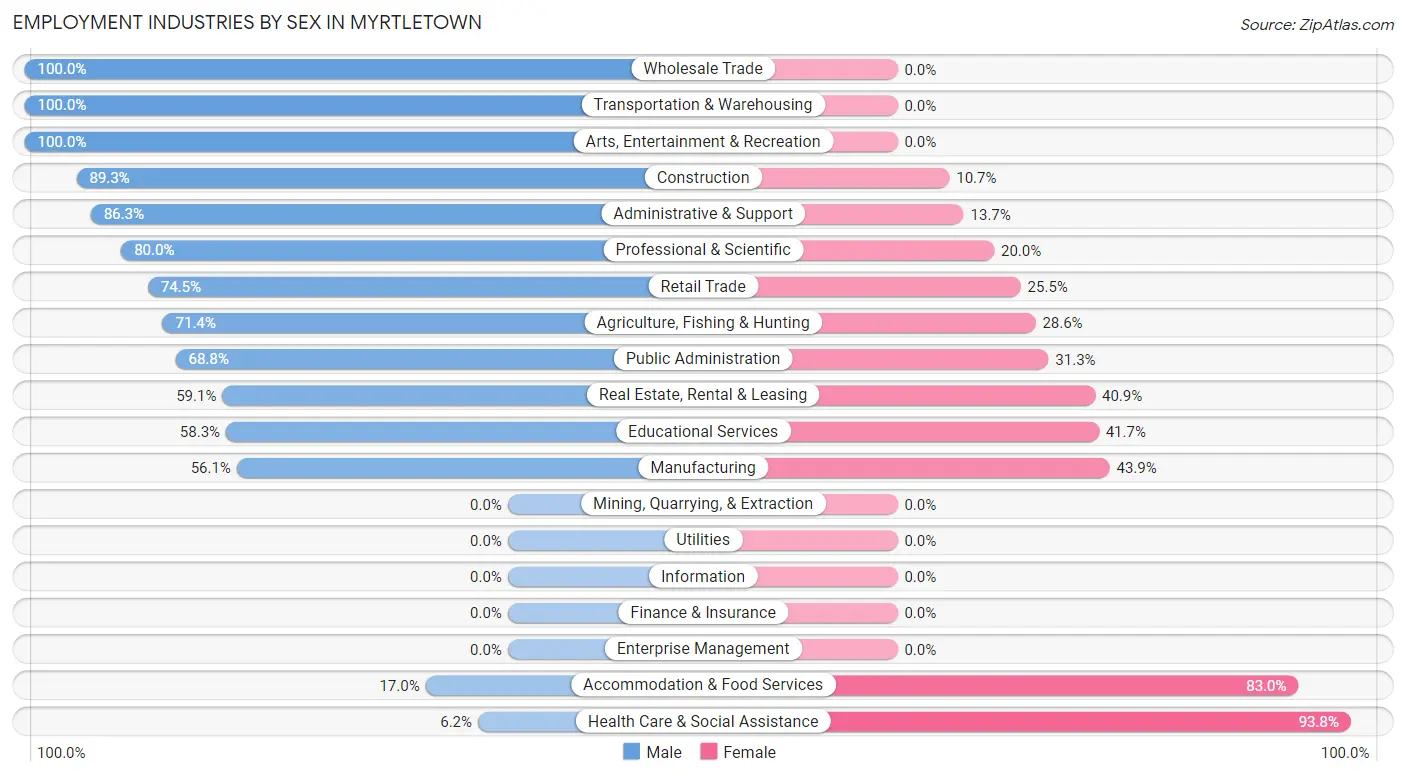
Employment Industries by Sex in Myrtletown
The Myrtletown industries that see more men than women are Wholesale Trade (100.0%), Transportation & Warehousing (100.0%), and Arts, Entertainment & Recreation (100.0%), whereas the industries that tend to have a higher number of women are Health Care & Social Assistance (93.8%), Accommodation & Food Services (83.0%), and Manufacturing (43.9%).
| Industry | Male | Female |
| Agriculture, Fishing & Hunting | 50 (71.4%) | 20 (28.6%) |
| Mining, Quarrying, & Extraction | 0 (0.0%) | 0 (0.0%) |
| Construction | 133 (89.3%) | 16 (10.7%) |
| Manufacturing | 46 (56.1%) | 36 (43.9%) |
| Wholesale Trade | 35 (100.0%) | 0 (0.0%) |
| Retail Trade | 146 (74.5%) | 50 (25.5%) |
| Transportation & Warehousing | 88 (100.0%) | 0 (0.0%) |
| Utilities | 0 (0.0%) | 0 (0.0%) |
| Information | 0 (0.0%) | 0 (0.0%) |
| Finance & Insurance | 0 (0.0%) | 0 (0.0%) |
| Real Estate, Rental & Leasing | 91 (59.1%) | 63 (40.9%) |
| Professional & Scientific | 32 (80.0%) | 8 (20.0%) |
| Enterprise Management | 0 (0.0%) | 0 (0.0%) |
| Administrative & Support | 189 (86.3%) | 30 (13.7%) |
| Educational Services | 49 (58.3%) | 35 (41.7%) |
| Health Care & Social Assistance | 27 (6.2%) | 410 (93.8%) |
| Arts, Entertainment & Recreation | 7 (100.0%) | 0 (0.0%) |
| Accommodation & Food Services | 16 (17.0%) | 78 (83.0%) |
| Public Administration | 88 (68.8%) | 40 (31.2%) |
| Total | 1,068 (56.1%) | 837 (43.9%) |
Education in Myrtletown
School Enrollment in Myrtletown
The most common levels of schooling among the 823 students in Myrtletown are middle school (251 | 30.5%), high school (175 | 21.3%), and elementary school (137 | 16.7%).
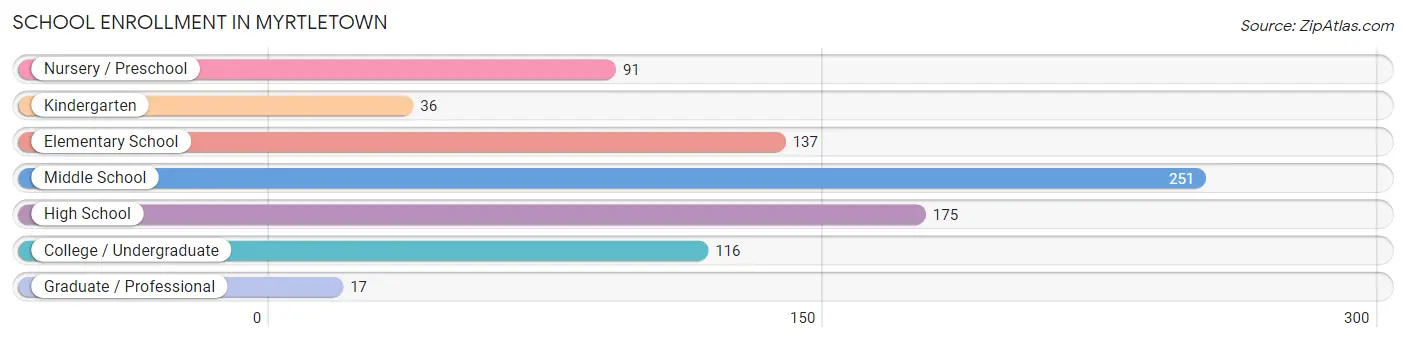
| School Level | # Students | % Students |
| Nursery / Preschool | 91 | 11.1% |
| Kindergarten | 36 | 4.4% |
| Elementary School | 137 | 16.7% |
| Middle School | 251 | 30.5% |
| High School | 175 | 21.3% |
| College / Undergraduate | 116 | 14.1% |
| Graduate / Professional | 17 | 2.1% |
| Total | 823 | 100.0% |
School Enrollment by Age by Funding Source in Myrtletown
Out of a total of 823 students who are enrolled in schools in Myrtletown, 148 (18.0%) attend a private institution, while the remaining 675 (82.0%) are enrolled in public schools. The age group of 3 to 4 year olds has the highest likelihood of being enrolled in private schools, with 74 (100.0% in the age bracket) enrolled. Conversely, the age group of 10 to 14 year olds has the lowest likelihood of being enrolled in a private school, with 297 (100.0% in the age bracket) attending a public institution.
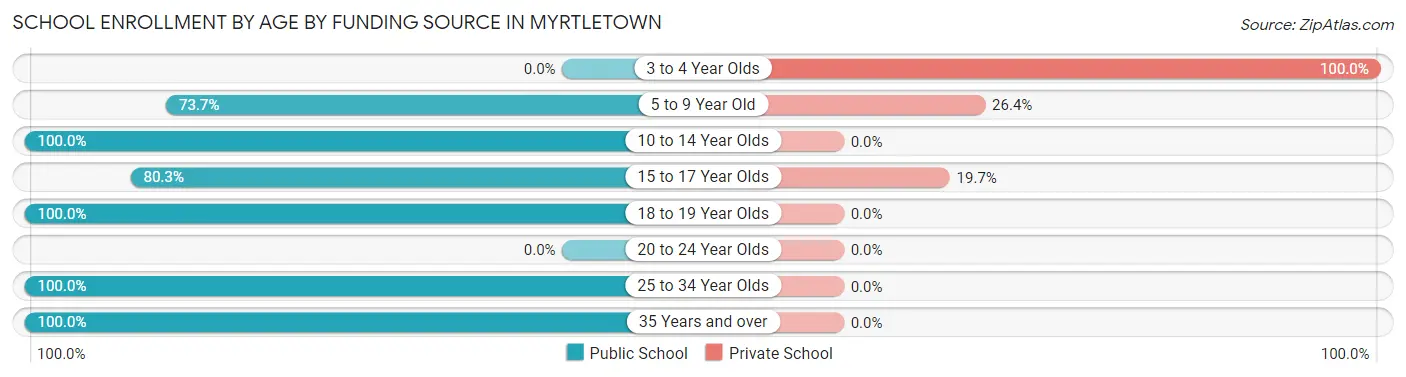
| Age Bracket | Public School | Private School |
| 3 to 4 Year Olds | 0 (0.0%) | 74 (100.0%) |
| 5 to 9 Year Old | 123 (73.7%) | 44 (26.4%) |
| 10 to 14 Year Olds | 297 (100.0%) | 0 (0.0%) |
| 15 to 17 Year Olds | 122 (80.3%) | 30 (19.7%) |
| 18 to 19 Year Olds | 9 (100.0%) | 0 (0.0%) |
| 20 to 24 Year Olds | 0 (0.0%) | 0 (0.0%) |
| 25 to 34 Year Olds | 17 (100.0%) | 0 (0.0%) |
| 35 Years and over | 107 (100.0%) | 0 (0.0%) |
| Total | 675 (82.0%) | 148 (18.0%) |
Educational Attainment by Field of Study in Myrtletown
Business (292 | 18.6%), education (221 | 14.1%), bio, nature & agricultural (189 | 12.0%), psychology (187 | 11.9%), and liberal arts & history (154 | 9.8%) are the most common fields of study among 1,572 individuals in Myrtletown who have obtained a bachelor's degree or higher.
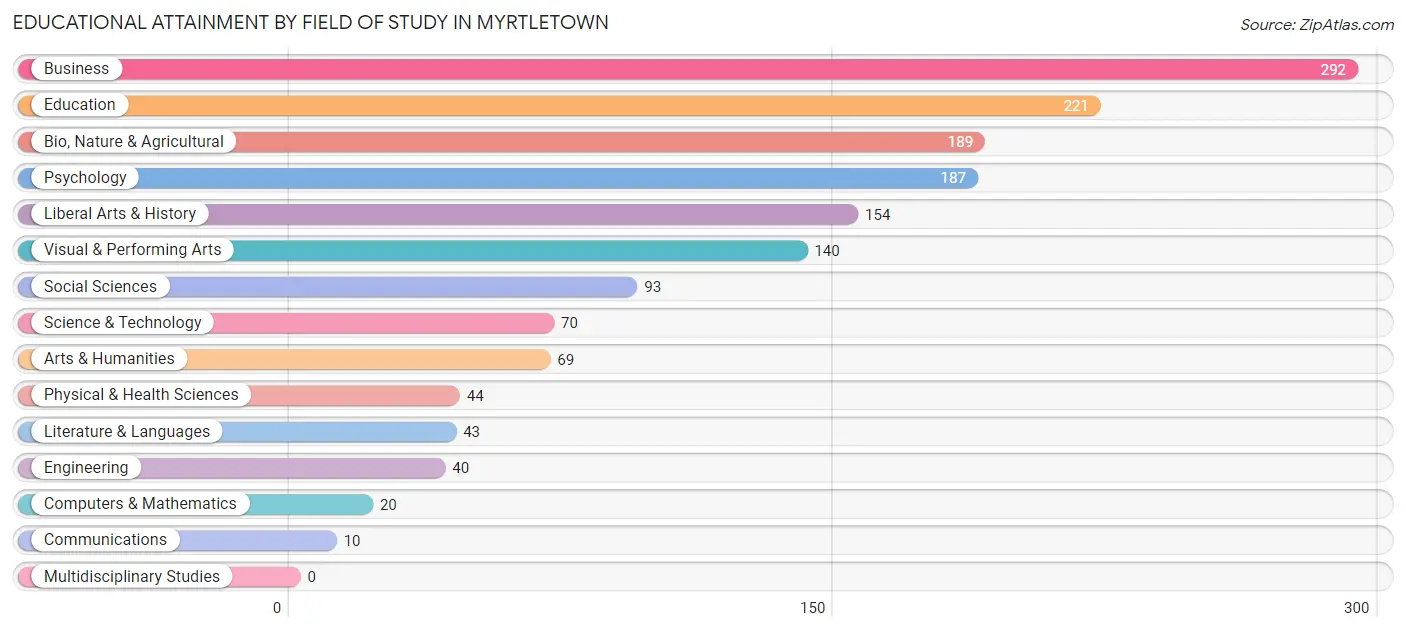
| Field of Study | # Graduates | % Graduates |
| Computers & Mathematics | 20 | 1.3% |
| Bio, Nature & Agricultural | 189 | 12.0% |
| Physical & Health Sciences | 44 | 2.8% |
| Psychology | 187 | 11.9% |
| Social Sciences | 93 | 5.9% |
| Engineering | 40 | 2.5% |
| Multidisciplinary Studies | 0 | 0.0% |
| Science & Technology | 70 | 4.4% |
| Business | 292 | 18.6% |
| Education | 221 | 14.1% |
| Literature & Languages | 43 | 2.7% |
| Liberal Arts & History | 154 | 9.8% |
| Visual & Performing Arts | 140 | 8.9% |
| Communications | 10 | 0.6% |
| Arts & Humanities | 69 | 4.4% |
| Total | 1,572 | 100.0% |
Transportation & Commute in Myrtletown
Vehicle Availability by Sex in Myrtletown
The most prevalent vehicle ownership categories in Myrtletown are males with 2 vehicles (560, accounting for 53.4%) and females with 2 vehicles (421, making up 70.9%).
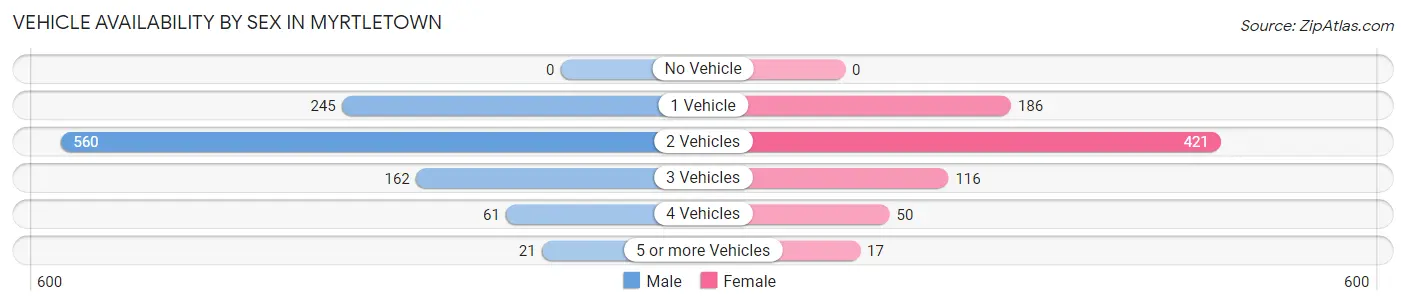
| Vehicles Available | Male | Female |
| No Vehicle | 0 (0.0%) | 0 (0.0%) |
| 1 Vehicle | 245 (23.4%) | 186 (23.5%) |
| 2 Vehicles | 560 (53.4%) | 421 (53.3%) |
| 3 Vehicles | 162 (15.4%) | 116 (14.7%) |
| 4 Vehicles | 61 (5.8%) | 50 (6.3%) |
| 5 or more Vehicles | 21 (2.0%) | 17 (2.1%) |
| Total | 1,049 (100.0%) | 790 (100.0%) |
Commute Time in Myrtletown
The most frequently occuring commute durations in Myrtletown are 10 to 14 minutes (546 commuters, 36.3%), 15 to 19 minutes (234 commuters, 15.6%), and 5 to 9 minutes (214 commuters, 14.2%).
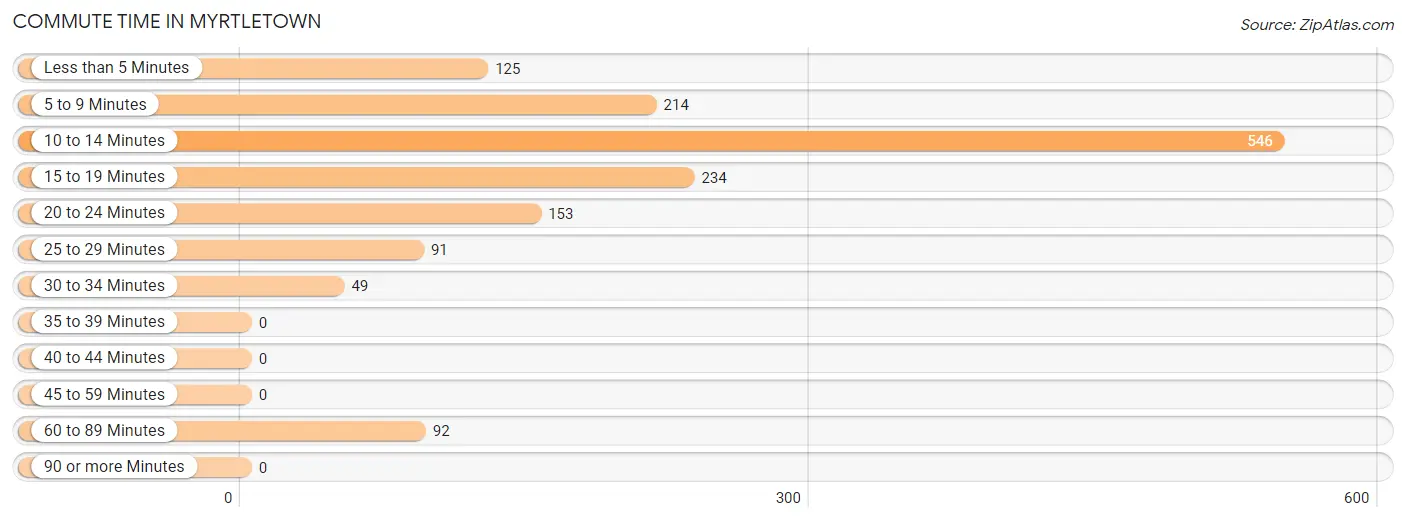
| Commute Time | # Commuters | % Commuters |
| Less than 5 Minutes | 125 | 8.3% |
| 5 to 9 Minutes | 214 | 14.2% |
| 10 to 14 Minutes | 546 | 36.3% |
| 15 to 19 Minutes | 234 | 15.6% |
| 20 to 24 Minutes | 153 | 10.2% |
| 25 to 29 Minutes | 91 | 6.0% |
| 30 to 34 Minutes | 49 | 3.3% |
| 35 to 39 Minutes | 0 | 0.0% |
| 40 to 44 Minutes | 0 | 0.0% |
| 45 to 59 Minutes | 0 | 0.0% |
| 60 to 89 Minutes | 92 | 6.1% |
| 90 or more Minutes | 0 | 0.0% |
Commute Time by Sex in Myrtletown
The most common commute times in Myrtletown are 10 to 14 minutes (348 commuters, 37.8%) for males and 10 to 14 minutes (198 commuters, 33.9%) for females.
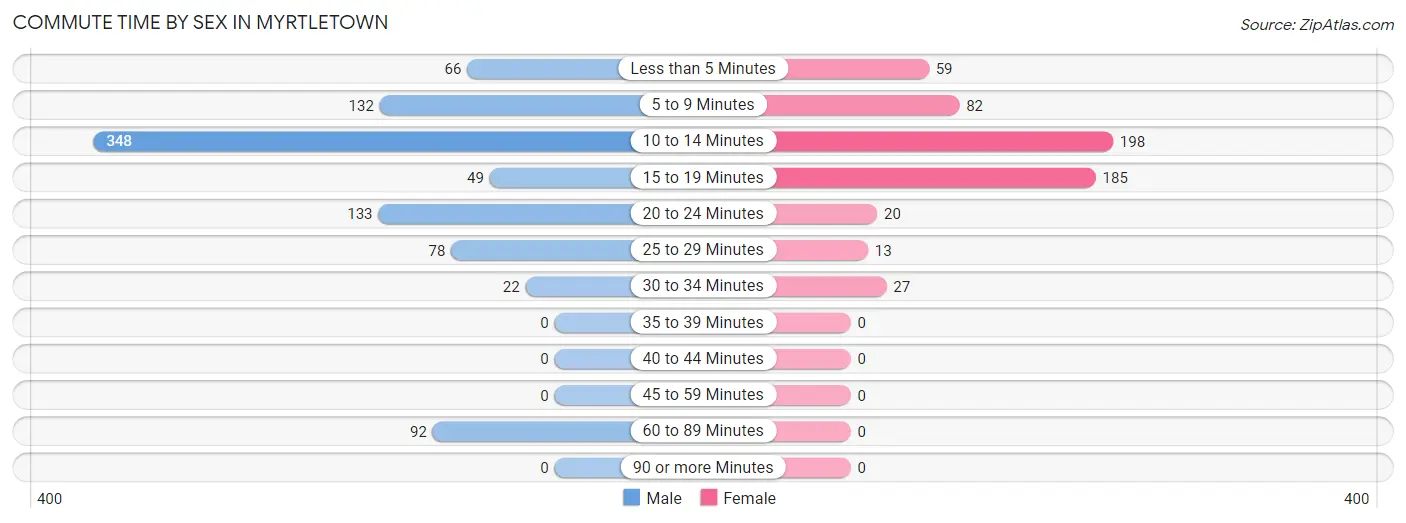
| Commute Time | Male | Female |
| Less than 5 Minutes | 66 (7.2%) | 59 (10.1%) |
| 5 to 9 Minutes | 132 (14.3%) | 82 (14.0%) |
| 10 to 14 Minutes | 348 (37.8%) | 198 (33.9%) |
| 15 to 19 Minutes | 49 (5.3%) | 185 (31.7%) |
| 20 to 24 Minutes | 133 (14.5%) | 20 (3.4%) |
| 25 to 29 Minutes | 78 (8.5%) | 13 (2.2%) |
| 30 to 34 Minutes | 22 (2.4%) | 27 (4.6%) |
| 35 to 39 Minutes | 0 (0.0%) | 0 (0.0%) |
| 40 to 44 Minutes | 0 (0.0%) | 0 (0.0%) |
| 45 to 59 Minutes | 0 (0.0%) | 0 (0.0%) |
| 60 to 89 Minutes | 92 (10.0%) | 0 (0.0%) |
| 90 or more Minutes | 0 (0.0%) | 0 (0.0%) |
Time of Departure to Work by Sex in Myrtletown
The most frequent times of departure to work in Myrtletown are 10:00 AM to 10:59 AM (205, 22.3%) for males and 8:00 AM to 8:29 AM (137, 23.5%) for females.
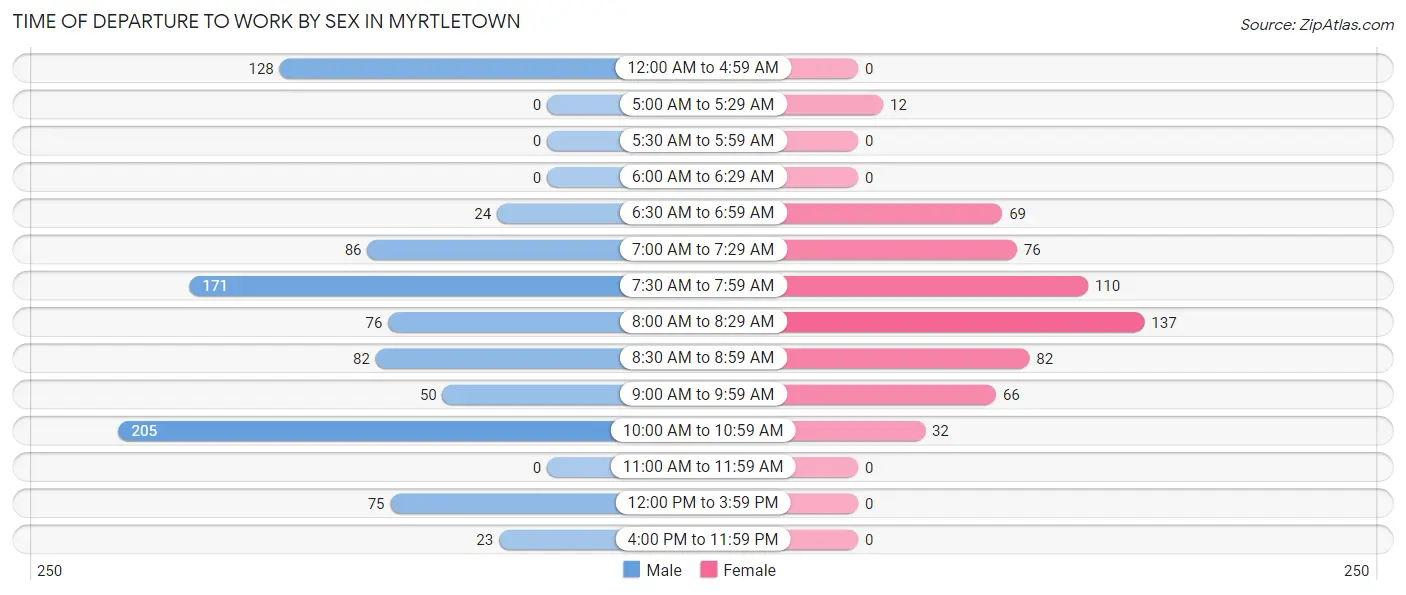
| Time of Departure | Male | Female |
| 12:00 AM to 4:59 AM | 128 (13.9%) | 0 (0.0%) |
| 5:00 AM to 5:29 AM | 0 (0.0%) | 12 (2.1%) |
| 5:30 AM to 5:59 AM | 0 (0.0%) | 0 (0.0%) |
| 6:00 AM to 6:29 AM | 0 (0.0%) | 0 (0.0%) |
| 6:30 AM to 6:59 AM | 24 (2.6%) | 69 (11.8%) |
| 7:00 AM to 7:29 AM | 86 (9.3%) | 76 (13.0%) |
| 7:30 AM to 7:59 AM | 171 (18.6%) | 110 (18.8%) |
| 8:00 AM to 8:29 AM | 76 (8.3%) | 137 (23.5%) |
| 8:30 AM to 8:59 AM | 82 (8.9%) | 82 (14.0%) |
| 9:00 AM to 9:59 AM | 50 (5.4%) | 66 (11.3%) |
| 10:00 AM to 10:59 AM | 205 (22.3%) | 32 (5.5%) |
| 11:00 AM to 11:59 AM | 0 (0.0%) | 0 (0.0%) |
| 12:00 PM to 3:59 PM | 75 (8.2%) | 0 (0.0%) |
| 4:00 PM to 11:59 PM | 23 (2.5%) | 0 (0.0%) |
| Total | 920 (100.0%) | 584 (100.0%) |
Housing Occupancy in Myrtletown
Occupancy by Ownership in Myrtletown
Of the total 2,142 dwellings in Myrtletown, owner-occupied units account for 1,208 (56.4%), while renter-occupied units make up 934 (43.6%).
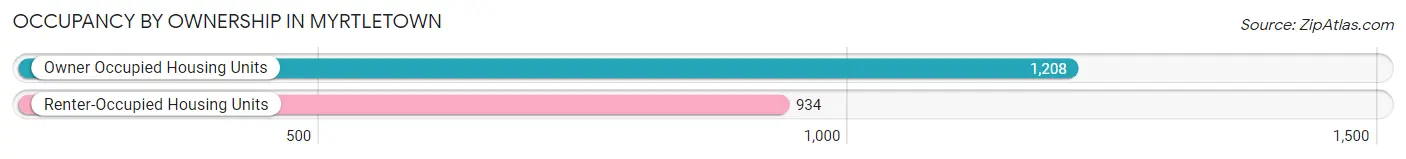
| Occupancy | # Housing Units | % Housing Units |
| Owner Occupied Housing Units | 1,208 | 56.4% |
| Renter-Occupied Housing Units | 934 | 43.6% |
| Total Occupied Housing Units | 2,142 | 100.0% |
Occupancy by Household Size in Myrtletown
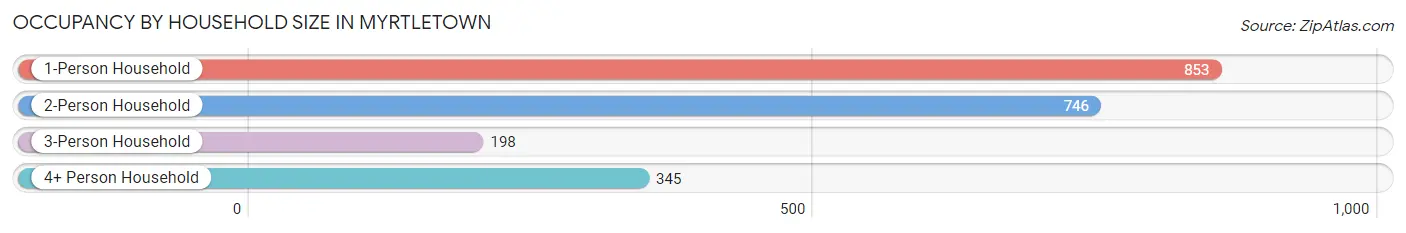
| Household Size | # Housing Units | % Housing Units |
| 1-Person Household | 853 | 39.8% |
| 2-Person Household | 746 | 34.8% |
| 3-Person Household | 198 | 9.2% |
| 4+ Person Household | 345 | 16.1% |
| Total Housing Units | 2,142 | 100.0% |
Occupancy by Ownership by Household Size in Myrtletown
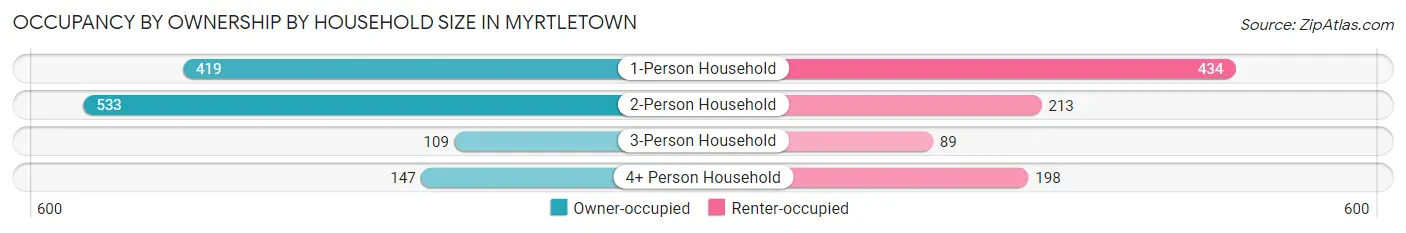
| Household Size | Owner-occupied | Renter-occupied |
| 1-Person Household | 419 (49.1%) | 434 (50.9%) |
| 2-Person Household | 533 (71.5%) | 213 (28.5%) |
| 3-Person Household | 109 (55.0%) | 89 (45.0%) |
| 4+ Person Household | 147 (42.6%) | 198 (57.4%) |
| Total Housing Units | 1,208 (56.4%) | 934 (43.6%) |
Occupancy by Educational Attainment in Myrtletown
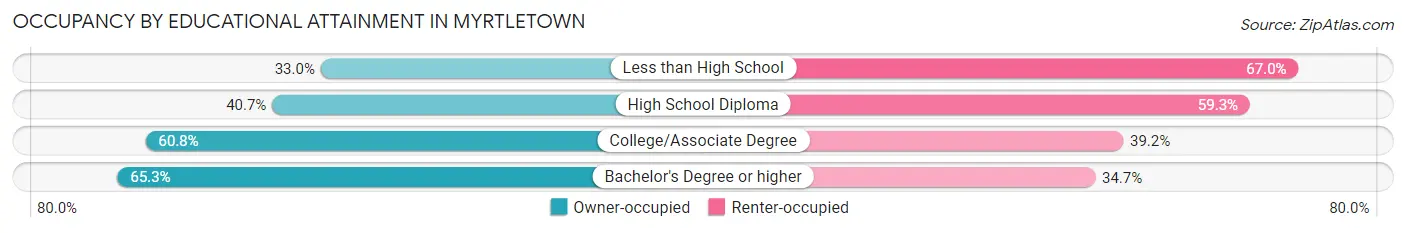
| Household Size | Owner-occupied | Renter-occupied |
| Less than High School | 73 (33.0%) | 148 (67.0%) |
| High School Diploma | 145 (40.7%) | 211 (59.3%) |
| College/Associate Degree | 435 (60.8%) | 280 (39.2%) |
| Bachelor's Degree or higher | 555 (65.3%) | 295 (34.7%) |
Occupancy by Age of Householder in Myrtletown
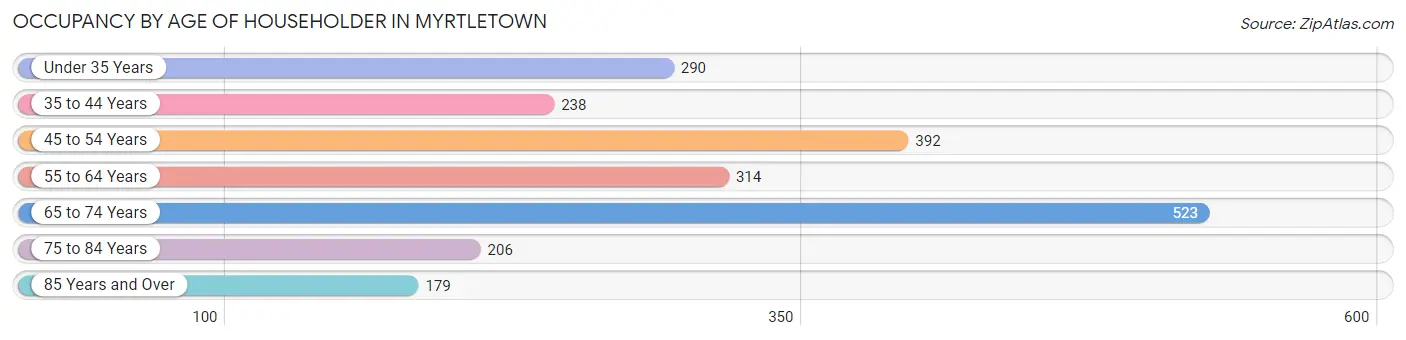
| Age Bracket | # Households | % Households |
| Under 35 Years | 290 | 13.5% |
| 35 to 44 Years | 238 | 11.1% |
| 45 to 54 Years | 392 | 18.3% |
| 55 to 64 Years | 314 | 14.7% |
| 65 to 74 Years | 523 | 24.4% |
| 75 to 84 Years | 206 | 9.6% |
| 85 Years and Over | 179 | 8.4% |
| Total | 2,142 | 100.0% |
Housing Finances in Myrtletown
Median Income by Occupancy in Myrtletown
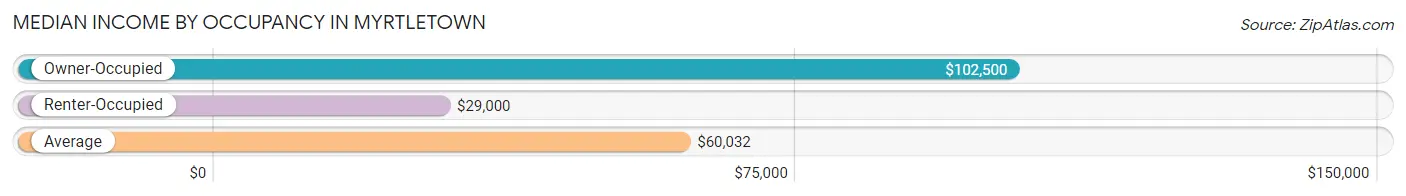
| Occupancy Type | # Households | Median Income |
| Owner-Occupied | 1,208 (56.4%) | $102,500 |
| Renter-Occupied | 934 (43.6%) | $29,000 |
| Average | 2,142 (100.0%) | $60,032 |
Occupancy by Householder Income Bracket in Myrtletown
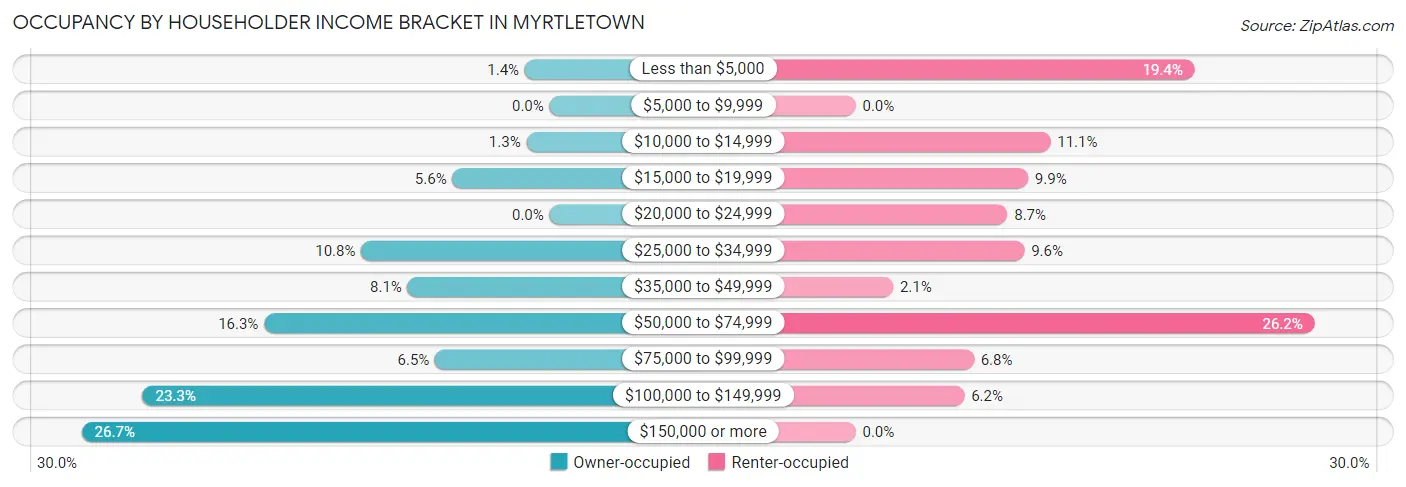
| Income Bracket | Owner-occupied | Renter-occupied |
| Less than $5,000 | 17 (1.4%) | 181 (19.4%) |
| $5,000 to $9,999 | 0 (0.0%) | 0 (0.0%) |
| $10,000 to $14,999 | 16 (1.3%) | 104 (11.1%) |
| $15,000 to $19,999 | 67 (5.6%) | 92 (9.9%) |
| $20,000 to $24,999 | 0 (0.0%) | 81 (8.7%) |
| $25,000 to $34,999 | 130 (10.8%) | 90 (9.6%) |
| $35,000 to $49,999 | 98 (8.1%) | 20 (2.1%) |
| $50,000 to $74,999 | 197 (16.3%) | 245 (26.2%) |
| $75,000 to $99,999 | 79 (6.5%) | 63 (6.8%) |
| $100,000 to $149,999 | 281 (23.3%) | 58 (6.2%) |
| $150,000 or more | 323 (26.7%) | 0 (0.0%) |
| Total | 1,208 (100.0%) | 934 (100.0%) |
Monthly Housing Cost Tiers in Myrtletown
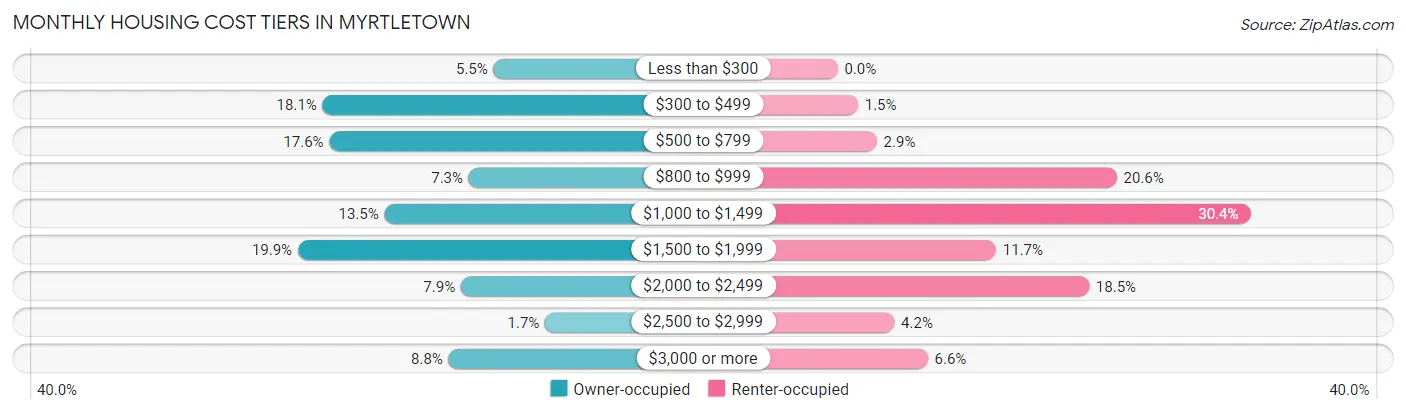
| Monthly Cost | Owner-occupied | Renter-occupied |
| Less than $300 | 66 (5.5%) | 0 (0.0%) |
| $300 to $499 | 218 (18.0%) | 14 (1.5%) |
| $500 to $799 | 212 (17.5%) | 27 (2.9%) |
| $800 to $999 | 88 (7.3%) | 192 (20.6%) |
| $1,000 to $1,499 | 163 (13.5%) | 284 (30.4%) |
| $1,500 to $1,999 | 240 (19.9%) | 109 (11.7%) |
| $2,000 to $2,499 | 95 (7.9%) | 173 (18.5%) |
| $2,500 to $2,999 | 20 (1.7%) | 39 (4.2%) |
| $3,000 or more | 106 (8.8%) | 62 (6.6%) |
| Total | 1,208 (100.0%) | 934 (100.0%) |
Physical Housing Characteristics in Myrtletown
Housing Structures in Myrtletown
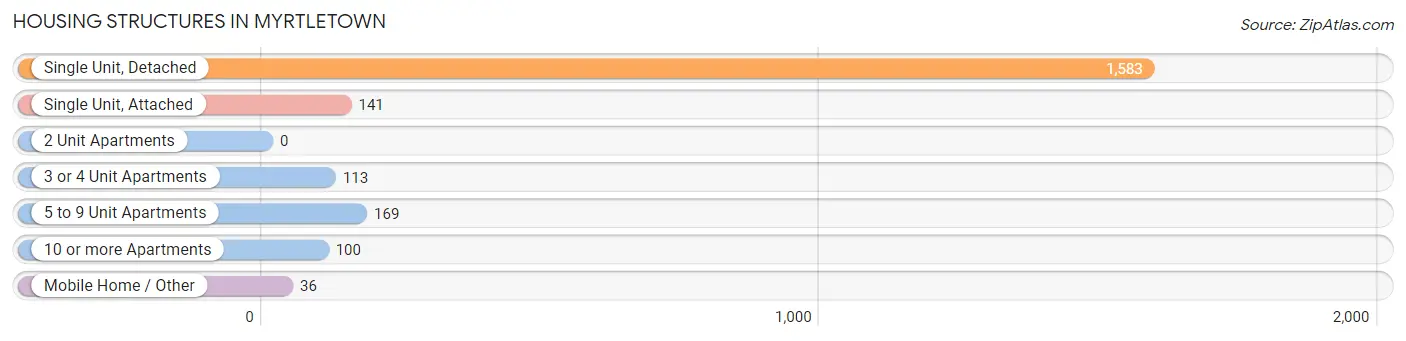
| Structure Type | # Housing Units | % Housing Units |
| Single Unit, Detached | 1,583 | 73.9% |
| Single Unit, Attached | 141 | 6.6% |
| 2 Unit Apartments | 0 | 0.0% |
| 3 or 4 Unit Apartments | 113 | 5.3% |
| 5 to 9 Unit Apartments | 169 | 7.9% |
| 10 or more Apartments | 100 | 4.7% |
| Mobile Home / Other | 36 | 1.7% |
| Total | 2,142 | 100.0% |
Housing Structures by Occupancy in Myrtletown
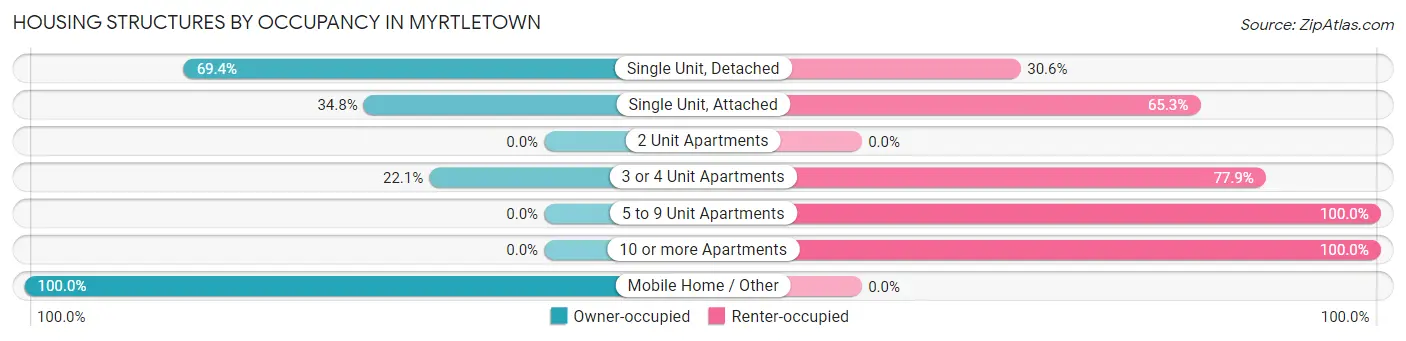
| Structure Type | Owner-occupied | Renter-occupied |
| Single Unit, Detached | 1,098 (69.4%) | 485 (30.6%) |
| Single Unit, Attached | 49 (34.7%) | 92 (65.2%) |
| 2 Unit Apartments | 0 (0.0%) | 0 (0.0%) |
| 3 or 4 Unit Apartments | 25 (22.1%) | 88 (77.9%) |
| 5 to 9 Unit Apartments | 0 (0.0%) | 169 (100.0%) |
| 10 or more Apartments | 0 (0.0%) | 100 (100.0%) |
| Mobile Home / Other | 36 (100.0%) | 0 (0.0%) |
| Total | 1,208 (56.4%) | 934 (43.6%) |
Housing Structures by Number of Rooms in Myrtletown
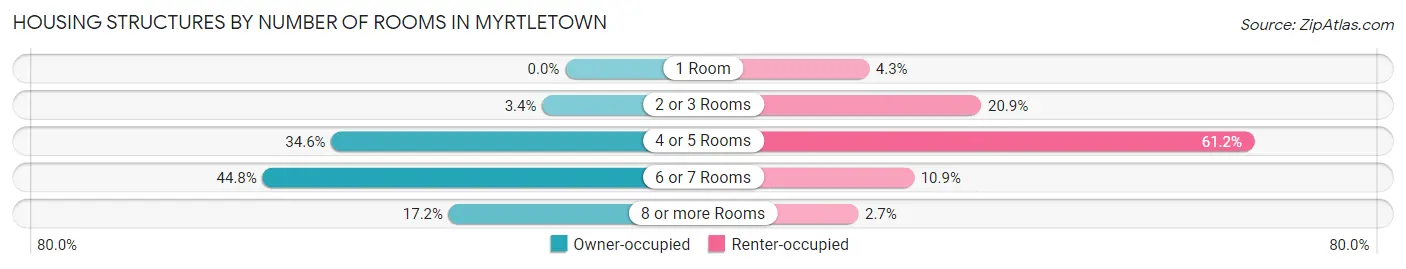
| Number of Rooms | Owner-occupied | Renter-occupied |
| 1 Room | 0 (0.0%) | 40 (4.3%) |
| 2 or 3 Rooms | 41 (3.4%) | 195 (20.9%) |
| 4 or 5 Rooms | 418 (34.6%) | 572 (61.2%) |
| 6 or 7 Rooms | 541 (44.8%) | 102 (10.9%) |
| 8 or more Rooms | 208 (17.2%) | 25 (2.7%) |
| Total | 1,208 (100.0%) | 934 (100.0%) |
Housing Structure by Heating Type in Myrtletown
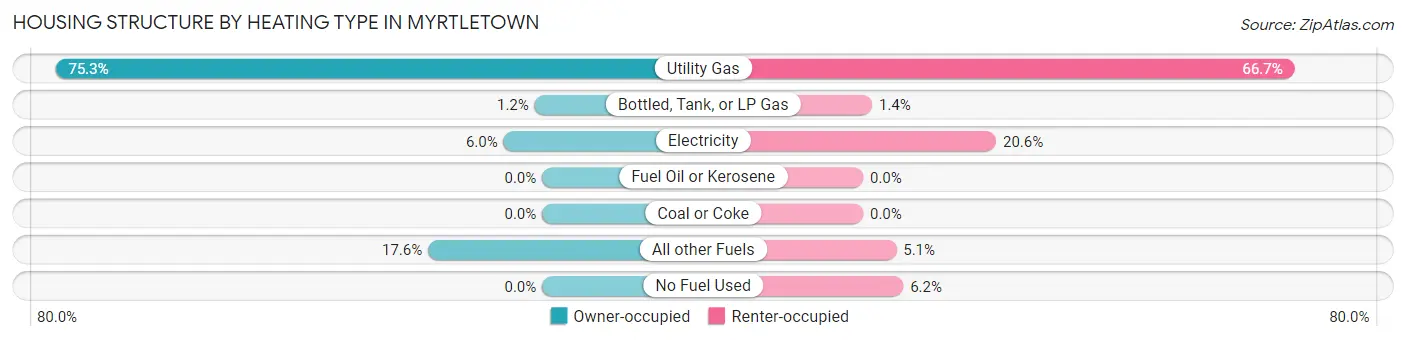
| Heating Type | Owner-occupied | Renter-occupied |
| Utility Gas | 909 (75.2%) | 623 (66.7%) |
| Bottled, Tank, or LP Gas | 14 (1.2%) | 13 (1.4%) |
| Electricity | 72 (6.0%) | 192 (20.6%) |
| Fuel Oil or Kerosene | 0 (0.0%) | 0 (0.0%) |
| Coal or Coke | 0 (0.0%) | 0 (0.0%) |
| All other Fuels | 213 (17.6%) | 48 (5.1%) |
| No Fuel Used | 0 (0.0%) | 58 (6.2%) |
| Total | 1,208 (100.0%) | 934 (100.0%) |
Household Vehicle Usage in Myrtletown
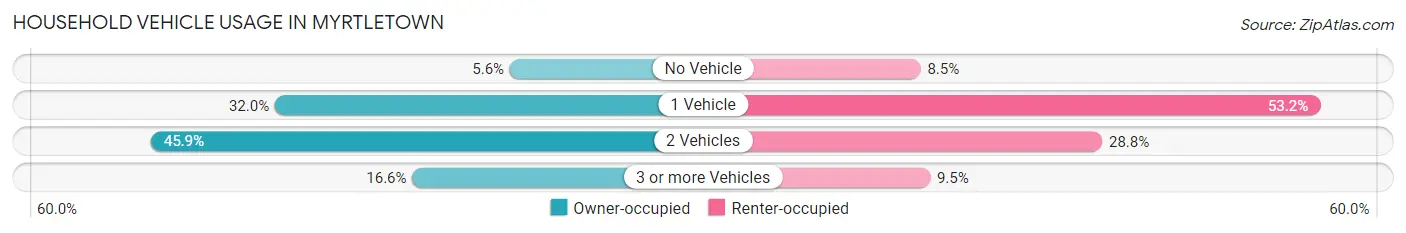
| Vehicles per Household | Owner-occupied | Renter-occupied |
| No Vehicle | 68 (5.6%) | 79 (8.5%) |
| 1 Vehicle | 386 (32.0%) | 497 (53.2%) |
| 2 Vehicles | 554 (45.9%) | 269 (28.8%) |
| 3 or more Vehicles | 200 (16.6%) | 89 (9.5%) |
| Total | 1,208 (100.0%) | 934 (100.0%) |
Real Estate & Mortgages in Myrtletown
Real Estate and Mortgage Overview in Myrtletown
| Characteristic | Without Mortgage | With Mortgage |
| Housing Units | 630 | 578 |
| Median Property Value | $364,600 | $430,500 |
| Median Household Income | $84,500 | $174 |
| Monthly Housing Costs | $534 | $90 |
| Real Estate Taxes | $2,070 | $0 |
Property Value by Mortgage Status in Myrtletown
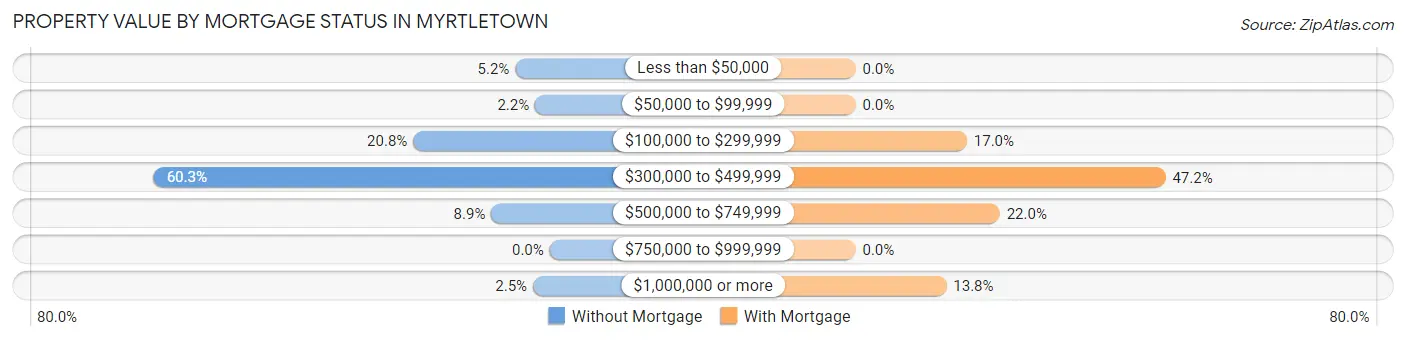
| Property Value | Without Mortgage | With Mortgage |
| Less than $50,000 | 33 (5.2%) | 0 (0.0%) |
| $50,000 to $99,999 | 14 (2.2%) | 0 (0.0%) |
| $100,000 to $299,999 | 131 (20.8%) | 98 (17.0%) |
| $300,000 to $499,999 | 380 (60.3%) | 273 (47.2%) |
| $500,000 to $749,999 | 56 (8.9%) | 127 (22.0%) |
| $750,000 to $999,999 | 0 (0.0%) | 0 (0.0%) |
| $1,000,000 or more | 16 (2.5%) | 80 (13.8%) |
| Total | 630 (100.0%) | 578 (100.0%) |
Household Income by Mortgage Status in Myrtletown
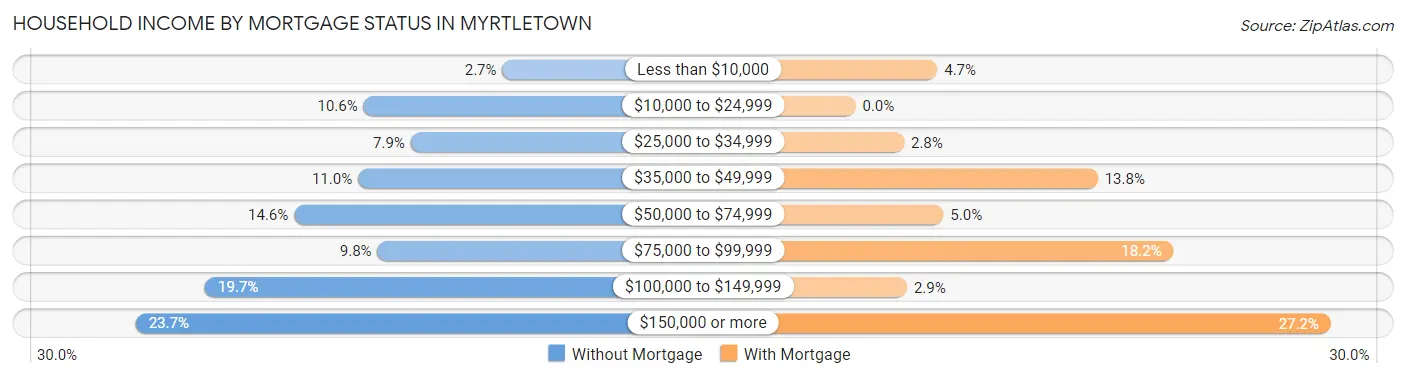
| Household Income | Without Mortgage | With Mortgage |
| Less than $10,000 | 17 (2.7%) | 27 (4.7%) |
| $10,000 to $24,999 | 67 (10.6%) | 0 (0.0%) |
| $25,000 to $34,999 | 50 (7.9%) | 16 (2.8%) |
| $35,000 to $49,999 | 69 (11.0%) | 80 (13.8%) |
| $50,000 to $74,999 | 92 (14.6%) | 29 (5.0%) |
| $75,000 to $99,999 | 62 (9.8%) | 105 (18.2%) |
| $100,000 to $149,999 | 124 (19.7%) | 17 (2.9%) |
| $150,000 or more | 149 (23.6%) | 157 (27.2%) |
| Total | 630 (100.0%) | 578 (100.0%) |
Property Value to Household Income Ratio in Myrtletown
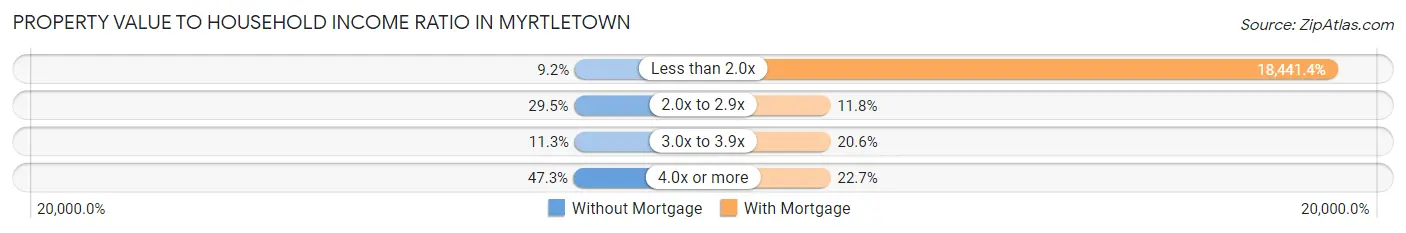
| Value-to-Income Ratio | Without Mortgage | With Mortgage |
| Less than 2.0x | 58 (9.2%) | 106,591 (18,441.3%) |
| 2.0x to 2.9x | 186 (29.5%) | 68 (11.8%) |
| 3.0x to 3.9x | 71 (11.3%) | 119 (20.6%) |
| 4.0x or more | 298 (47.3%) | 131 (22.7%) |
| Total | 630 (100.0%) | 578 (100.0%) |
Real Estate Taxes by Mortgage Status in Myrtletown
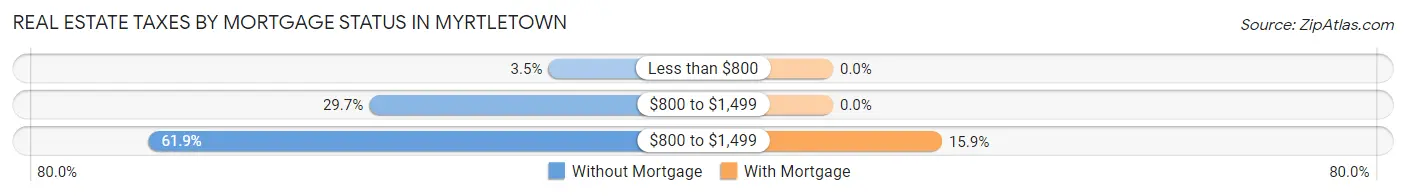
| Property Taxes | Without Mortgage | With Mortgage |
| Less than $800 | 22 (3.5%) | 0 (0.0%) |
| $800 to $1,499 | 187 (29.7%) | 0 (0.0%) |
| $800 to $1,499 | 390 (61.9%) | 92 (15.9%) |
| Total | 630 (100.0%) | 578 (100.0%) |
Health & Disability in Myrtletown
Health Insurance Coverage by Age in Myrtletown
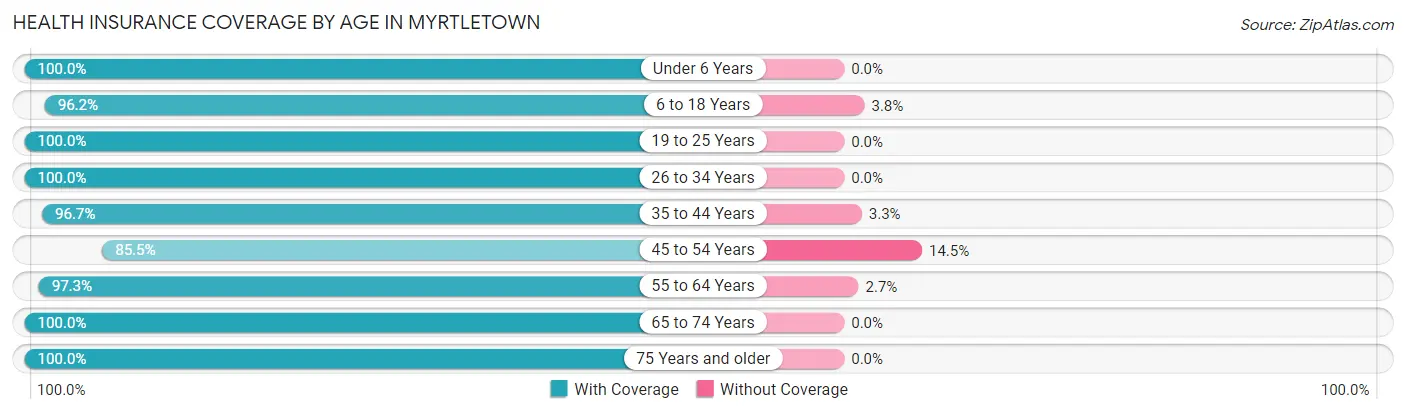
| Age Bracket | With Coverage | Without Coverage |
| Under 6 Years | 345 (100.0%) | 0 (0.0%) |
| 6 to 18 Years | 560 (96.2%) | 22 (3.8%) |
| 19 to 25 Years | 126 (100.0%) | 0 (0.0%) |
| 26 to 34 Years | 558 (100.0%) | 0 (0.0%) |
| 35 to 44 Years | 591 (96.7%) | 20 (3.3%) |
| 45 to 54 Years | 613 (85.5%) | 104 (14.5%) |
| 55 to 64 Years | 732 (97.3%) | 20 (2.7%) |
| 65 to 74 Years | 649 (100.0%) | 0 (0.0%) |
| 75 Years and older | 512 (100.0%) | 0 (0.0%) |
| Total | 4,686 (96.6%) | 166 (3.4%) |
Health Insurance Coverage by Citizenship Status in Myrtletown
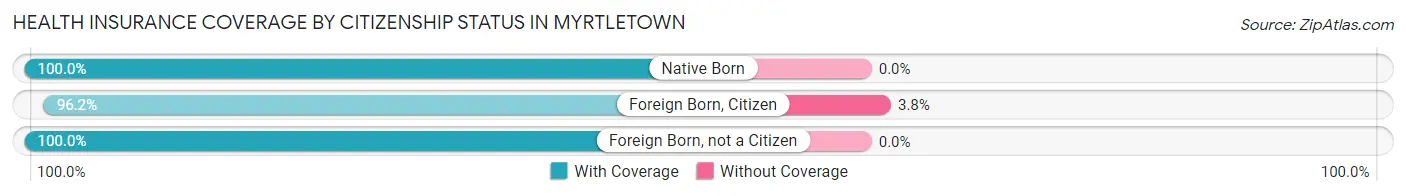
| Citizenship Status | With Coverage | Without Coverage |
| Native Born | 345 (100.0%) | 0 (0.0%) |
| Foreign Born, Citizen | 560 (96.2%) | 22 (3.8%) |
| Foreign Born, not a Citizen | 126 (100.0%) | 0 (0.0%) |
Health Insurance Coverage by Household Income in Myrtletown
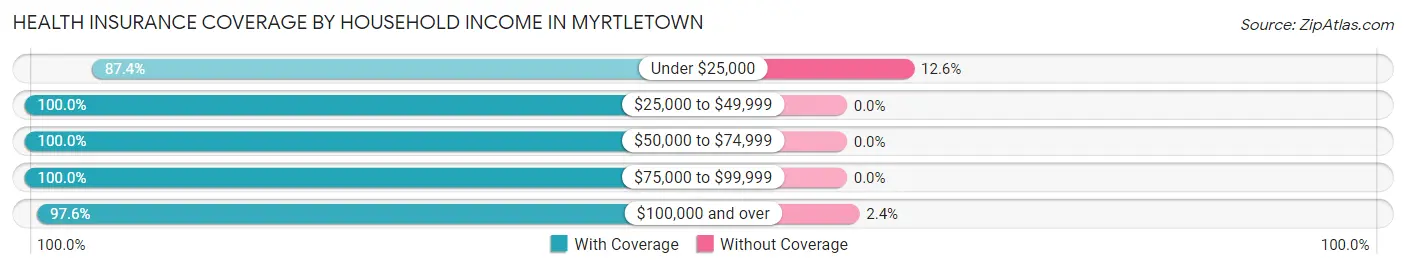
| Household Income | With Coverage | Without Coverage |
| Under $25,000 | 859 (87.4%) | 124 (12.6%) |
| $25,000 to $49,999 | 602 (100.0%) | 0 (0.0%) |
| $50,000 to $74,999 | 967 (100.0%) | 0 (0.0%) |
| $75,000 to $99,999 | 309 (100.0%) | 0 (0.0%) |
| $100,000 and over | 1,734 (97.6%) | 42 (2.4%) |
Public vs Private Health Insurance Coverage by Age in Myrtletown
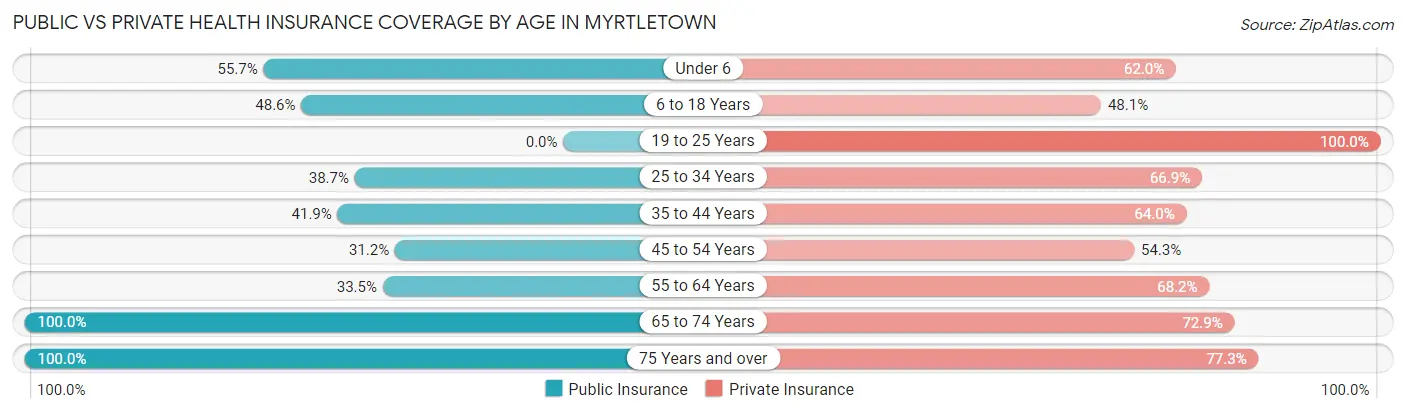
| Age Bracket | Public Insurance | Private Insurance |
| Under 6 | 192 (55.6%) | 214 (62.0%) |
| 6 to 18 Years | 283 (48.6%) | 280 (48.1%) |
| 19 to 25 Years | 0 (0.0%) | 126 (100.0%) |
| 25 to 34 Years | 216 (38.7%) | 373 (66.8%) |
| 35 to 44 Years | 256 (41.9%) | 391 (64.0%) |
| 45 to 54 Years | 224 (31.2%) | 389 (54.2%) |
| 55 to 64 Years | 252 (33.5%) | 513 (68.2%) |
| 65 to 74 Years | 649 (100.0%) | 473 (72.9%) |
| 75 Years and over | 512 (100.0%) | 396 (77.3%) |
| Total | 2,584 (53.3%) | 3,155 (65.0%) |
Disability Status by Sex by Age in Myrtletown
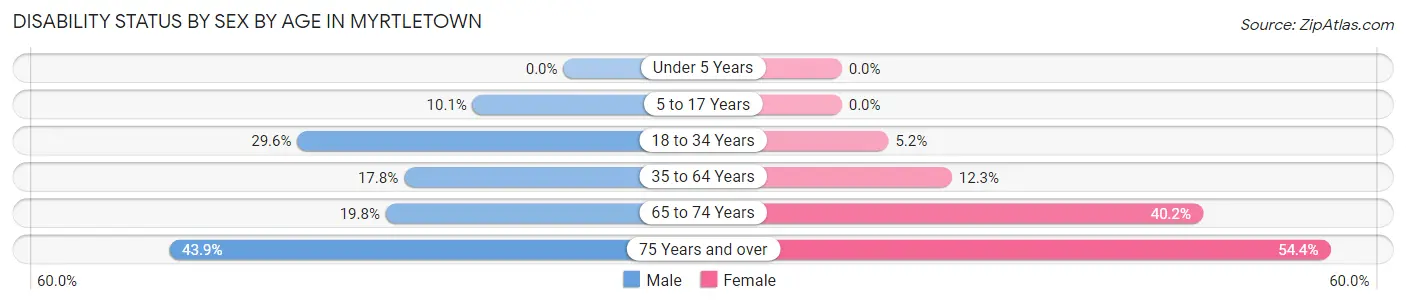
| Age Bracket | Male | Female |
| Under 5 Years | 0 (0.0%) | 0 (0.0%) |
| 5 to 17 Years | 39 (10.1%) | 0 (0.0%) |
| 18 to 34 Years | 80 (29.6%) | 22 (5.2%) |
| 35 to 64 Years | 178 (17.7%) | 132 (12.3%) |
| 65 to 74 Years | 88 (19.8%) | 82 (40.2%) |
| 75 Years and over | 90 (43.9%) | 167 (54.4%) |
Disability Class by Sex by Age in Myrtletown
Disability Class: Hearing Difficulty
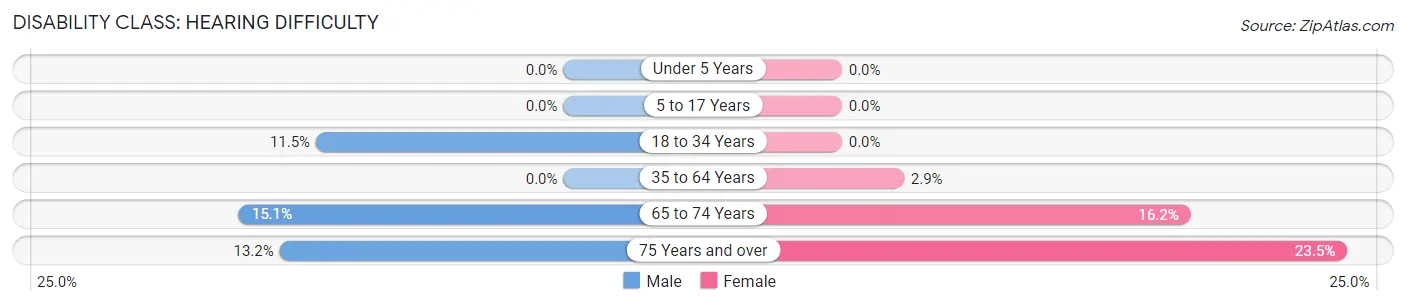
| Age Bracket | Male | Female |
| Under 5 Years | 0 (0.0%) | 0 (0.0%) |
| 5 to 17 Years | 0 (0.0%) | 0 (0.0%) |
| 18 to 34 Years | 31 (11.5%) | 0 (0.0%) |
| 35 to 64 Years | 0 (0.0%) | 31 (2.9%) |
| 65 to 74 Years | 67 (15.1%) | 33 (16.2%) |
| 75 Years and over | 27 (13.2%) | 72 (23.4%) |
Disability Class: Vision Difficulty
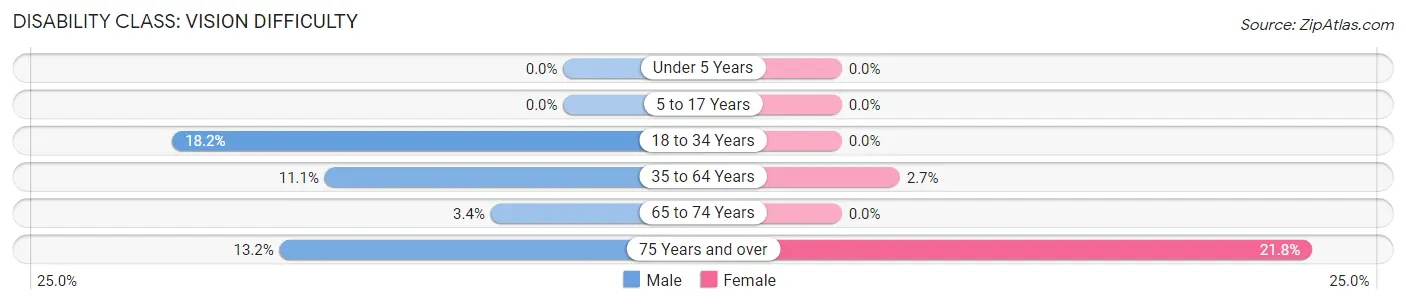
| Age Bracket | Male | Female |
| Under 5 Years | 0 (0.0%) | 0 (0.0%) |
| 5 to 17 Years | 0 (0.0%) | 0 (0.0%) |
| 18 to 34 Years | 49 (18.1%) | 0 (0.0%) |
| 35 to 64 Years | 111 (11.1%) | 29 (2.7%) |
| 65 to 74 Years | 15 (3.4%) | 0 (0.0%) |
| 75 Years and over | 27 (13.2%) | 67 (21.8%) |
Disability Class: Cognitive Difficulty
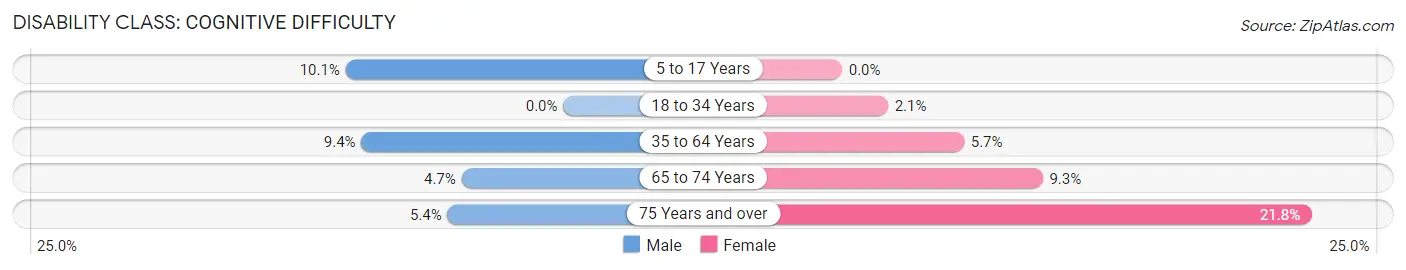
| Age Bracket | Male | Female |
| 5 to 17 Years | 39 (10.1%) | 0 (0.0%) |
| 18 to 34 Years | 0 (0.0%) | 9 (2.1%) |
| 35 to 64 Years | 94 (9.4%) | 61 (5.7%) |
| 65 to 74 Years | 21 (4.7%) | 19 (9.3%) |
| 75 Years and over | 11 (5.4%) | 67 (21.8%) |
Disability Class: Ambulatory Difficulty
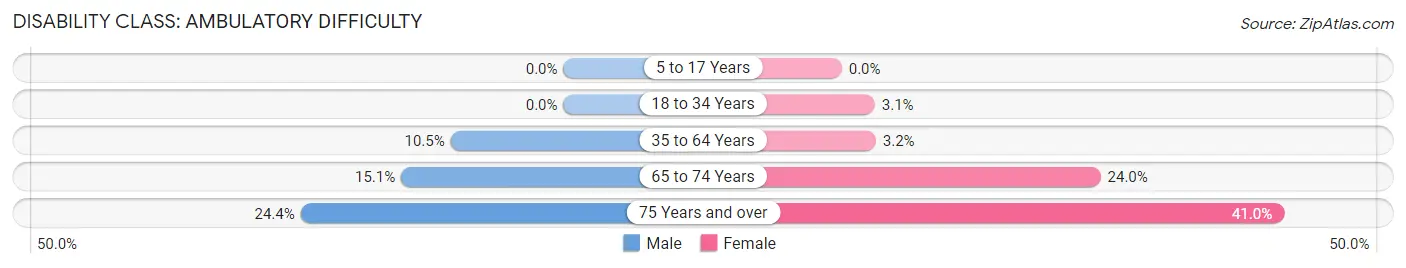
| Age Bracket | Male | Female |
| 5 to 17 Years | 0 (0.0%) | 0 (0.0%) |
| 18 to 34 Years | 0 (0.0%) | 13 (3.1%) |
| 35 to 64 Years | 105 (10.5%) | 34 (3.2%) |
| 65 to 74 Years | 67 (15.1%) | 49 (24.0%) |
| 75 Years and over | 50 (24.4%) | 126 (41.0%) |
Disability Class: Self-Care Difficulty
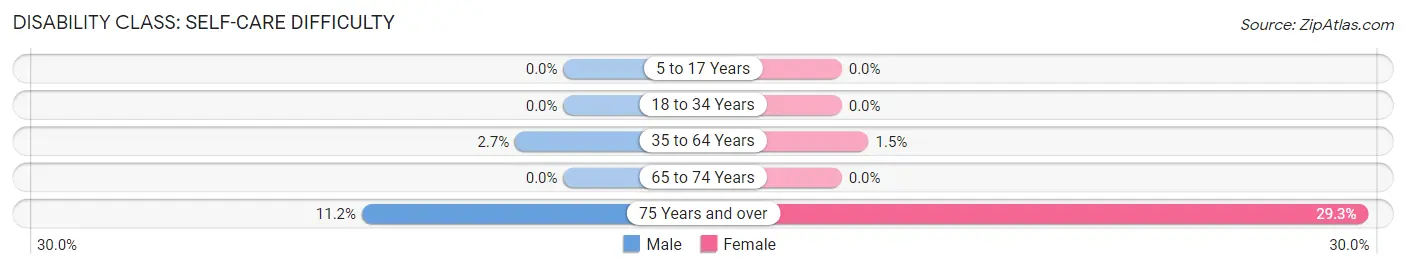
| Age Bracket | Male | Female |
| 5 to 17 Years | 0 (0.0%) | 0 (0.0%) |
| 18 to 34 Years | 0 (0.0%) | 0 (0.0%) |
| 35 to 64 Years | 27 (2.7%) | 16 (1.5%) |
| 65 to 74 Years | 0 (0.0%) | 0 (0.0%) |
| 75 Years and over | 23 (11.2%) | 90 (29.3%) |
Technology Access in Myrtletown
Computing Device Access in Myrtletown
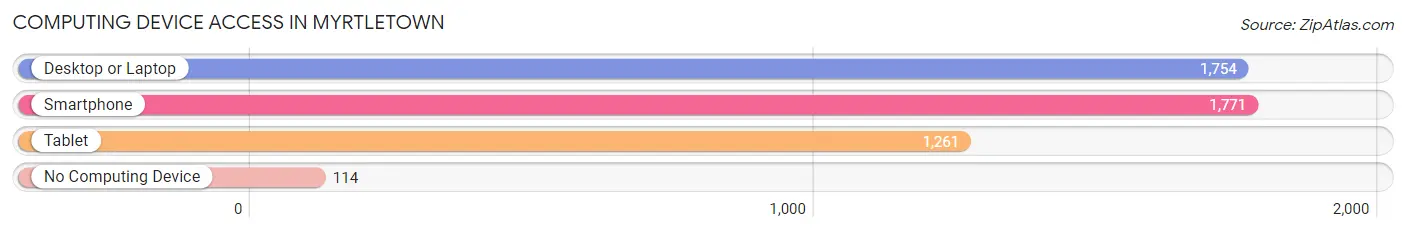
| Device Type | # Households | % Households |
| Desktop or Laptop | 1,754 | 81.9% |
| Smartphone | 1,771 | 82.7% |
| Tablet | 1,261 | 58.9% |
| No Computing Device | 114 | 5.3% |
| Total | 2,142 | 100.0% |
Internet Access in Myrtletown
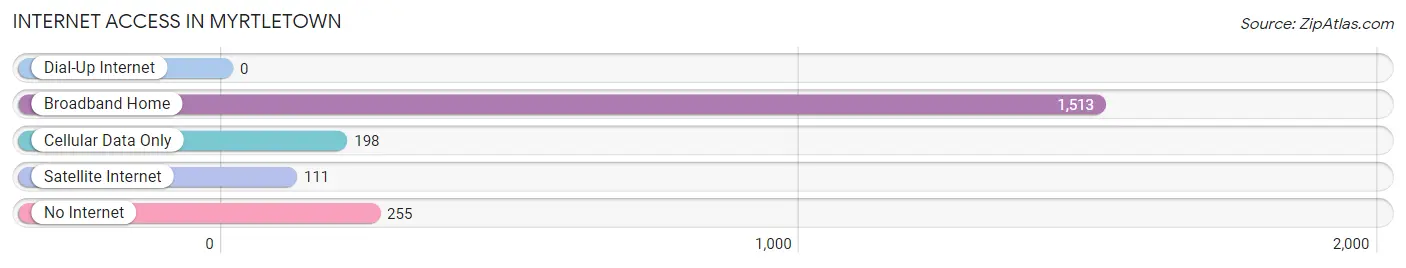
| Internet Type | # Households | % Households |
| Dial-Up Internet | 0 | 0.0% |
| Broadband Home | 1,513 | 70.6% |
| Cellular Data Only | 198 | 9.2% |
| Satellite Internet | 111 | 5.2% |
| No Internet | 255 | 11.9% |
| Total | 2,142 | 100.0% |
Myrtletown Summary
Myrtletown is a small unincorporated community located in Humboldt County, California. It is situated on the banks of the Eel River, approximately 10 miles south of Eureka. The town is home to a population of approximately 1,000 people, and is known for its rural charm and small-town atmosphere.
History
Myrtletown was founded in 1853 by a group of settlers from the Midwest. The town was named after the myrtle trees that grew in abundance in the area. The settlers were attracted to the area due to its abundance of natural resources, including timber, fish, and game.
The town quickly grew and prospered, and by the late 1800s, it had become a bustling center of commerce and industry. The town was home to several sawmills, a brickyard, a tannery, and a cannery. The town also had a thriving agricultural sector, with dairy farms, orchards, and vegetable gardens.
In the early 1900s, the town began to decline as the timber industry moved away and the population began to dwindle. The town was further impacted by the Great Depression, and by the 1950s, the population had dropped to just over 500 people.
Geography
Myrtletown is located in the Eel River Valley, approximately 10 miles south of Eureka. The town is situated on the banks of the Eel River, and is surrounded by rolling hills and lush forests. The climate in the area is mild, with temperatures rarely dropping below freezing in the winter months.
The town is located in the heart of Humboldt County, and is close to several popular attractions, including the Redwood National and State Parks, the Lost Coast, and the Avenue of the Giants.
Economy
Myrtletown’s economy is largely based on tourism and agriculture. The town is home to several small businesses, including restaurants, shops, and galleries. The town is also home to several wineries, and is a popular destination for wine tasting.
The town is also home to several farms, which produce a variety of fruits and vegetables, including apples, pears, and berries. The town is also home to several dairy farms, which produce milk, cheese, and other dairy products.
Demographics
As of the 2010 census, the population of Myrtletown was 1,000 people. The town is predominantly white, with approximately 90% of the population identifying as Caucasian. The town is also home to a small Hispanic population, with approximately 5% of the population identifying as Hispanic or Latino.
The median household income in Myrtletown is $45,000, and the median home value is $200,000. The town has a low unemployment rate, and the majority of the population is employed in the tourism and agriculture industries.
Conclusion
Myrtletown is a small unincorporated community located in Humboldt County, California. The town was founded in 1853 by a group of settlers from the Midwest, and is known for its rural charm and small-town atmosphere. The town’s economy is largely based on tourism and agriculture, and the population is predominantly white. The town is home to several small businesses, farms, and wineries, and is a popular destination for wine tasting.
Common Questions
What is Per Capita Income in Myrtletown?
Per Capita income in Myrtletown is $40,555.
What is the Median Family Income in Myrtletown?
Median Family Income in Myrtletown is $106,313.
What is the Median Household income in Myrtletown?
Median Household Income in Myrtletown is $60,032.
What is Income or Wage Gap in Myrtletown?
Income or Wage Gap in Myrtletown is 16.4%.
Women in Myrtletown earn 83.6 cents for every dollar earned by a man.
What is Inequality or Gini Index in Myrtletown?
Inequality or Gini Index in Myrtletown is 0.54.
What is the Total Population of Myrtletown?
Total Population of Myrtletown is 4,946.
What is the Total Male Population of Myrtletown?
Total Male Population of Myrtletown is 2,477.
What is the Total Female Population of Myrtletown?
Total Female Population of Myrtletown is 2,469.
What is the Ratio of Males per 100 Females in Myrtletown?
There are 100.32 Males per 100 Females in Myrtletown.
What is the Ratio of Females per 100 Males in Myrtletown?
There are 99.68 Females per 100 Males in Myrtletown.
What is the Median Population Age in Myrtletown?
Median Population Age in Myrtletown is 48.1 Years.
What is the Average Family Size in Myrtletown
Average Family Size in Myrtletown is 2.9 People.
What is the Average Household Size in Myrtletown
Average Household Size in Myrtletown is 2.2 People.
How Large is the Labor Force in Myrtletown?
There are 2,058 People in the Labor Forcein in Myrtletown.
What is the Percentage of People in the Labor Force in Myrtletown?
49.8% of People are in the Labor Force in Myrtletown.
What is the Unemployment Rate in Myrtletown?
Unemployment Rate in Myrtletown is 7.5%.