Cities with the Highest Percentage of Population Employed in Real Estate, Rental & Leasing in Vermont
RELATED REPORTS & OPTIONS
Real Estate, Rental & Leasing
Vermont
Compare Cities
Map of Cities with the Highest Percentage of Population Employed in Real Estate, Rental & Leasing in Vermont
0.0%
30.0%
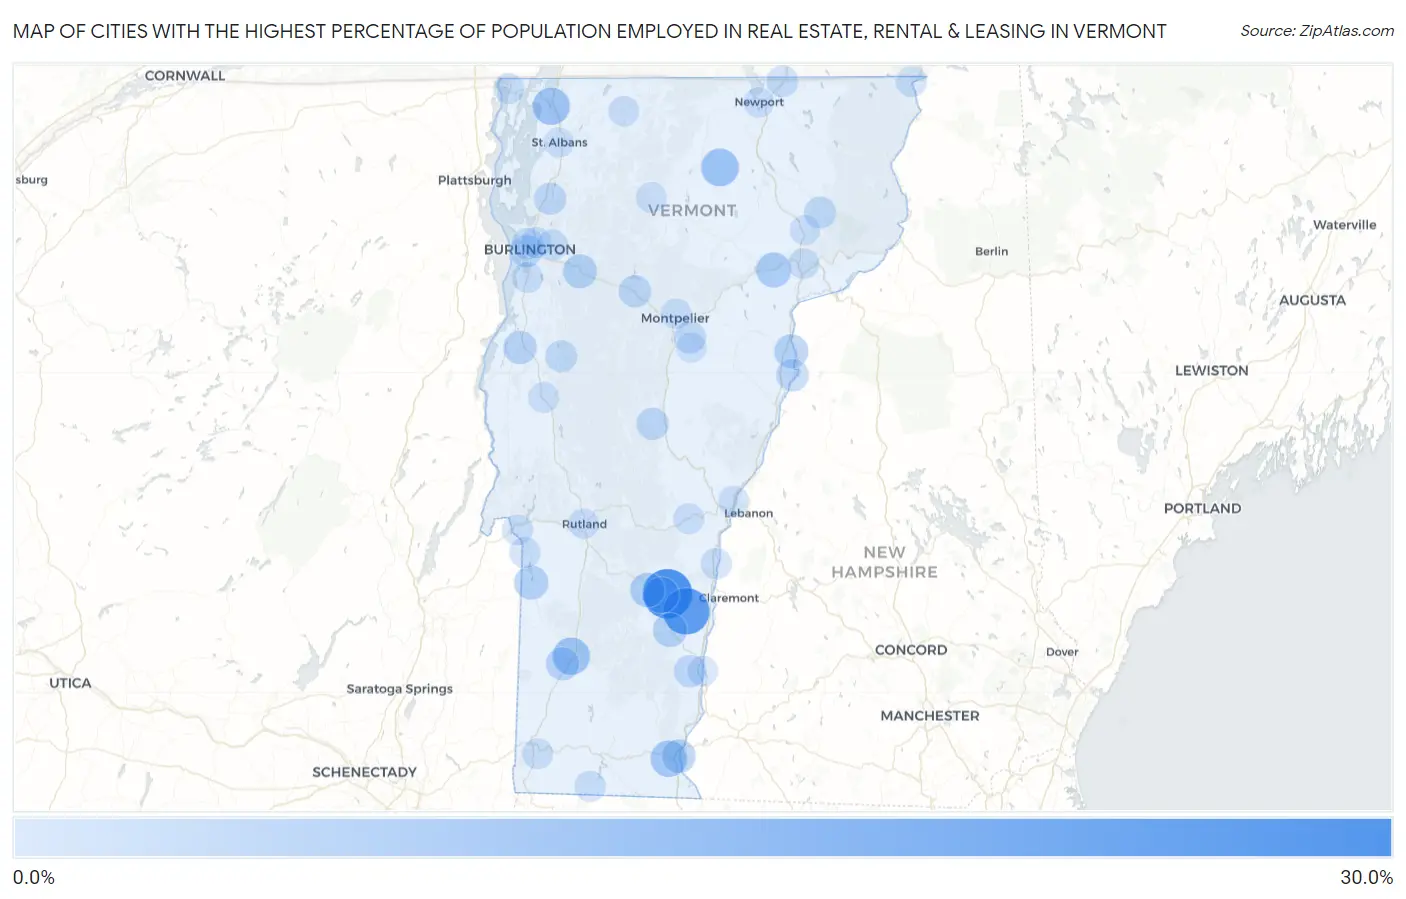
Cities with the Highest Percentage of Population Employed in Real Estate, Rental & Leasing in Vermont
| City | % Employed | vs State | vs National | |
| 1. | Cavendish | 27.3% | 1.6%(+25.7)#1 | 1.9%(+25.4)#83 |
| 2. | North Springfield | 23.0% | 1.6%(+21.4)#2 | 1.9%(+21.1)#121 |
| 3. | Pownal | 22.9% | 1.6%(+21.3)#3 | 1.9%(+21.0)#123 |
| 4. | Peacham | 19.0% | 1.6%(+17.5)#4 | 1.9%(+17.2)#160 |
| 5. | Highgate Center | 16.3% | 1.6%(+14.7)#5 | 1.9%(+14.4)#212 |
| 6. | North Clarendon | 15.2% | 1.6%(+13.6)#6 | 1.9%(+13.3)#240 |
| 7. | Wardsboro | 14.9% | 1.6%(+13.3)#7 | 1.9%(+13.0)#253 |
| 8. | Albany | 10.2% | 1.6%(+8.61)#8 | 1.9%(+8.31)#512 |
| 9. | Wolcott | 10.0% | 1.6%(+8.41)#9 | 1.9%(+8.11)#534 |
| 10. | Manchester Center | 9.8% | 1.6%(+8.22)#10 | 1.9%(+7.92)#556 |
| 11. | South Londonderry | 9.7% | 1.6%(+8.09)#11 | 1.9%(+7.79)#572 |
| 12. | Swanton | 9.6% | 1.6%(+8.05)#12 | 1.9%(+7.75)#575 |
| 13. | West Brattleboro | 8.5% | 1.6%(+6.91)#13 | 1.9%(+6.61)#722 |
| 14. | Danby | 8.1% | 1.6%(+6.49)#14 | 1.9%(+6.19)#811 |
| 15. | Proctorsville | 7.8% | 1.6%(+6.17)#15 | 1.9%(+5.88)#867 |
| 16. | Danville | 6.6% | 1.6%(+5.05)#16 | 1.9%(+4.75)#1,137 |
| 17. | Killington | 6.6% | 1.6%(+4.97)#17 | 1.9%(+4.67)#1,166 |
| 18. | Ludlow | 6.0% | 1.6%(+4.41)#18 | 1.9%(+4.11)#1,370 |
| 19. | Wells | 5.4% | 1.6%(+3.76)#19 | 1.9%(+3.47)#1,664 |
| 20. | Chester | 5.3% | 1.6%(+3.73)#20 | 1.9%(+3.43)#1,677 |
| 21. | Richmond | 5.2% | 1.6%(+3.60)#21 | 1.9%(+3.30)#1,747 |
| 22. | Wells River | 5.1% | 1.6%(+3.49)#22 | 1.9%(+3.19)#1,816 |
| 23. | Brattleboro | 4.7% | 1.6%(+3.10)#23 | 1.9%(+2.80)#2,067 |
| 24. | Vergennes | 4.4% | 1.6%(+2.78)#24 | 1.9%(+2.48)#2,307 |
| 25. | Manchester | 4.1% | 1.6%(+2.50)#25 | 1.9%(+2.20)#2,564 |
| 26. | Stamford | 3.4% | 1.6%(+1.80)#26 | 1.9%(+1.50)#3,437 |
| 27. | St. George | 3.3% | 1.6%(+1.76)#27 | 1.9%(+1.46)#3,498 |
| 28. | Newbury | 3.2% | 1.6%(+1.65)#28 | 1.9%(+1.35)#3,697 |
| 29. | Waterbury | 3.1% | 1.6%(+1.54)#29 | 1.9%(+1.24)#3,872 |
| 30. | South Burlington | 3.1% | 1.6%(+1.48)#30 | 1.9%(+1.19)#3,968 |
| 31. | Randolph | 3.0% | 1.6%(+1.39)#31 | 1.9%(+1.09)#4,155 |
| 32. | Hartford | 3.0% | 1.6%(+1.37)#32 | 1.9%(+1.07)#4,189 |
| 33. | Milton | 2.7% | 1.6%(+1.14)#33 | 1.9%(+0.845)#4,693 |
| 34. | Saxtons River | 2.7% | 1.6%(+1.12)#34 | 1.9%(+0.819)#4,756 |
| 35. | Barre | 2.6% | 1.6%(+1.03)#35 | 1.9%(+0.730)#5,007 |
| 36. | Bristol | 2.5% | 1.6%(+0.871)#36 | 1.9%(+0.571)#5,438 |
| 37. | East Burke | 2.4% | 1.6%(+0.817)#37 | 1.9%(+0.518)#5,612 |
| 38. | Bolton Valley | 2.3% | 1.6%(+0.663)#38 | 1.9%(+0.364)#6,119 |
| 39. | South Hero | 2.2% | 1.6%(+0.606)#39 | 1.9%(+0.306)#6,326 |
| 40. | Derby Line | 2.1% | 1.6%(+0.470)#40 | 1.9%(+0.170)#6,806 |
| 41. | Burlington | 1.8% | 1.6%(+0.222)#41 | 1.9%(-0.078)#7,792 |
| 42. | Huntington | 1.7% | 1.6%(+0.150)#42 | 1.9%(-0.150)#8,094 |
| 43. | Pownal Center | 1.6% | 1.6%(+0.031)#43 | 1.9%(-0.268)#8,660 |
| 44. | Canaan | 1.4% | 1.6%(-0.203)#44 | 1.9%(-0.503)#9,873 |
| 45. | Proctor | 1.4% | 1.6%(-0.215)#45 | 1.9%(-0.514)#9,922 |
| 46. | Essex Junction | 1.3% | 1.6%(-0.285)#46 | 1.9%(-0.585)#10,278 |
| 47. | Poultney | 1.3% | 1.6%(-0.305)#47 | 1.9%(-0.604)#10,381 |
| 48. | Windsor | 1.2% | 1.6%(-0.386)#48 | 1.9%(-0.686)#10,847 |
| 49. | Fair Haven | 1.1% | 1.6%(-0.523)#49 | 1.9%(-0.823)#11,609 |
| 50. | Readsboro | 1.1% | 1.6%(-0.534)#50 | 1.9%(-0.834)#11,674 |
| 51. | Winooski | 1.0% | 1.6%(-0.545)#51 | 1.9%(-0.844)#11,728 |
| 52. | Underhill Flats | 0.99% | 1.6%(-0.600)#52 | 1.9%(-0.899)#12,031 |
| 53. | Woodstock | 0.99% | 1.6%(-0.600)#53 | 1.9%(-0.900)#12,034 |
| 54. | Shelburne | 0.99% | 1.6%(-0.601)#54 | 1.9%(-0.901)#12,041 |
| 55. | Bennington | 0.97% | 1.6%(-0.622)#55 | 1.9%(-0.921)#12,176 |
| 56. | Alburgh | 0.92% | 1.6%(-0.675)#56 | 1.9%(-0.974)#12,466 |
| 57. | Enosburg Falls | 0.90% | 1.6%(-0.694)#57 | 1.9%(-0.994)#12,569 |
| 58. | Wilder | 0.90% | 1.6%(-0.696)#58 | 1.9%(-0.995)#12,578 |
| 59. | St Johnsbury | 0.88% | 1.6%(-0.711)#59 | 1.9%(-1.01)#12,657 |
| 60. | Middlebury | 0.86% | 1.6%(-0.731)#60 | 1.9%(-1.03)#12,761 |
| 61. | Johnson | 0.71% | 1.6%(-0.882)#61 | 1.9%(-1.18)#13,623 |
| 62. | Bellows Falls | 0.60% | 1.6%(-0.989)#62 | 1.9%(-1.29)#14,209 |
| 63. | Montpelier | 0.60% | 1.6%(-0.992)#63 | 1.9%(-1.29)#14,231 |
| 64. | Rutland | 0.53% | 1.6%(-1.06)#64 | 1.9%(-1.36)#14,602 |
| 65. | Lyndonville | 0.46% | 1.6%(-1.13)#65 | 1.9%(-1.43)#15,027 |
| 66. | Newport | 0.43% | 1.6%(-1.16)#66 | 1.9%(-1.46)#15,140 |
| 67. | South Barre | 0.40% | 1.6%(-1.19)#67 | 1.9%(-1.49)#15,310 |
| 68. | St Albans | 0.18% | 1.6%(-1.41)#68 | 1.9%(-1.71)#16,024 |
1
2Common Questions
What are the Top 10 Cities with the Highest Percentage of Population Employed in Real Estate, Rental & Leasing in Vermont?
Top 10 Cities with the Highest Percentage of Population Employed in Real Estate, Rental & Leasing in Vermont are:
#1
27.3%
#2
23.0%
#3
10.2%
#4
9.8%
#5
9.6%
#6
8.5%
#7
7.8%
#8
6.6%
#9
6.0%
#10
5.4%
What city has the Highest Percentage of Population Employed in Real Estate, Rental & Leasing in Vermont?
Cavendish has the Highest Percentage of Population Employed in Real Estate, Rental & Leasing in Vermont with 27.3%.
What is the Percentage of Population Employed in Real Estate, Rental & Leasing in the State of Vermont?
Percentage of Population Employed in Real Estate, Rental & Leasing in Vermont is 1.6%.
What is the Percentage of Population Employed in Real Estate, Rental & Leasing in the United States?
Percentage of Population Employed in Real Estate, Rental & Leasing in the United States is 1.9%.