Cities with the Highest Percentage of Population Employed in Real Estate, Rental & Leasing in Ohio
RELATED REPORTS & OPTIONS
Real Estate, Rental & Leasing
Ohio
Compare Cities
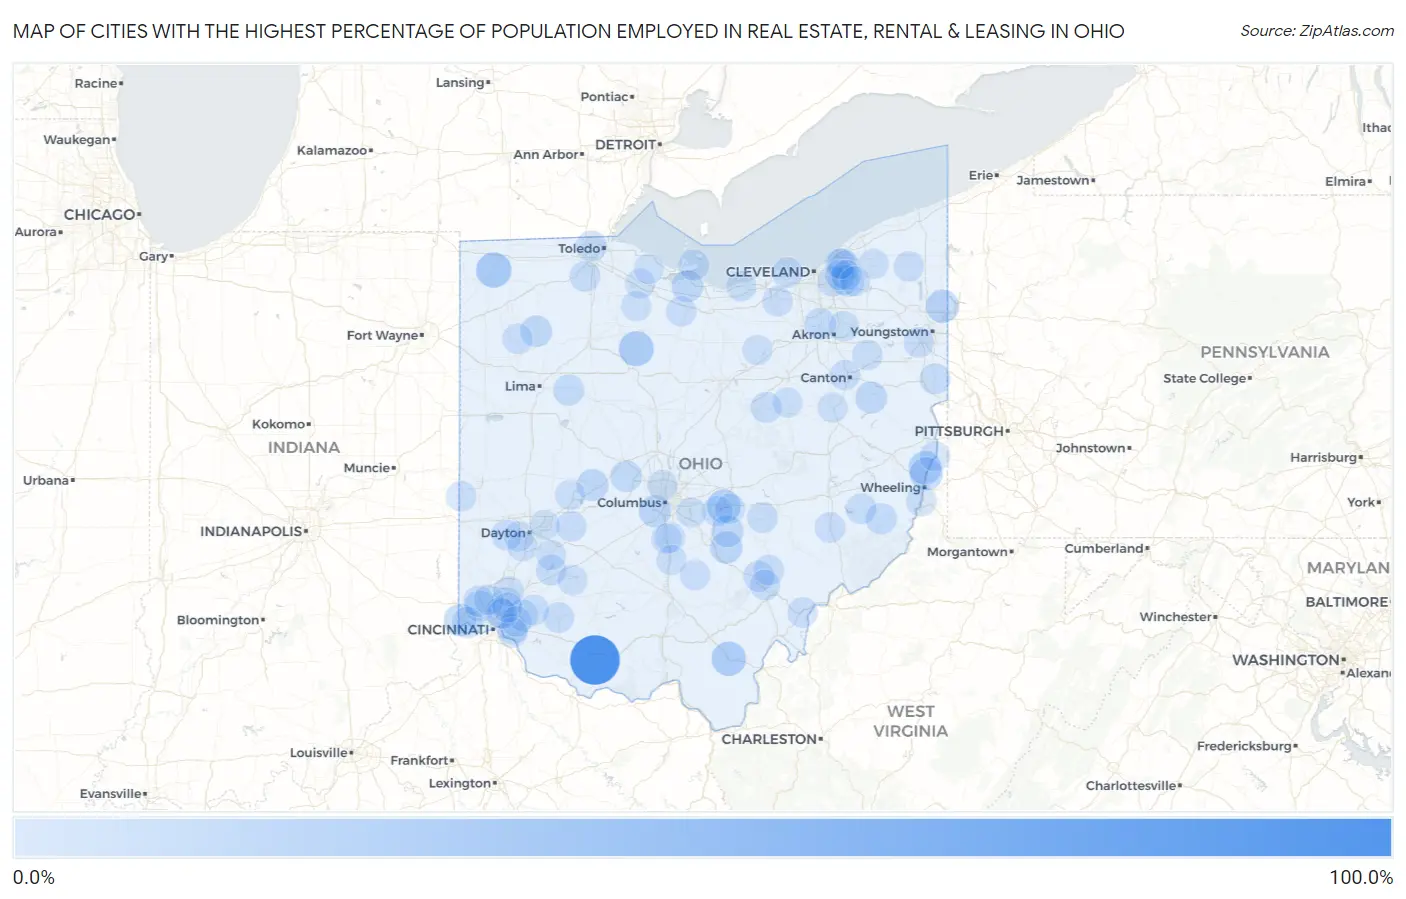
Map of Cities with the Highest Percentage of Population Employed in Real Estate, Rental & Leasing in Ohio
0.0%
100.0%
Cities with the Highest Percentage of Population Employed in Real Estate, Rental & Leasing in Ohio
| City | % Employed | vs State | vs National | |
| 1. | Cherry Fork | 100.0% | 1.5%(+98.5)#1 | 1.9%(+98.1)#6 |
| 2. | Pulaski | 27.9% | 1.5%(+26.5)#2 | 1.9%(+26.0)#79 |
| 3. | Mccutchenville | 25.9% | 1.5%(+24.4)#3 | 1.9%(+24.0)#96 |
| 4. | Centerville Thurman | 23.5% | 1.5%(+22.1)#4 | 1.9%(+21.6)#114 |
| 5. | Buckeye Lake | 20.5% | 1.5%(+19.0)#5 | 1.9%(+18.6)#147 |
| 6. | Roachester | 18.6% | 1.5%(+17.1)#6 | 1.9%(+16.7)#168 |
| 7. | Yankee Lake | 18.2% | 1.5%(+16.7)#7 | 1.9%(+16.3)#178 |
| 8. | Connorville | 17.1% | 1.5%(+15.6)#8 | 1.9%(+15.2)#191 |
| 9. | Yorkville | 17.0% | 1.5%(+15.6)#9 | 1.9%(+15.2)#192 |
| 10. | Elizabethtown | 13.8% | 1.5%(+12.3)#10 | 1.9%(+11.9)#286 |
| 11. | Urbancrest | 13.4% | 1.5%(+12.0)#11 | 1.9%(+11.5)#296 |
| 12. | Hide A Way Hills | 13.3% | 1.5%(+11.8)#12 | 1.9%(+11.4)#300 |
| 13. | West Rushville | 12.1% | 1.5%(+10.7)#13 | 1.9%(+10.3)#369 |
| 14. | Lake Mohawk | 11.8% | 1.5%(+10.3)#14 | 1.9%(+9.90)#390 |
| 15. | Mutual | 11.5% | 1.5%(+10.1)#15 | 1.9%(+9.65)#409 |
| 16. | Nankin | 11.0% | 1.5%(+9.51)#16 | 1.9%(+9.08)#446 |
| 17. | Castalia | 10.9% | 1.5%(+9.48)#17 | 1.9%(+9.05)#449 |
| 18. | Miller City | 10.8% | 1.5%(+9.31)#18 | 1.9%(+8.88)#468 |
| 19. | Unionville Center | 10.5% | 1.5%(+9.03)#19 | 1.9%(+8.60)#486 |
| 20. | Jerusalem | 8.9% | 1.5%(+7.47)#20 | 1.9%(+7.04)#657 |
| 21. | Dry Ridge | 8.8% | 1.5%(+7.34)#21 | 1.9%(+6.91)#679 |
| 22. | North Bend | 8.6% | 1.5%(+7.19)#22 | 1.9%(+6.76)#703 |
| 23. | Chagrin Falls | 8.2% | 1.5%(+6.77)#23 | 1.9%(+6.33)#771 |
| 24. | Bass Lake | 8.0% | 1.5%(+6.58)#24 | 1.9%(+6.14)#819 |
| 25. | Montrose Ghent | 7.9% | 1.5%(+6.43)#25 | 1.9%(+6.00)#845 |
| 26. | Alger | 7.6% | 1.5%(+6.16)#26 | 1.9%(+5.72)#899 |
| 27. | Nashville | 7.0% | 1.5%(+5.55)#27 | 1.9%(+5.11)#1,047 |
| 28. | Buchtel | 6.7% | 1.5%(+5.21)#28 | 1.9%(+4.77)#1,120 |
| 29. | Rogers | 6.7% | 1.5%(+5.21)#29 | 1.9%(+4.77)#1,122 |
| 30. | Ottawa Hills | 6.5% | 1.5%(+5.09)#30 | 1.9%(+4.66)#1,174 |
| 31. | Harveysburg | 6.5% | 1.5%(+5.09)#31 | 1.9%(+4.65)#1,179 |
| 32. | Dunlap | 6.4% | 1.5%(+4.99)#32 | 1.9%(+4.55)#1,205 |
| 33. | Fort Mckinley | 6.0% | 1.5%(+4.57)#33 | 1.9%(+4.14)#1,367 |
| 34. | Lakeside | 6.0% | 1.5%(+4.56)#34 | 1.9%(+4.12)#1,369 |
| 35. | Fayetteville | 5.9% | 1.5%(+4.47)#35 | 1.9%(+4.03)#1,409 |
| 36. | Batesville | 5.9% | 1.5%(+4.43)#36 | 1.9%(+3.99)#1,425 |
| 37. | Haskins | 5.9% | 1.5%(+4.42)#37 | 1.9%(+3.98)#1,429 |
| 38. | Fultonham | 5.8% | 1.5%(+4.34)#38 | 1.9%(+3.91)#1,462 |
| 39. | Belle Valley | 5.7% | 1.5%(+4.26)#39 | 1.9%(+3.82)#1,495 |
| 40. | Brunersburg | 5.7% | 1.5%(+4.22)#40 | 1.9%(+3.78)#1,512 |
| 41. | Gates Mills | 5.6% | 1.5%(+4.18)#41 | 1.9%(+3.74)#1,530 |
| 42. | Mulberry | 5.5% | 1.5%(+4.09)#42 | 1.9%(+3.66)#1,570 |
| 43. | New Lebanon | 5.5% | 1.5%(+4.04)#43 | 1.9%(+3.60)#1,596 |
| 44. | Sharonville | 5.4% | 1.5%(+3.97)#44 | 1.9%(+3.54)#1,622 |
| 45. | Ashville | 5.4% | 1.5%(+3.94)#45 | 1.9%(+3.50)#1,640 |
| 46. | Goshen | 5.4% | 1.5%(+3.93)#46 | 1.9%(+3.49)#1,647 |
| 47. | North Industry | 5.3% | 1.5%(+3.89)#47 | 1.9%(+3.45)#1,672 |
| 48. | Glouster | 5.2% | 1.5%(+3.74)#48 | 1.9%(+3.30)#1,746 |
| 49. | Bay Village | 5.0% | 1.5%(+3.56)#49 | 1.9%(+3.12)#1,850 |
| 50. | Flat Rock | 5.0% | 1.5%(+3.55)#50 | 1.9%(+3.11)#1,859 |
| 51. | Chauncey | 5.0% | 1.5%(+3.53)#51 | 1.9%(+3.10)#1,868 |
| 52. | Coolville | 4.9% | 1.5%(+3.45)#52 | 1.9%(+3.01)#1,919 |
| 53. | Dry Run | 4.9% | 1.5%(+3.41)#53 | 1.9%(+2.97)#1,947 |
| 54. | Clifton | 4.9% | 1.5%(+3.40)#54 | 1.9%(+2.96)#1,960 |
| 55. | Dupont | 4.8% | 1.5%(+3.38)#55 | 1.9%(+2.95)#1,971 |
| 56. | Arlington Heights | 4.8% | 1.5%(+3.36)#56 | 1.9%(+2.92)#1,985 |
| 57. | Eaton Estates | 4.8% | 1.5%(+3.35)#57 | 1.9%(+2.91)#1,993 |
| 58. | Millersport | 4.8% | 1.5%(+3.34)#58 | 1.9%(+2.90)#1,996 |
| 59. | Terrace Park | 4.7% | 1.5%(+3.22)#59 | 1.9%(+2.78)#2,080 |
| 60. | North Randall | 4.7% | 1.5%(+3.21)#60 | 1.9%(+2.77)#2,088 |
| 61. | Marlboro | 4.7% | 1.5%(+3.20)#61 | 1.9%(+2.76)#2,099 |
| 62. | Hollansburg | 4.6% | 1.5%(+3.16)#62 | 1.9%(+2.72)#2,129 |
| 63. | Moreland Hills | 4.6% | 1.5%(+3.10)#63 | 1.9%(+2.66)#2,166 |
| 64. | Mayfield | 4.5% | 1.5%(+3.09)#64 | 1.9%(+2.66)#2,169 |
| 65. | Shadyside | 4.5% | 1.5%(+3.07)#65 | 1.9%(+2.64)#2,184 |
| 66. | Brilliant | 4.5% | 1.5%(+3.05)#66 | 1.9%(+2.62)#2,205 |
| 67. | Canfield | 4.5% | 1.5%(+3.03)#67 | 1.9%(+2.59)#2,219 |
| 68. | Laurelville | 4.4% | 1.5%(+2.96)#68 | 1.9%(+2.53)#2,275 |
| 69. | Munroe Falls | 4.4% | 1.5%(+2.94)#69 | 1.9%(+2.51)#2,291 |
| 70. | Highland Heights | 4.3% | 1.5%(+2.89)#70 | 1.9%(+2.46)#2,326 |
| 71. | Orwell | 4.3% | 1.5%(+2.85)#71 | 1.9%(+2.41)#2,364 |
| 72. | Meyers Lake | 4.2% | 1.5%(+2.78)#72 | 1.9%(+2.35)#2,412 |
| 73. | Vermilion | 4.2% | 1.5%(+2.75)#73 | 1.9%(+2.32)#2,434 |
| 74. | Wetherington | 4.0% | 1.5%(+2.59)#74 | 1.9%(+2.15)#2,618 |
| 75. | Forestville | 4.0% | 1.5%(+2.54)#75 | 1.9%(+2.10)#2,671 |
| 76. | Cinnamon Lake | 3.9% | 1.5%(+2.43)#76 | 1.9%(+2.00)#2,782 |
| 77. | Amberley | 3.9% | 1.5%(+2.40)#77 | 1.9%(+1.97)#2,814 |
| 78. | South Bloomfield | 3.8% | 1.5%(+2.38)#78 | 1.9%(+1.94)#2,845 |
| 79. | Logan Elm Village | 3.8% | 1.5%(+2.37)#79 | 1.9%(+1.93)#2,849 |
| 80. | Pleasant Run Farm | 3.8% | 1.5%(+2.35)#80 | 1.9%(+1.91)#2,872 |
| 81. | Pepper Pike | 3.8% | 1.5%(+2.34)#81 | 1.9%(+1.91)#2,883 |
| 82. | Hunting Valley | 3.8% | 1.5%(+2.31)#82 | 1.9%(+1.88)#2,927 |
| 83. | Medway | 3.8% | 1.5%(+2.30)#83 | 1.9%(+1.86)#2,944 |
| 84. | Wilmington | 3.7% | 1.5%(+2.27)#84 | 1.9%(+1.84)#2,971 |
| 85. | Strasburg | 3.7% | 1.5%(+2.26)#85 | 1.9%(+1.82)#2,993 |
| 86. | Holmesville | 3.7% | 1.5%(+2.25)#86 | 1.9%(+1.81)#3,017 |
| 87. | Drexel | 3.7% | 1.5%(+2.21)#87 | 1.9%(+1.77)#3,059 |
| 88. | Blue Ash | 3.6% | 1.5%(+2.19)#88 | 1.9%(+1.75)#3,093 |
| 89. | Pickerington | 3.6% | 1.5%(+2.17)#89 | 1.9%(+1.73)#3,126 |
| 90. | Thornport | 3.6% | 1.5%(+2.15)#90 | 1.9%(+1.72)#3,144 |
| 91. | Spring Valley | 3.6% | 1.5%(+2.13)#91 | 1.9%(+1.69)#3,176 |
| 92. | Burgoon | 3.6% | 1.5%(+2.12)#92 | 1.9%(+1.68)#3,199 |
| 93. | Riverlea | 3.5% | 1.5%(+2.04)#93 | 1.9%(+1.60)#3,294 |
| 94. | Wright Patterson Afb | 3.5% | 1.5%(+2.04)#94 | 1.9%(+1.60)#3,300 |
| 95. | Tremont City | 3.4% | 1.5%(+1.99)#95 | 1.9%(+1.56)#3,359 |
| 96. | West Carrollton | 3.4% | 1.5%(+1.93)#96 | 1.9%(+1.50)#3,442 |
| 97. | Lindsey | 3.3% | 1.5%(+1.88)#97 | 1.9%(+1.44)#3,517 |
| 98. | Aquilla | 3.3% | 1.5%(+1.88)#98 | 1.9%(+1.44)#3,519 |
| 99. | South Russell | 3.3% | 1.5%(+1.86)#99 | 1.9%(+1.43)#3,553 |
| 100. | Oak Harbor | 3.3% | 1.5%(+1.85)#100 | 1.9%(+1.41)#3,580 |
Common Questions
What are the Top 10 Cities with the Highest Percentage of Population Employed in Real Estate, Rental & Leasing in Ohio?
Top 10 Cities with the Highest Percentage of Population Employed in Real Estate, Rental & Leasing in Ohio are:
#1
100.0%
#2
27.9%
#3
25.9%
#4
23.5%
#5
20.5%
#6
18.2%
#7
17.1%
#8
17.0%
#9
13.8%
#10
13.4%
What city has the Highest Percentage of Population Employed in Real Estate, Rental & Leasing in Ohio?
Cherry Fork has the Highest Percentage of Population Employed in Real Estate, Rental & Leasing in Ohio with 100.0%.
What is the Percentage of Population Employed in Real Estate, Rental & Leasing in the State of Ohio?
Percentage of Population Employed in Real Estate, Rental & Leasing in Ohio is 1.5%.
What is the Percentage of Population Employed in Real Estate, Rental & Leasing in the United States?
Percentage of Population Employed in Real Estate, Rental & Leasing in the United States is 1.9%.