Cities with the Highest Percentage of Population Employed in Real Estate, Rental & Leasing in Delaware
RELATED REPORTS & OPTIONS
Real Estate, Rental & Leasing
Delaware
Compare Cities
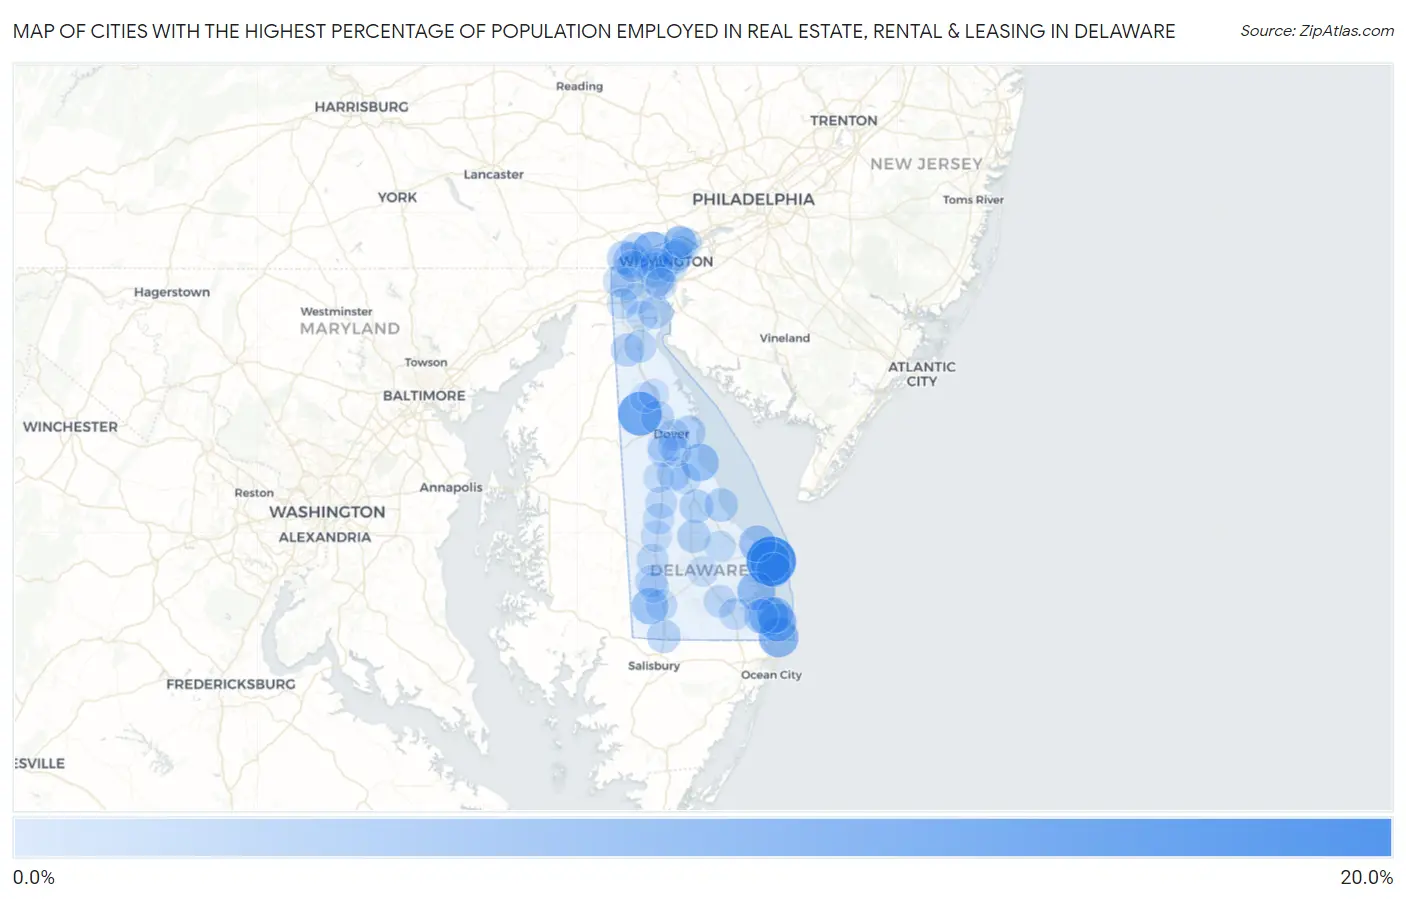
Map of Cities with the Highest Percentage of Population Employed in Real Estate, Rental & Leasing in Delaware
0.0%
20.0%
Cities with the Highest Percentage of Population Employed in Real Estate, Rental & Leasing in Delaware
| City | % Employed | vs State | vs National | |
| 1. | Henlopen Acres | 15.6% | 1.8%(+13.8)#1 | 1.9%(+13.7)#228 |
| 2. | Kenton | 10.8% | 1.8%(+9.05)#2 | 1.9%(+8.95)#458 |
| 3. | Rehoboth Beach | 8.2% | 1.8%(+6.42)#3 | 1.9%(+6.32)#777 |
| 4. | Fenwick Island | 7.5% | 1.8%(+5.69)#4 | 1.9%(+5.58)#936 |
| 5. | Greenville | 7.4% | 1.8%(+5.66)#5 | 1.9%(+5.55)#943 |
| 6. | Ocean View | 7.2% | 1.8%(+5.36)#6 | 1.9%(+5.26)#1,001 |
| 7. | Long Neck | 6.3% | 1.8%(+4.48)#7 | 1.9%(+4.38)#1,258 |
| 8. | South Bethany | 6.2% | 1.8%(+4.46)#8 | 1.9%(+4.36)#1,269 |
| 9. | Bowers | 5.9% | 1.8%(+4.09)#9 | 1.9%(+3.99)#1,423 |
| 10. | Lewes | 5.2% | 1.8%(+3.43)#10 | 1.9%(+3.33)#1,732 |
| 11. | Bethel | 5.0% | 1.8%(+3.25)#11 | 1.9%(+3.15)#1,839 |
| 12. | Bethany Beach | 4.6% | 1.8%(+2.81)#12 | 1.9%(+2.71)#2,134 |
| 13. | Pike Creek | 4.2% | 1.8%(+2.41)#13 | 1.9%(+2.31)#2,446 |
| 14. | Newport | 4.1% | 1.8%(+2.28)#14 | 1.9%(+2.17)#2,587 |
| 15. | Ardencroft | 3.5% | 1.8%(+1.72)#15 | 1.9%(+1.62)#3,286 |
| 16. | Dewey Beach | 3.5% | 1.8%(+1.68)#16 | 1.9%(+1.58)#3,329 |
| 17. | Millville | 3.3% | 1.8%(+1.52)#17 | 1.9%(+1.42)#3,570 |
| 18. | Milford | 3.0% | 1.8%(+1.24)#18 | 1.9%(+1.14)#4,061 |
| 19. | Little Creek | 2.9% | 1.8%(+1.15)#19 | 1.9%(+1.05)#4,242 |
| 20. | Slaughter Beach | 2.9% | 1.8%(+1.08)#20 | 1.9%(+0.982)#4,374 |
| 21. | Delmar | 2.7% | 1.8%(+0.938)#21 | 1.9%(+0.836)#4,709 |
| 22. | Riverview | 2.7% | 1.8%(+0.894)#22 | 1.9%(+0.791)#4,823 |
| 23. | Ellendale | 2.7% | 1.8%(+0.871)#23 | 1.9%(+0.768)#4,899 |
| 24. | North Star | 2.6% | 1.8%(+0.792)#24 | 1.9%(+0.689)#5,118 |
| 25. | Cheswold | 2.5% | 1.8%(+0.701)#25 | 1.9%(+0.598)#5,359 |
| 26. | Middletown | 2.5% | 1.8%(+0.680)#26 | 1.9%(+0.578)#5,419 |
| 27. | Wilmington Manor | 2.4% | 1.8%(+0.563)#27 | 1.9%(+0.460)#5,805 |
| 28. | Edgemoor | 2.0% | 1.8%(+0.247)#28 | 1.9%(+0.144)#6,909 |
| 29. | Millsboro | 2.0% | 1.8%(+0.203)#29 | 1.9%(+0.101)#7,078 |
| 30. | Delaware City | 1.9% | 1.8%(+0.102)#30 | 1.9%(-0.001)#7,481 |
| 31. | Odessa | 1.8% | 1.8%(+0.018)#31 | 1.9%(-0.084)#7,815 |
| 32. | Brookside | 1.8% | 1.8%(+0.006)#32 | 1.9%(-0.097)#7,857 |
| 33. | Bridgeville | 1.7% | 1.8%(-0.052)#33 | 1.9%(-0.155)#8,119 |
| 34. | Seaford | 1.7% | 1.8%(-0.105)#34 | 1.9%(-0.208)#8,373 |
| 35. | Harrington | 1.6% | 1.8%(-0.208)#35 | 1.9%(-0.310)#8,861 |
| 36. | Hockessin | 1.6% | 1.8%(-0.229)#36 | 1.9%(-0.332)#8,975 |
| 37. | Elsmere | 1.5% | 1.8%(-0.293)#37 | 1.9%(-0.396)#9,315 |
| 38. | Camden | 1.5% | 1.8%(-0.297)#38 | 1.9%(-0.400)#9,344 |
| 39. | Dagsboro | 1.4% | 1.8%(-0.360)#39 | 1.9%(-0.463)#9,656 |
| 40. | Wilmington | 1.4% | 1.8%(-0.404)#40 | 1.9%(-0.507)#9,887 |
| 41. | Newark | 1.3% | 1.8%(-0.450)#41 | 1.9%(-0.553)#10,113 |
| 42. | Dover | 1.3% | 1.8%(-0.456)#42 | 1.9%(-0.558)#10,139 |
| 43. | New Castle | 1.3% | 1.8%(-0.515)#43 | 1.9%(-0.617)#10,454 |
| 44. | Laurel | 1.3% | 1.8%(-0.515)#44 | 1.9%(-0.618)#10,459 |
| 45. | Pike Creek Valley | 1.3% | 1.8%(-0.519)#45 | 1.9%(-0.622)#10,482 |
| 46. | Bellefonte | 1.2% | 1.8%(-0.577)#46 | 1.9%(-0.680)#10,805 |
| 47. | Claymont | 1.2% | 1.8%(-0.639)#47 | 1.9%(-0.742)#11,162 |
| 48. | Greenwood | 1.1% | 1.8%(-0.649)#48 | 1.9%(-0.751)#11,217 |
| 49. | Farmington | 1.1% | 1.8%(-0.653)#49 | 1.9%(-0.755)#11,242 |
| 50. | Milton | 1.1% | 1.8%(-0.694)#50 | 1.9%(-0.797)#11,454 |
| 51. | Bear | 1.1% | 1.8%(-0.728)#51 | 1.9%(-0.831)#11,661 |
| 52. | Frederica | 1.0% | 1.8%(-0.756)#52 | 1.9%(-0.859)#11,811 |
| 53. | Arden | 1.0% | 1.8%(-0.786)#53 | 1.9%(-0.888)#11,982 |
| 54. | St Georges | 0.88% | 1.8%(-0.904)#54 | 1.9%(-1.01)#12,640 |
| 55. | Glasgow | 0.88% | 1.8%(-0.913)#55 | 1.9%(-1.02)#12,689 |
| 56. | Felton | 0.73% | 1.8%(-1.06)#56 | 1.9%(-1.16)#13,509 |
| 57. | Blades | 0.66% | 1.8%(-1.13)#57 | 1.9%(-1.23)#13,927 |
| 58. | Rising Sun Lebanon | 0.62% | 1.8%(-1.17)#58 | 1.9%(-1.27)#14,133 |
| 59. | Georgetown | 0.52% | 1.8%(-1.27)#59 | 1.9%(-1.38)#14,701 |
| 60. | Clayton | 0.34% | 1.8%(-1.45)#60 | 1.9%(-1.56)#15,579 |
| 61. | Wyoming | 0.29% | 1.8%(-1.50)#61 | 1.9%(-1.61)#15,766 |
| 62. | Smyrna | 0.25% | 1.8%(-1.54)#62 | 1.9%(-1.64)#15,877 |
| 63. | Highland Acres | 0.058% | 1.8%(-1.73)#63 | 1.9%(-1.83)#16,138 |
1
Common Questions
What are the Top 10 Cities with the Highest Percentage of Population Employed in Real Estate, Rental & Leasing in Delaware?
Top 10 Cities with the Highest Percentage of Population Employed in Real Estate, Rental & Leasing in Delaware are:
#1
15.6%
#2
10.8%
#3
8.2%
#4
7.5%
#5
7.4%
#6
7.2%
#7
6.3%
#8
6.2%
#9
5.9%
#10
5.2%
What city has the Highest Percentage of Population Employed in Real Estate, Rental & Leasing in Delaware?
Henlopen Acres has the Highest Percentage of Population Employed in Real Estate, Rental & Leasing in Delaware with 15.6%.
What is the Percentage of Population Employed in Real Estate, Rental & Leasing in the State of Delaware?
Percentage of Population Employed in Real Estate, Rental & Leasing in Delaware is 1.8%.
What is the Percentage of Population Employed in Real Estate, Rental & Leasing in the United States?
Percentage of Population Employed in Real Estate, Rental & Leasing in the United States is 1.9%.