Zip Codes with the Highest Percentage of Population Employed in Real Estate, Rental & Leasing in La Puente, CA
RELATED REPORTS & OPTIONS
Real Estate, Rental & Leasing
La Puente
Compare Zip Codes
Map of Zip Codes with the Highest Percentage of Population Employed in Real Estate, Rental & Leasing in La Puente
1.1%
1.2%
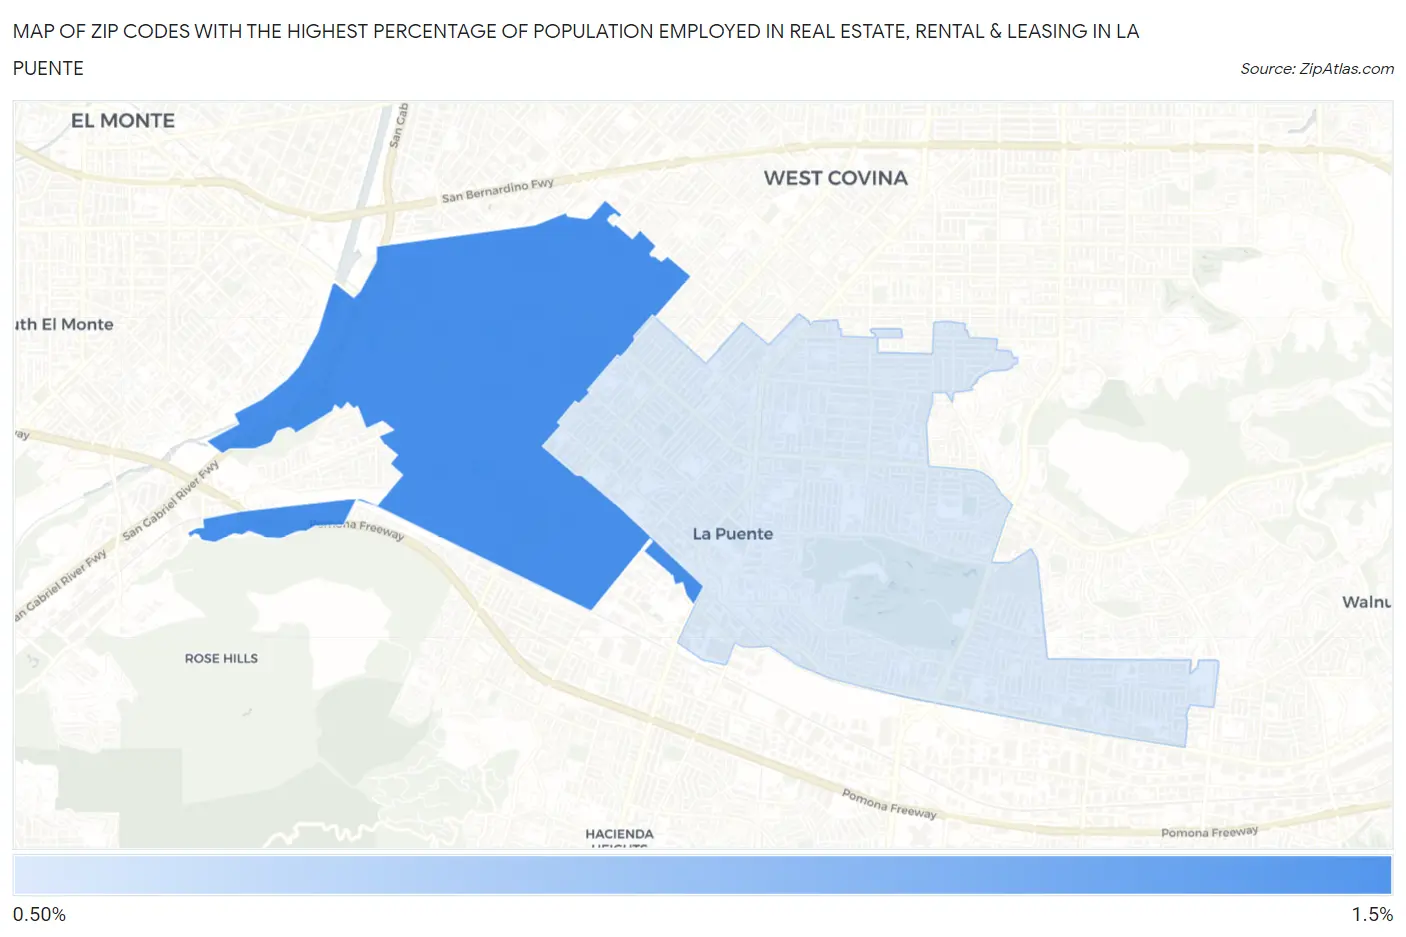
Zip Codes with the Highest Percentage of Population Employed in Real Estate, Rental & Leasing in La Puente, CA
| Zip Code | % Employed | vs State | vs National | |
| 1. | 91746 | 1.2% | 2.1%(-0.934)#1,098 | 1.9%(-0.706)#13,606 |
| 2. | 91744 | 1.1% | 2.1%(-0.997)#1,119 | 1.9%(-0.770)#14,094 |
1
Common Questions
What are the Top Zip Codes with the Highest Percentage of Population Employed in Real Estate, Rental & Leasing in La Puente, CA?
Top Zip Codes with the Highest Percentage of Population Employed in Real Estate, Rental & Leasing in La Puente, CA are:
What zip code has the Highest Percentage of Population Employed in Real Estate, Rental & Leasing in La Puente, CA?
91746 has the Highest Percentage of Population Employed in Real Estate, Rental & Leasing in La Puente, CA with 1.2%.
What is the Percentage of Population Employed in Real Estate, Rental & Leasing in La Puente, CA?
Percentage of Population Employed in Real Estate, Rental & Leasing in La Puente is 1.5%.
What is the Percentage of Population Employed in Real Estate, Rental & Leasing in California?
Percentage of Population Employed in Real Estate, Rental & Leasing in California is 2.1%.
What is the Percentage of Population Employed in Real Estate, Rental & Leasing in the United States?
Percentage of Population Employed in Real Estate, Rental & Leasing in the United States is 1.9%.