Cities with the Highest Percentage of Population Employed in Real Estate, Rental & Leasing in Iowa
RELATED REPORTS & OPTIONS
Real Estate, Rental & Leasing
Iowa
Compare Cities
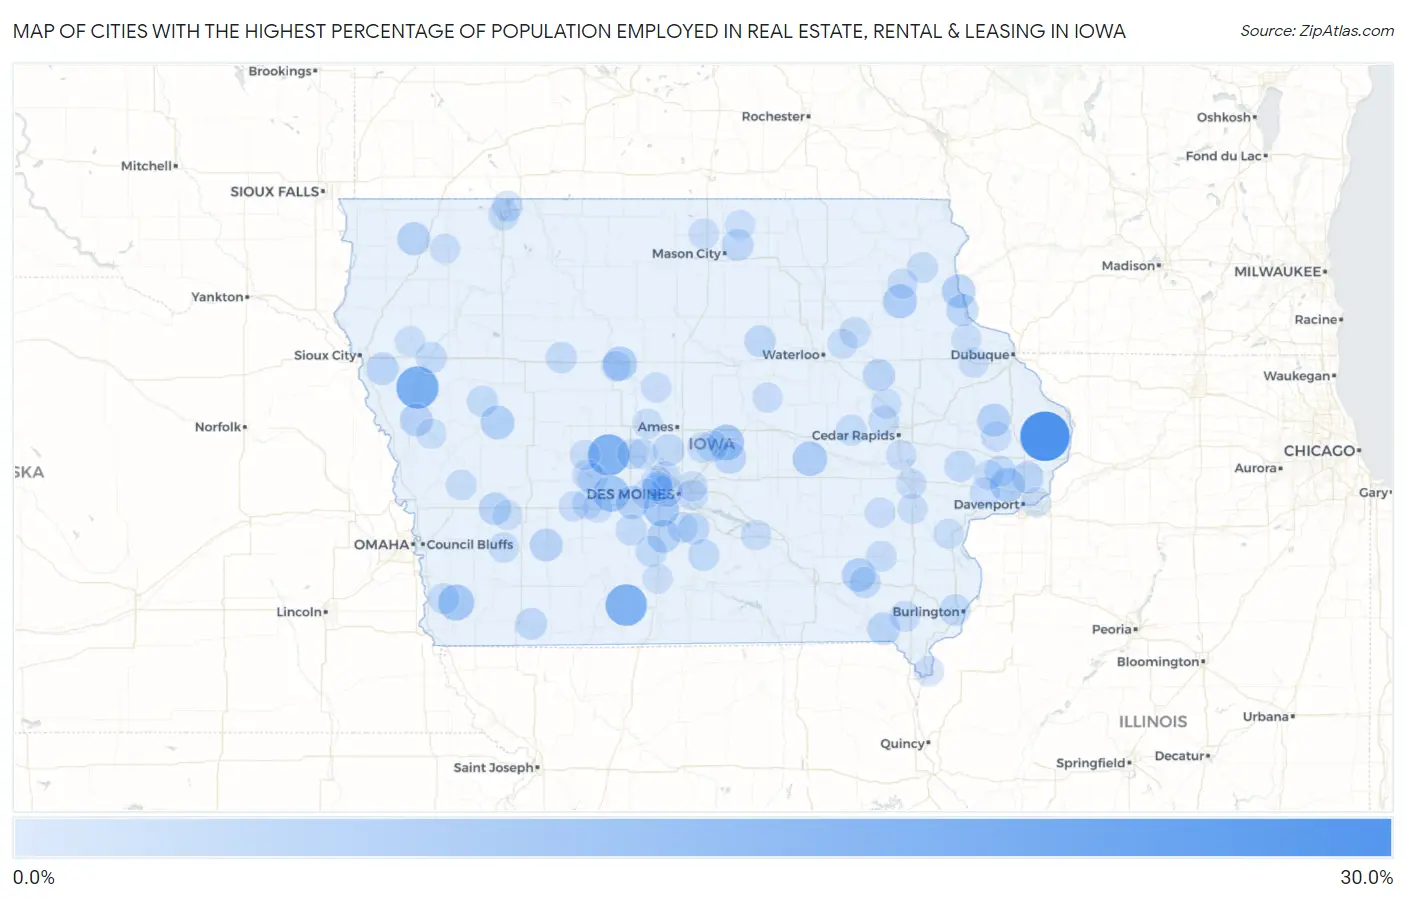
Map of Cities with the Highest Percentage of Population Employed in Real Estate, Rental & Leasing in Iowa
0.0%
30.0%
Cities with the Highest Percentage of Population Employed in Real Estate, Rental & Leasing in Iowa
| City | % Employed | vs State | vs National | |
| 1. | Goose Lake | 25.8% | 1.1%(+24.7)#1 | 1.9%(+23.9)#98 |
| 2. | Oto | 16.7% | 1.1%(+15.5)#2 | 1.9%(+14.8)#201 |
| 3. | Sun Valley Lake | 15.6% | 1.1%(+14.5)#3 | 1.9%(+13.7)#229 |
| 4. | Dawson | 15.6% | 1.1%(+14.5)#4 | 1.9%(+13.7)#230 |
| 5. | Redfield | 9.0% | 1.1%(+7.84)#5 | 1.9%(+7.09)#655 |
| 6. | Randolph | 8.9% | 1.1%(+7.76)#6 | 1.9%(+7.00)#664 |
| 7. | Rhodes | 8.5% | 1.1%(+7.39)#7 | 1.9%(+6.64)#718 |
| 8. | Cumming | 8.3% | 1.1%(+7.18)#8 | 1.9%(+6.42)#759 |
| 9. | Holiday Lake | 7.1% | 1.1%(+6.01)#9 | 1.9%(+5.25)#1,005 |
| 10. | Coalville | 6.8% | 1.1%(+5.66)#10 | 1.9%(+4.90)#1,099 |
| 11. | Maysville | 6.7% | 1.1%(+5.53)#11 | 1.9%(+4.77)#1,125 |
| 12. | Wadena | 6.6% | 1.1%(+5.45)#12 | 1.9%(+4.69)#1,160 |
| 13. | Vail | 6.3% | 1.1%(+5.15)#13 | 1.9%(+4.39)#1,254 |
| 14. | Clayton | 6.2% | 1.1%(+5.12)#14 | 1.9%(+4.36)#1,277 |
| 15. | Maharishi Vedic City | 5.9% | 1.1%(+4.81)#15 | 1.9%(+4.05)#1,404 |
| 16. | De Soto | 5.6% | 1.1%(+4.50)#16 | 1.9%(+3.75)#1,526 |
| 17. | Matlock | 5.5% | 1.1%(+4.36)#17 | 1.9%(+3.60)#1,600 |
| 18. | St Marys | 5.4% | 1.1%(+4.27)#18 | 1.9%(+3.51)#1,637 |
| 19. | Baldwin | 5.4% | 1.1%(+4.22)#19 | 1.9%(+3.47)#1,666 |
| 20. | Castana | 5.2% | 1.1%(+4.08)#20 | 1.9%(+3.33)#1,738 |
| 21. | Massena | 5.1% | 1.1%(+3.95)#21 | 1.9%(+3.19)#1,815 |
| 22. | Walnut | 4.9% | 1.1%(+3.72)#22 | 1.9%(+2.97)#1,956 |
| 23. | Bonaparte | 4.8% | 1.1%(+3.72)#23 | 1.9%(+2.96)#1,962 |
| 24. | Bronson | 4.7% | 1.1%(+3.52)#24 | 1.9%(+2.76)#2,097 |
| 25. | Guttenberg | 4.6% | 1.1%(+3.42)#25 | 1.9%(+2.66)#2,167 |
| 26. | Baxter | 4.5% | 1.1%(+3.33)#26 | 1.9%(+2.57)#2,242 |
| 27. | Rowley | 4.5% | 1.1%(+3.32)#27 | 1.9%(+2.56)#2,248 |
| 28. | Park View | 4.4% | 1.1%(+3.22)#28 | 1.9%(+2.46)#2,324 |
| 29. | Windsor Heights | 4.3% | 1.1%(+3.21)#29 | 1.9%(+2.45)#2,338 |
| 30. | Slater | 4.1% | 1.1%(+2.98)#30 | 1.9%(+2.22)#2,534 |
| 31. | Rock Falls | 4.1% | 1.1%(+2.98)#31 | 1.9%(+2.22)#2,539 |
| 32. | New Market | 4.0% | 1.1%(+2.83)#32 | 1.9%(+2.07)#2,705 |
| 33. | Ackworth | 3.8% | 1.1%(+2.71)#33 | 1.9%(+1.95)#2,831 |
| 34. | Aplington | 3.8% | 1.1%(+2.65)#34 | 1.9%(+1.89)#2,902 |
| 35. | Fairfield | 3.6% | 1.1%(+2.49)#35 | 1.9%(+1.73)#3,125 |
| 36. | West Burlington | 3.6% | 1.1%(+2.47)#36 | 1.9%(+1.72)#3,142 |
| 37. | Collins | 3.6% | 1.1%(+2.44)#37 | 1.9%(+1.68)#3,191 |
| 38. | Lacona | 3.6% | 1.1%(+2.44)#38 | 1.9%(+1.68)#3,196 |
| 39. | Dixon | 3.5% | 1.1%(+2.41)#39 | 1.9%(+1.65)#3,227 |
| 40. | Truro | 3.5% | 1.1%(+2.39)#40 | 1.9%(+1.63)#3,268 |
| 41. | Tipton | 3.4% | 1.1%(+2.30)#41 | 1.9%(+1.54)#3,379 |
| 42. | Twin Lakes | 3.3% | 1.1%(+2.22)#42 | 1.9%(+1.46)#3,497 |
| 43. | Winterset | 3.3% | 1.1%(+2.20)#43 | 1.9%(+1.44)#3,529 |
| 44. | Correctionville | 3.3% | 1.1%(+2.15)#44 | 1.9%(+1.39)#3,604 |
| 45. | Tabor | 3.2% | 1.1%(+2.09)#45 | 1.9%(+1.33)#3,719 |
| 46. | Kiron | 3.2% | 1.1%(+2.09)#46 | 1.9%(+1.33)#3,723 |
| 47. | Van Horne | 3.2% | 1.1%(+2.08)#47 | 1.9%(+1.33)#3,741 |
| 48. | Luana | 3.0% | 1.1%(+1.83)#48 | 1.9%(+1.07)#4,197 |
| 49. | Lake Panorama | 2.9% | 1.1%(+1.81)#49 | 1.9%(+1.05)#4,235 |
| 50. | Indianola | 2.9% | 1.1%(+1.80)#50 | 1.9%(+1.04)#4,254 |
| 51. | Okoboji | 2.9% | 1.1%(+1.74)#51 | 1.9%(+0.979)#4,384 |
| 52. | Brighton | 2.9% | 1.1%(+1.72)#52 | 1.9%(+0.965)#4,409 |
| 53. | Bouton | 2.9% | 1.1%(+1.72)#53 | 1.9%(+0.965)#4,413 |
| 54. | Houghton | 2.9% | 1.1%(+1.72)#54 | 1.9%(+0.965)#4,414 |
| 55. | Maxwell | 2.8% | 1.1%(+1.72)#55 | 1.9%(+0.958)#4,426 |
| 56. | Palo | 2.8% | 1.1%(+1.72)#56 | 1.9%(+0.957)#4,430 |
| 57. | Pleasant Hill | 2.8% | 1.1%(+1.69)#57 | 1.9%(+0.934)#4,485 |
| 58. | Orleans | 2.8% | 1.1%(+1.64)#58 | 1.9%(+0.886)#4,585 |
| 59. | Portsmouth | 2.8% | 1.1%(+1.64)#59 | 1.9%(+0.886)#4,592 |
| 60. | Fairbank | 2.8% | 1.1%(+1.63)#60 | 1.9%(+0.875)#4,610 |
| 61. | Griswold | 2.6% | 1.1%(+1.47)#61 | 1.9%(+0.711)#5,056 |
| 62. | Grimes | 2.6% | 1.1%(+1.44)#62 | 1.9%(+0.683)#5,141 |
| 63. | Panora | 2.6% | 1.1%(+1.43)#63 | 1.9%(+0.668)#5,181 |
| 64. | Durant | 2.6% | 1.1%(+1.43)#64 | 1.9%(+0.668)#5,183 |
| 65. | Clive | 2.5% | 1.1%(+1.40)#65 | 1.9%(+0.638)#5,267 |
| 66. | Hanlontown | 2.5% | 1.1%(+1.39)#66 | 1.9%(+0.629)#5,286 |
| 67. | Otho | 2.5% | 1.1%(+1.38)#67 | 1.9%(+0.621)#5,301 |
| 68. | Woodward | 2.5% | 1.1%(+1.37)#68 | 1.9%(+0.608)#5,337 |
| 69. | Menlo | 2.5% | 1.1%(+1.37)#69 | 1.9%(+0.608)#5,341 |
| 70. | Harvey | 2.5% | 1.1%(+1.37)#70 | 1.9%(+0.608)#5,344 |
| 71. | Lost Nation | 2.5% | 1.1%(+1.34)#71 | 1.9%(+0.577)#5,424 |
| 72. | Shueyville | 2.4% | 1.1%(+1.32)#72 | 1.9%(+0.558)#5,479 |
| 73. | University Heights | 2.4% | 1.1%(+1.31)#73 | 1.9%(+0.554)#5,491 |
| 74. | Bagley | 2.4% | 1.1%(+1.25)#74 | 1.9%(+0.489)#5,712 |
| 75. | Sanborn | 2.4% | 1.1%(+1.24)#75 | 1.9%(+0.485)#5,721 |
| 76. | Farley | 2.4% | 1.1%(+1.23)#76 | 1.9%(+0.470)#5,782 |
| 77. | Elgin | 2.3% | 1.1%(+1.21)#77 | 1.9%(+0.447)#5,841 |
| 78. | Keokuk | 2.3% | 1.1%(+1.19)#78 | 1.9%(+0.433)#5,893 |
| 79. | Casey | 2.3% | 1.1%(+1.18)#79 | 1.9%(+0.420)#5,925 |
| 80. | Johnston | 2.3% | 1.1%(+1.17)#80 | 1.9%(+0.411)#5,954 |
| 81. | Urbandale | 2.3% | 1.1%(+1.16)#81 | 1.9%(+0.405)#5,970 |
| 82. | Wellman | 2.3% | 1.1%(+1.16)#82 | 1.9%(+0.401)#5,982 |
| 83. | Soldier | 2.3% | 1.1%(+1.14)#83 | 1.9%(+0.381)#6,062 |
| 84. | Stanhope | 2.2% | 1.1%(+1.11)#84 | 1.9%(+0.355)#6,157 |
| 85. | Center Point | 2.2% | 1.1%(+1.09)#85 | 1.9%(+0.332)#6,227 |
| 86. | Letts | 2.2% | 1.1%(+1.09)#86 | 1.9%(+0.331)#6,236 |
| 87. | Dunkerton | 2.2% | 1.1%(+1.08)#87 | 1.9%(+0.321)#6,270 |
| 88. | Beaman | 2.2% | 1.1%(+1.06)#88 | 1.9%(+0.306)#6,328 |
| 89. | Boone | 2.2% | 1.1%(+1.06)#89 | 1.9%(+0.300)#6,348 |
| 90. | Altoona | 2.2% | 1.1%(+1.04)#90 | 1.9%(+0.286)#6,404 |
| 91. | Riverdale | 2.2% | 1.1%(+1.04)#91 | 1.9%(+0.282)#6,420 |
| 92. | New Liberty | 2.2% | 1.1%(+1.04)#92 | 1.9%(+0.282)#6,427 |
| 93. | Riverside | 2.1% | 1.1%(+0.998)#93 | 1.9%(+0.239)#6,567 |
| 94. | Marne | 2.1% | 1.1%(+0.994)#94 | 1.9%(+0.236)#6,588 |
| 95. | Kingsley | 2.1% | 1.1%(+0.941)#95 | 1.9%(+0.183)#6,754 |
| 96. | Grafton | 2.1% | 1.1%(+0.936)#96 | 1.9%(+0.177)#6,781 |
| 97. | Stuart | 2.1% | 1.1%(+0.925)#97 | 1.9%(+0.166)#6,825 |
| 98. | Osceola | 2.0% | 1.1%(+0.904)#98 | 1.9%(+0.146)#6,901 |
| 99. | Luxemburg | 2.0% | 1.1%(+0.867)#99 | 1.9%(+0.108)#7,054 |
| 100. | Waukee | 2.0% | 1.1%(+0.843)#100 | 1.9%(+0.085)#7,155 |
Common Questions
What are the Top 10 Cities with the Highest Percentage of Population Employed in Real Estate, Rental & Leasing in Iowa?
Top 10 Cities with the Highest Percentage of Population Employed in Real Estate, Rental & Leasing in Iowa are:
#1
25.8%
#2
16.7%
#3
15.6%
#4
15.6%
#5
9.0%
#6
8.9%
#7
8.5%
#8
8.3%
#9
7.1%
#10
6.8%
What city has the Highest Percentage of Population Employed in Real Estate, Rental & Leasing in Iowa?
Goose Lake has the Highest Percentage of Population Employed in Real Estate, Rental & Leasing in Iowa with 25.8%.
What is the Percentage of Population Employed in Real Estate, Rental & Leasing in the State of Iowa?
Percentage of Population Employed in Real Estate, Rental & Leasing in Iowa is 1.1%.
What is the Percentage of Population Employed in Real Estate, Rental & Leasing in the United States?
Percentage of Population Employed in Real Estate, Rental & Leasing in the United States is 1.9%.