Guinda, CA Map & Demographics
Guinda Map
Guinda Overview
$61,135
PER CAPITA INCOME
$128,144
AVG FAMILY INCOME
$128,750
AVG HOUSEHOLD INCOME
0.41
INEQUALITY / GINI INDEX
194
TOTAL POPULATION
97
MALE POPULATION
97
FEMALE POPULATION
100.00
MALES / 100 FEMALES
100.00
FEMALES / 100 MALES
30.7
MEDIAN AGE
2.3
AVG FAMILY SIZE
2.3
AVG HOUSEHOLD SIZE
100
LABOR FORCE [ PEOPLE ]
59.2%
PERCENT IN LABOR FORCE
Guinda Zip Codes
Guinda Area Codes
Income in Guinda
Income Overview in Guinda
Per Capita Income in Guinda is $61,135, while median incomes of families and households are $128,144 and $128,750 respectively.
| Characteristic | Number | Measure |
| Per Capita Income | 194 | $61,135 |
| Median Family Income | 69 | $128,144 |
| Mean Family Income | 69 | $139,365 |
| Median Household Income | 85 | $128,750 |
| Mean Household Income | 85 | $145,067 |
| Income Deficit | 69 | $0 |
| Wage / Income Gap (%) | 194 | 0.00% |
| Wage / Income Gap ($) | 194 | 100.00¢ per $1 |
| Gini / Inequality Index | 194 | 0.41 |
Earnings by Sex in Guinda
| Sex | Number | Average Earnings |
| Male | 75 (54.7%) | $0 |
| Female | 62 (45.3%) | $0 |
| Total | 137 (100.0%) | $0 |
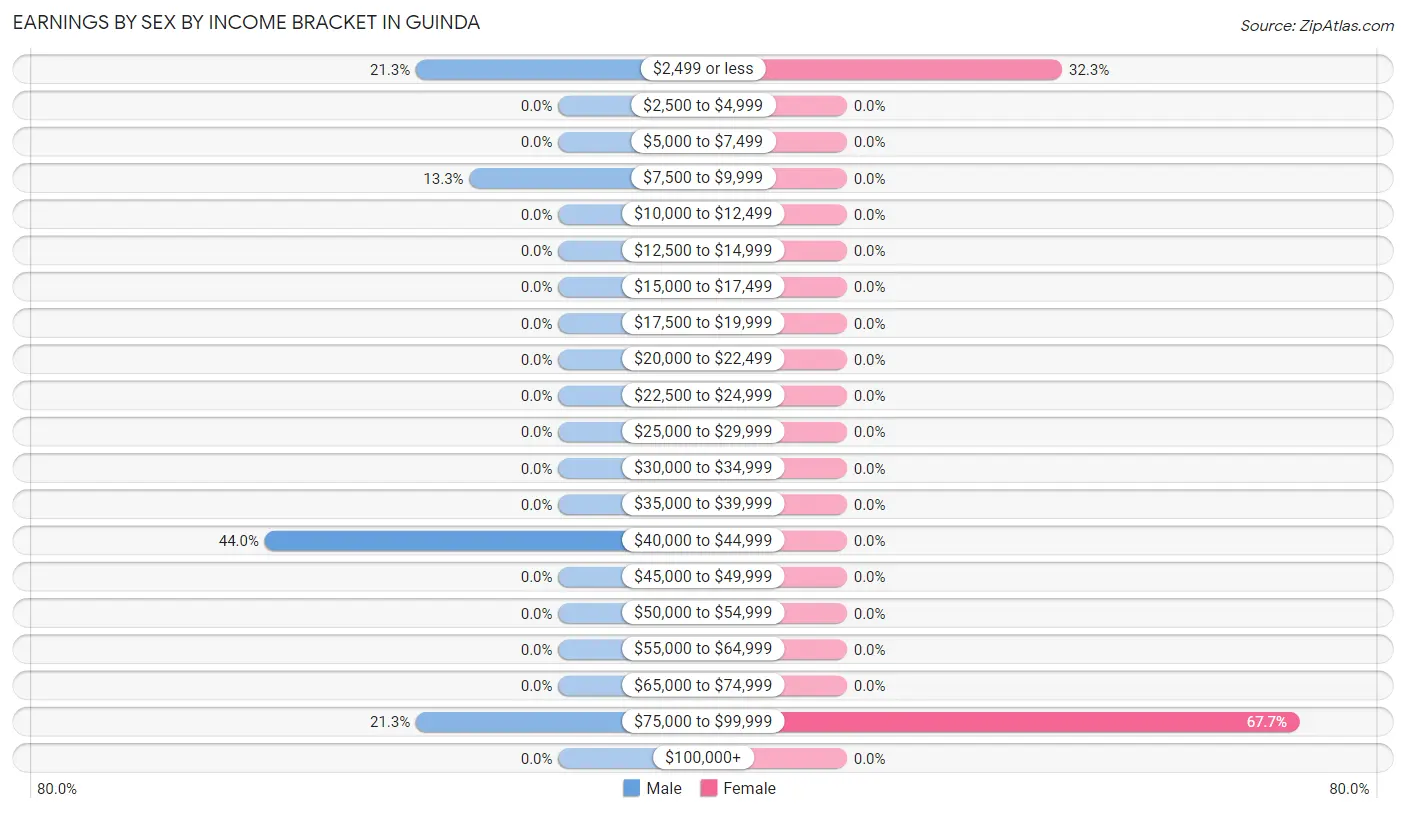
Earnings by Sex by Income Bracket in Guinda
The most common earnings brackets in Guinda are $40,000 to $44,999 for men (33 | 44.0%) and $75,000 to $99,999 for women (42 | 67.7%).
| Income | Male | Female |
| $2,499 or less | 16 (21.3%) | 20 (32.3%) |
| $2,500 to $4,999 | 0 (0.0%) | 0 (0.0%) |
| $5,000 to $7,499 | 0 (0.0%) | 0 (0.0%) |
| $7,500 to $9,999 | 10 (13.3%) | 0 (0.0%) |
| $10,000 to $12,499 | 0 (0.0%) | 0 (0.0%) |
| $12,500 to $14,999 | 0 (0.0%) | 0 (0.0%) |
| $15,000 to $17,499 | 0 (0.0%) | 0 (0.0%) |
| $17,500 to $19,999 | 0 (0.0%) | 0 (0.0%) |
| $20,000 to $22,499 | 0 (0.0%) | 0 (0.0%) |
| $22,500 to $24,999 | 0 (0.0%) | 0 (0.0%) |
| $25,000 to $29,999 | 0 (0.0%) | 0 (0.0%) |
| $30,000 to $34,999 | 0 (0.0%) | 0 (0.0%) |
| $35,000 to $39,999 | 0 (0.0%) | 0 (0.0%) |
| $40,000 to $44,999 | 33 (44.0%) | 0 (0.0%) |
| $45,000 to $49,999 | 0 (0.0%) | 0 (0.0%) |
| $50,000 to $54,999 | 0 (0.0%) | 0 (0.0%) |
| $55,000 to $64,999 | 0 (0.0%) | 0 (0.0%) |
| $65,000 to $74,999 | 0 (0.0%) | 0 (0.0%) |
| $75,000 to $99,999 | 16 (21.3%) | 42 (67.7%) |
| $100,000+ | 0 (0.0%) | 0 (0.0%) |
| Total | 75 (100.0%) | 62 (100.0%) |
Earnings by Sex by Educational Attainment in Guinda
| Educational Attainment | Male Income | Female Income |
| Less than High School | - | - |
| High School Diploma | - | - |
| College or Associate's Degree | - | - |
| Bachelor's Degree | - | - |
| Graduate Degree | - | - |
| Total | - | - |
Family Income in Guinda
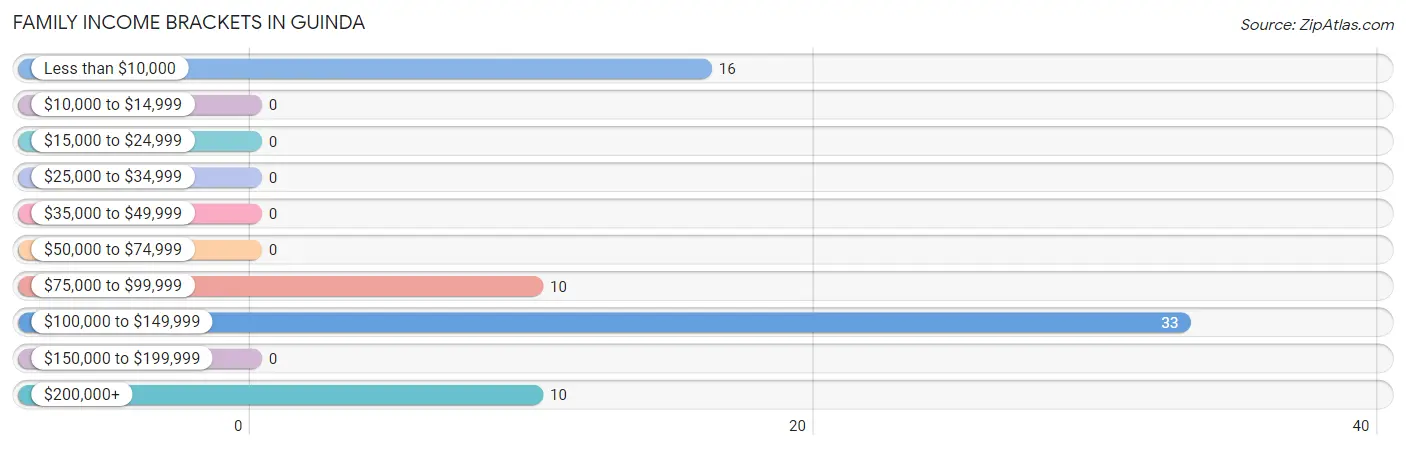
Family Income Brackets in Guinda
According to the Guinda family income data, there are 33 families falling into the $100,000 to $149,999 income range, which is the most common income bracket and makes up 47.8% of all families.
| Income Bracket | # Families | % Families |
| Less than $10,000 | 16 | 23.2% |
| $10,000 to $14,999 | 0 | 0.0% |
| $15,000 to $24,999 | 0 | 0.0% |
| $25,000 to $34,999 | 0 | 0.0% |
| $35,000 to $49,999 | 0 | 0.0% |
| $50,000 to $74,999 | 0 | 0.0% |
| $75,000 to $99,999 | 10 | 14.5% |
| $100,000 to $149,999 | 33 | 47.8% |
| $150,000 to $199,999 | 0 | 0.0% |
| $200,000+ | 10 | 14.5% |
Family Income by Famaliy Size in Guinda
| Income Bracket | # Families | Median Income |
| 2-Person Families | 43 (62.3%) | $0 |
| 3-Person Families | 26 (37.7%) | $0 |
| 4-Person Families | 0 (0.0%) | $0 |
| 5-Person Families | 0 (0.0%) | $0 |
| 6-Person Families | 0 (0.0%) | $0 |
| 7+ Person Families | 0 (0.0%) | $0 |
| Total | 69 (100.0%) | $128,144 |
Family Income by Number of Earners in Guinda
| Number of Earners | # Families | Median Income |
| No Earners | 10 (14.5%) | $0 |
| 1 Earner | 16 (23.2%) | $0 |
| 2 Earners | 43 (62.3%) | $0 |
| 3+ Earners | 0 (0.0%) | $0 |
| Total | 69 (100.0%) | $128,144 |
Household Income in Guinda
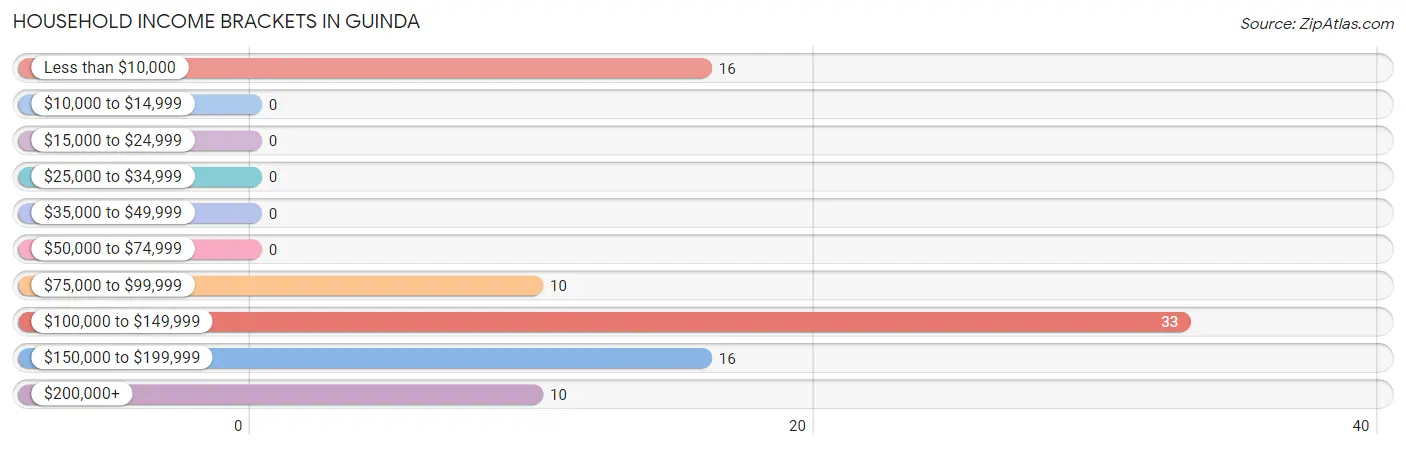
Household Income Brackets in Guinda
With 33 households falling in the category, the $100,000 to $149,999 income range is the most frequent in Guinda, accounting for 38.8% of all households.
| Income Bracket | # Households | % Households |
| Less than $10,000 | 16 | 18.8% |
| $10,000 to $14,999 | 0 | 0.0% |
| $15,000 to $24,999 | 0 | 0.0% |
| $25,000 to $34,999 | 0 | 0.0% |
| $35,000 to $49,999 | 0 | 0.0% |
| $50,000 to $74,999 | 0 | 0.0% |
| $75,000 to $99,999 | 10 | 11.8% |
| $100,000 to $149,999 | 33 | 38.8% |
| $150,000 to $199,999 | 16 | 18.8% |
| $200,000+ | 10 | 11.8% |
Household Income by Householder Age in Guinda
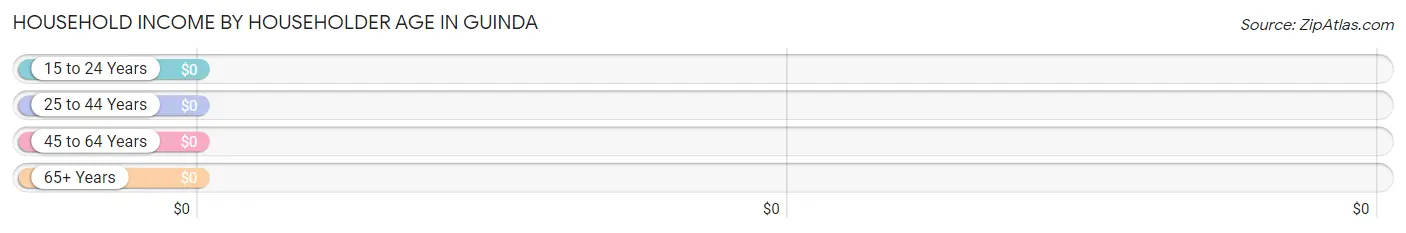
| Income Bracket | # Households | Median Income |
| 15 to 24 Years | 0 (0.0%) | $0 |
| 25 to 44 Years | 49 (57.7%) | $0 |
| 45 to 64 Years | 16 (18.8%) | $0 |
| 65+ Years | 20 (23.5%) | $0 |
| Total | 85 (100.0%) | $128,750 |
Poverty in Guinda
Income Below Poverty by Sex and Age in Guinda
With 28.9% poverty level for males and 22.7% for females among the residents of Guinda, 6 to 11 year old males and under 5 year old females are the most vulnerable to poverty, with 12 males (100.0%) and 13 females (100.0%) in their respective age groups living below the poverty level.
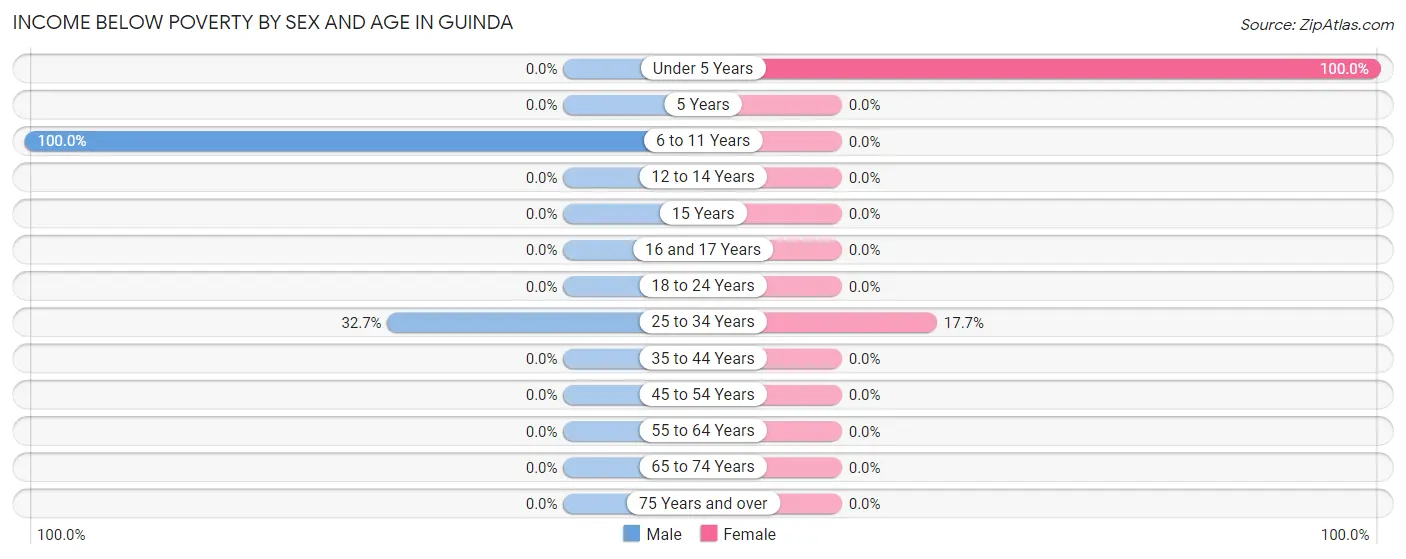
| Age Bracket | Male | Female |
| Under 5 Years | 0 (0.0%) | 13 (100.0%) |
| 5 Years | 0 (0.0%) | 0 (0.0%) |
| 6 to 11 Years | 12 (100.0%) | 0 (0.0%) |
| 12 to 14 Years | 0 (0.0%) | 0 (0.0%) |
| 15 Years | 0 (0.0%) | 0 (0.0%) |
| 16 and 17 Years | 0 (0.0%) | 0 (0.0%) |
| 18 to 24 Years | 0 (0.0%) | 0 (0.0%) |
| 25 to 34 Years | 16 (32.7%) | 9 (17.6%) |
| 35 to 44 Years | 0 (0.0%) | 0 (0.0%) |
| 45 to 54 Years | 0 (0.0%) | 0 (0.0%) |
| 55 to 64 Years | 0 (0.0%) | 0 (0.0%) |
| 65 to 74 Years | 0 (0.0%) | 0 (0.0%) |
| 75 Years and over | 0 (0.0%) | 0 (0.0%) |
| Total | 28 (28.9%) | 22 (22.7%) |
Income Above Poverty by Sex and Age in Guinda
According to the poverty statistics in Guinda, males aged 45 to 54 years and females aged 45 to 54 years are the age groups that are most secure financially, with 100.0% of males and 100.0% of females in these age groups living above the poverty line.
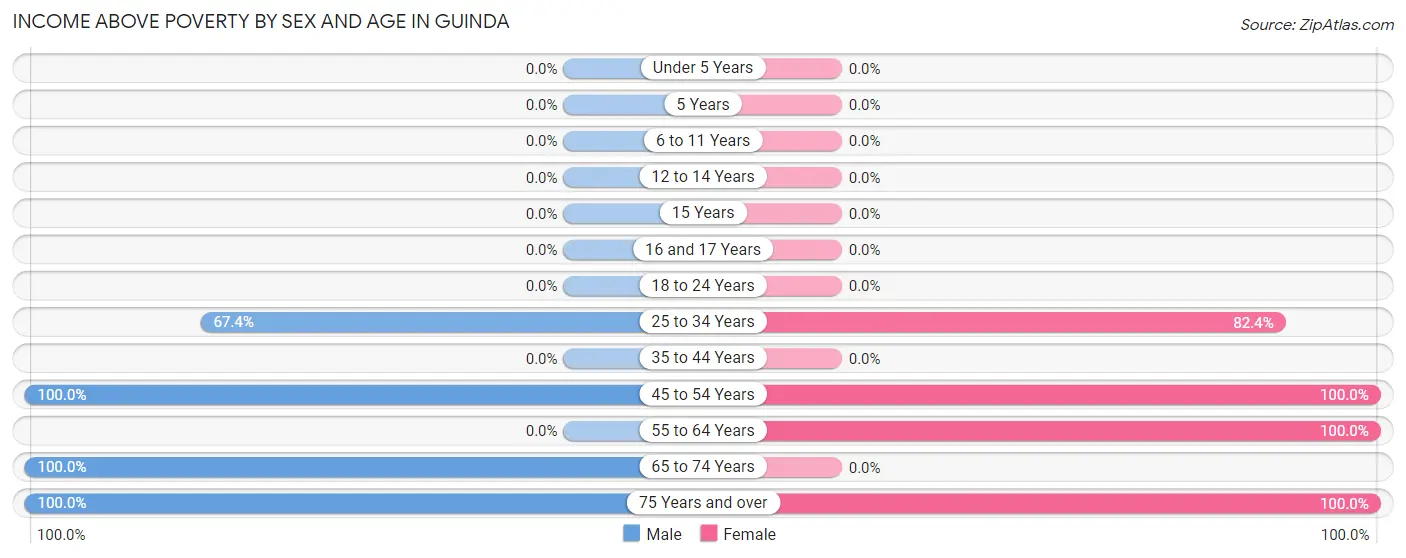
| Age Bracket | Male | Female |
| Under 5 Years | 0 (0.0%) | 0 (0.0%) |
| 5 Years | 0 (0.0%) | 0 (0.0%) |
| 6 to 11 Years | 0 (0.0%) | 0 (0.0%) |
| 12 to 14 Years | 0 (0.0%) | 0 (0.0%) |
| 15 Years | 0 (0.0%) | 0 (0.0%) |
| 16 and 17 Years | 0 (0.0%) | 0 (0.0%) |
| 18 to 24 Years | 0 (0.0%) | 0 (0.0%) |
| 25 to 34 Years | 33 (67.3%) | 42 (82.4%) |
| 35 to 44 Years | 0 (0.0%) | 0 (0.0%) |
| 45 to 54 Years | 16 (100.0%) | 11 (100.0%) |
| 55 to 64 Years | 0 (0.0%) | 10 (100.0%) |
| 65 to 74 Years | 10 (100.0%) | 0 (0.0%) |
| 75 Years and over | 10 (100.0%) | 12 (100.0%) |
| Total | 69 (71.1%) | 75 (77.3%) |
Income Below Poverty Among Married-Couple Families in Guinda
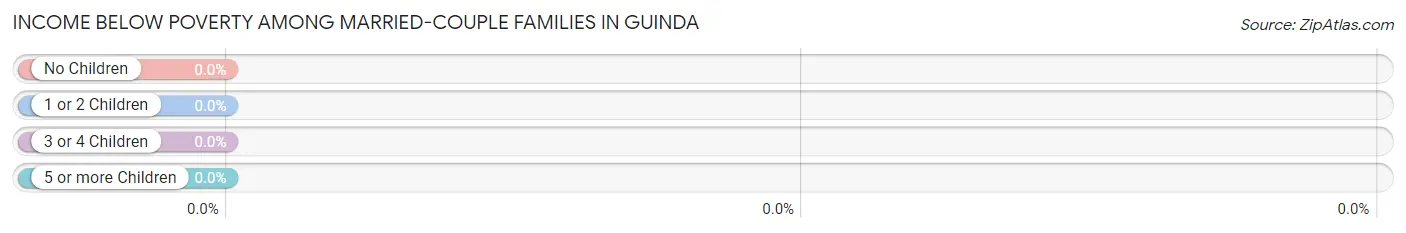
| Children | Above Poverty | Below Poverty |
| No Children | 53 (100.0%) | 0 (0.0%) |
| 1 or 2 Children | 0 (0.0%) | 0 (0.0%) |
| 3 or 4 Children | 0 (0.0%) | 0 (0.0%) |
| 5 or more Children | 0 (0.0%) | 0 (0.0%) |
| Total | 53 (100.0%) | 0 (0.0%) |
Income Below Poverty Among Single-Parent Households in Guinda
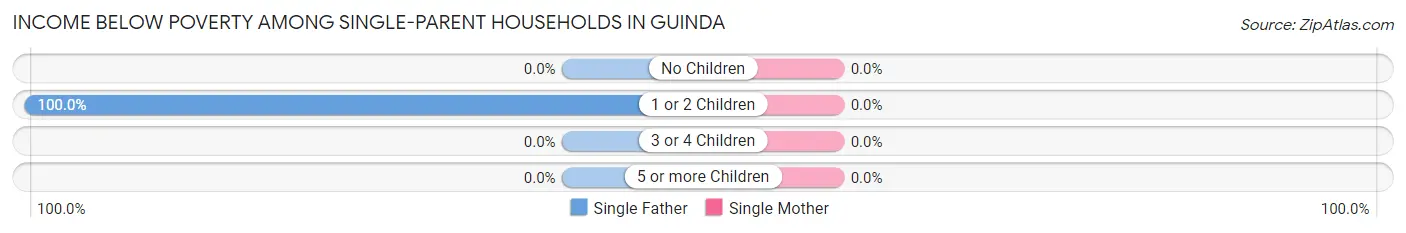
| Children | Single Father | Single Mother |
| No Children | 0 (0.0%) | 0 (0.0%) |
| 1 or 2 Children | 16 (100.0%) | 0 (0.0%) |
| 3 or 4 Children | 0 (0.0%) | 0 (0.0%) |
| 5 or more Children | 0 (0.0%) | 0 (0.0%) |
| Total | 16 (100.0%) | 0 (0.0%) |
Income Below Poverty Among Married-Couple vs Single-Parent Households in Guinda
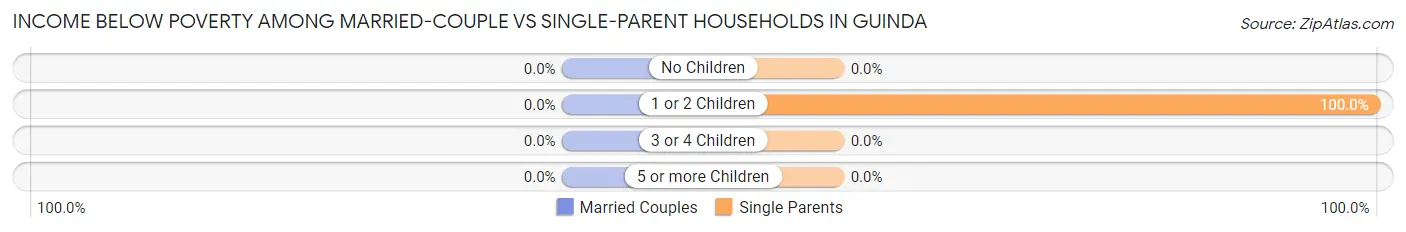
| Children | Married-Couple Families | Single-Parent Households |
| No Children | 0 (0.0%) | 0 (0.0%) |
| 1 or 2 Children | 0 (0.0%) | 16 (100.0%) |
| 3 or 4 Children | 0 (0.0%) | 0 (0.0%) |
| 5 or more Children | 0 (0.0%) | 0 (0.0%) |
| Total | 0 (0.0%) | 16 (100.0%) |
Race in Guinda
The most populous races in Guinda are White / Caucasian (89 | 45.9%), Some other Race (64 | 33.0%), and Two or more Races (41 | 21.1%).
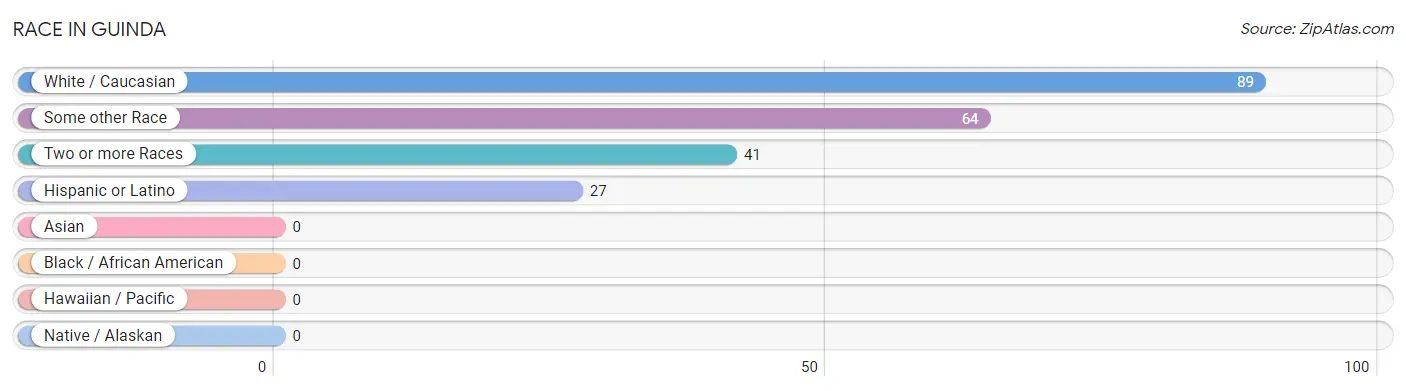
| Race | # Population | % Population |
| Asian | 0 | 0.0% |
| Black / African American | 0 | 0.0% |
| Hawaiian / Pacific | 0 | 0.0% |
| Hispanic or Latino | 27 | 13.9% |
| Native / Alaskan | 0 | 0.0% |
| White / Caucasian | 89 | 45.9% |
| Two or more Races | 41 | 21.1% |
| Some other Race | 64 | 33.0% |
| Total | 194 | 100.0% |
Ancestry in Guinda
The most populous ancestries reported in Guinda are American (64 | 33.0%), English (51 | 26.3%), Italian (34 | 17.5%), Irish (33 | 17.0%), and German (31 | 16.0%), together accounting for 109.8% of all Guinda residents.
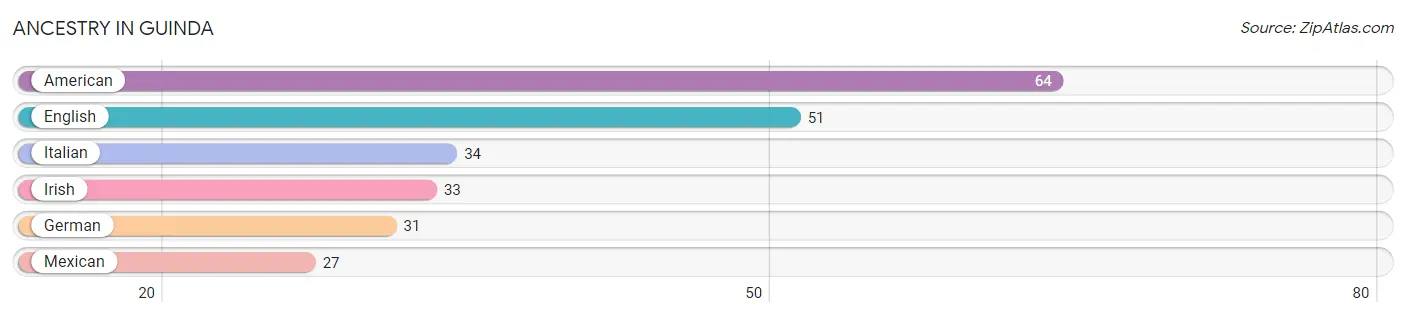
| Ancestry | # Population | % Population |
| American | 64 | 33.0% |
| English | 51 | 26.3% |
| German | 31 | 16.0% |
| Irish | 33 | 17.0% |
| Italian | 34 | 17.5% |
| Mexican | 27 | 13.9% | View All 6 Rows |
Immigrants in Guinda
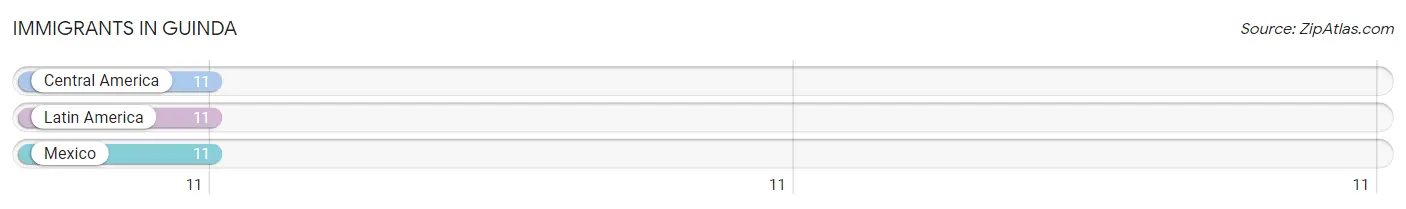
The most numerous immigrant groups reported in Guinda came from Central America (11 | 5.7%), Latin America (11 | 5.7%), and Mexico (11 | 5.7%), together accounting for 17.0% of all Guinda residents.
| Immigration Origin | # Population | % Population |
| Central America | 11 | 5.7% |
| Latin America | 11 | 5.7% |
| Mexico | 11 | 5.7% | View All 3 Rows |
Sex and Age in Guinda
Sex and Age in Guinda
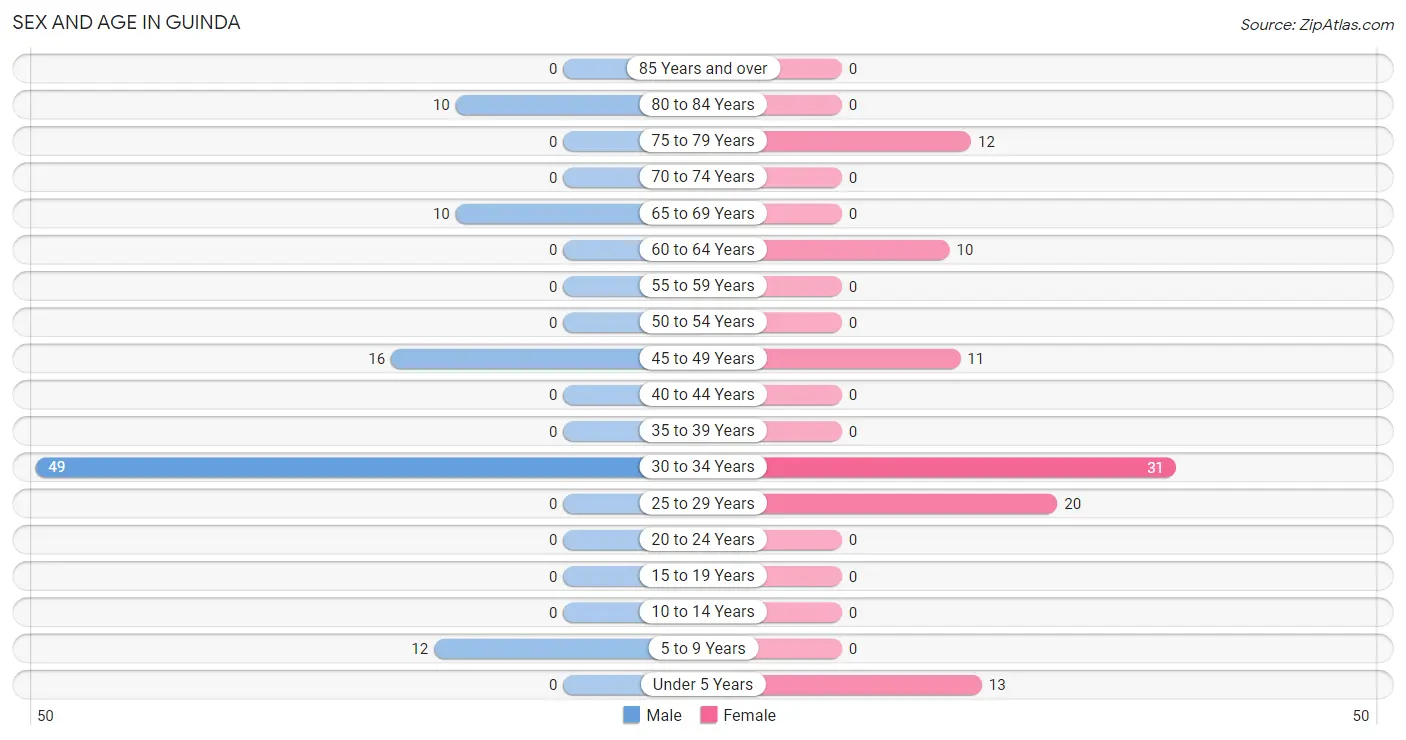
The most populous age groups in Guinda are 30 to 34 Years (49 | 50.5%) for men and 30 to 34 Years (31 | 32.0%) for women.
| Age Bracket | Male | Female |
| Under 5 Years | 0 (0.0%) | 13 (13.4%) |
| 5 to 9 Years | 12 (12.4%) | 0 (0.0%) |
| 10 to 14 Years | 0 (0.0%) | 0 (0.0%) |
| 15 to 19 Years | 0 (0.0%) | 0 (0.0%) |
| 20 to 24 Years | 0 (0.0%) | 0 (0.0%) |
| 25 to 29 Years | 0 (0.0%) | 20 (20.6%) |
| 30 to 34 Years | 49 (50.5%) | 31 (32.0%) |
| 35 to 39 Years | 0 (0.0%) | 0 (0.0%) |
| 40 to 44 Years | 0 (0.0%) | 0 (0.0%) |
| 45 to 49 Years | 16 (16.5%) | 11 (11.3%) |
| 50 to 54 Years | 0 (0.0%) | 0 (0.0%) |
| 55 to 59 Years | 0 (0.0%) | 0 (0.0%) |
| 60 to 64 Years | 0 (0.0%) | 10 (10.3%) |
| 65 to 69 Years | 10 (10.3%) | 0 (0.0%) |
| 70 to 74 Years | 0 (0.0%) | 0 (0.0%) |
| 75 to 79 Years | 0 (0.0%) | 12 (12.4%) |
| 80 to 84 Years | 10 (10.3%) | 0 (0.0%) |
| 85 Years and over | 0 (0.0%) | 0 (0.0%) |
| Total | 97 (100.0%) | 97 (100.0%) |
Families and Households in Guinda
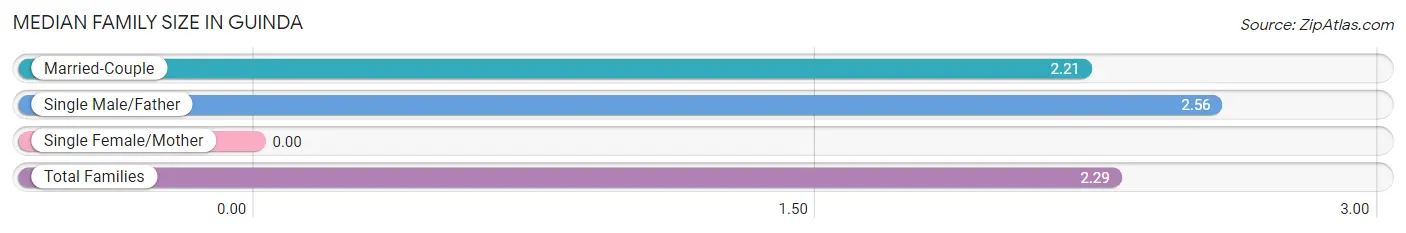
Median Family Size in Guinda
| Family Type | # Families | Family Size |
| Married-Couple | 53 (76.8%) | 2.21 |
| Single Male/Father | 16 (23.2%) | 2.56 |
| Single Female/Mother | 0 (0.0%) | - |
| Total Families | 69 (100.0%) | 2.29 |
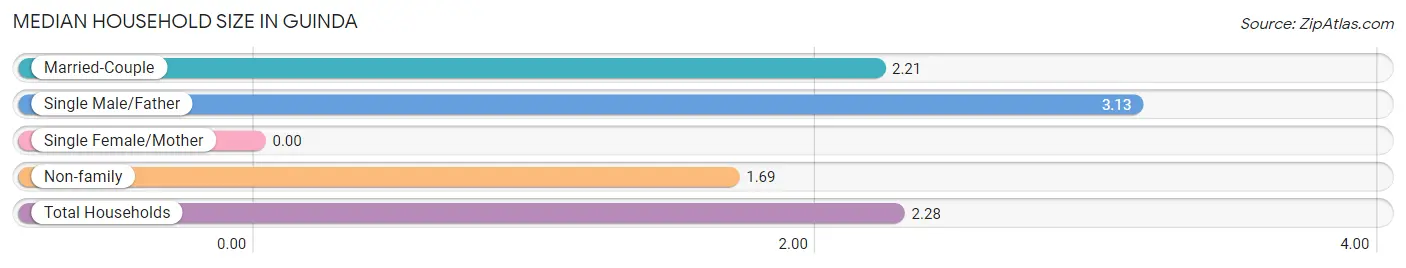
Median Household Size in Guinda
| Household Type | # Households | Household Size |
| Married-Couple | 53 (62.4%) | 2.21 |
| Single Male/Father | 16 (18.8%) | 3.13 |
| Single Female/Mother | 0 (0.0%) | - |
| Non-family | 16 (18.8%) | 1.69 |
| Total Households | 85 (100.0%) | 2.28 |
Household Size by Marriage Status in Guinda
Out of a total of 85 households in Guinda, 69 (81.2%) are family households, while 16 (18.8%) are nonfamily households. The most numerous type of family households are 2-person households, comprising 43, and the most common type of nonfamily households are 2-person households, comprising 16.
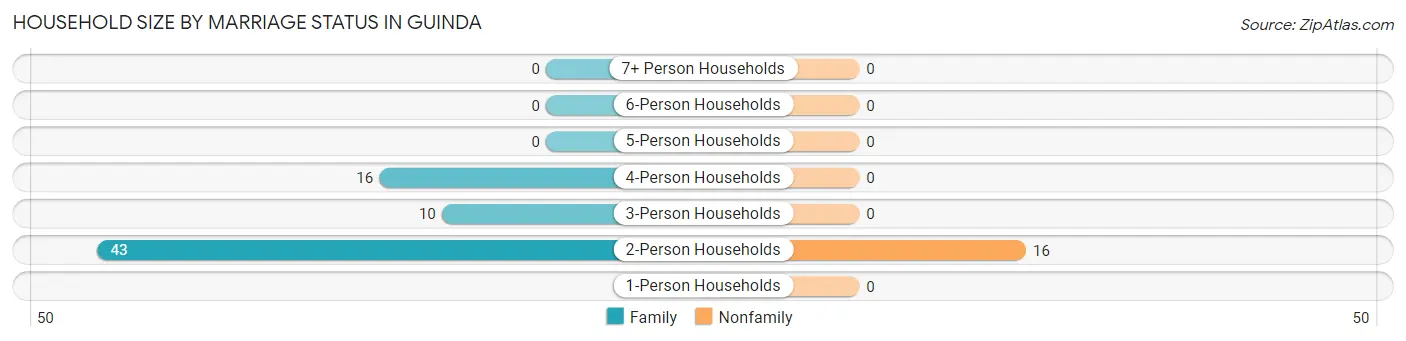
| Household Size | Family Households | Nonfamily Households |
| 1-Person Households | - | 0 (0.0%) |
| 2-Person Households | 43 (50.6%) | 16 (18.8%) |
| 3-Person Households | 10 (11.8%) | 0 (0.0%) |
| 4-Person Households | 16 (18.8%) | 0 (0.0%) |
| 5-Person Households | 0 (0.0%) | 0 (0.0%) |
| 6-Person Households | 0 (0.0%) | 0 (0.0%) |
| 7+ Person Households | 0 (0.0%) | 0 (0.0%) |
| Total | 69 (81.2%) | 16 (18.8%) |
Female Fertility in Guinda
Fertility by Age in Guinda
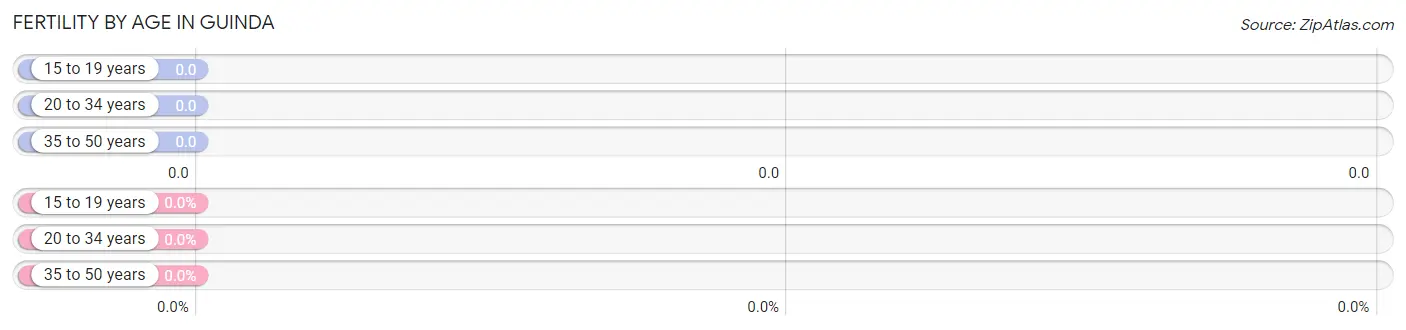
| Age Bracket | Women with Births | Births / 1,000 Women |
| 15 to 19 years | 0 (0.0%) | 0.0 |
| 20 to 34 years | 0 (0.0%) | 0.0 |
| 35 to 50 years | 0 (0.0%) | 0.0 |
| Total | 0 (0.0%) | 0.0 |
Fertility by Age by Marriage Status in Guinda
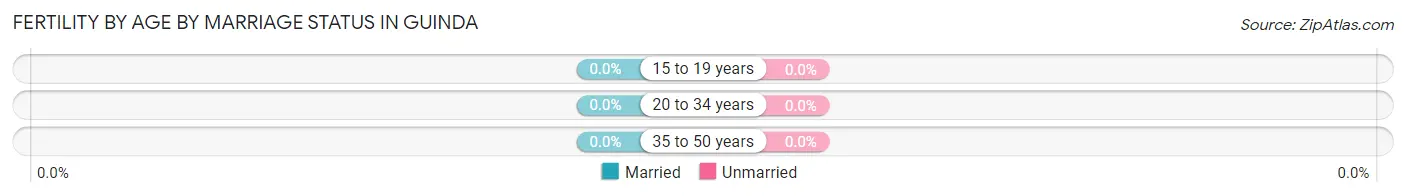
| Age Bracket | Married | Unmarried |
| 15 to 19 years | 0 (0.0%) | 0 (0.0%) |
| 20 to 34 years | 0 (0.0%) | 0 (0.0%) |
| 35 to 50 years | 0 (0.0%) | 0 (0.0%) |
| Total | 0 (0.0%) | 0 (0.0%) |
Fertility by Education in Guinda
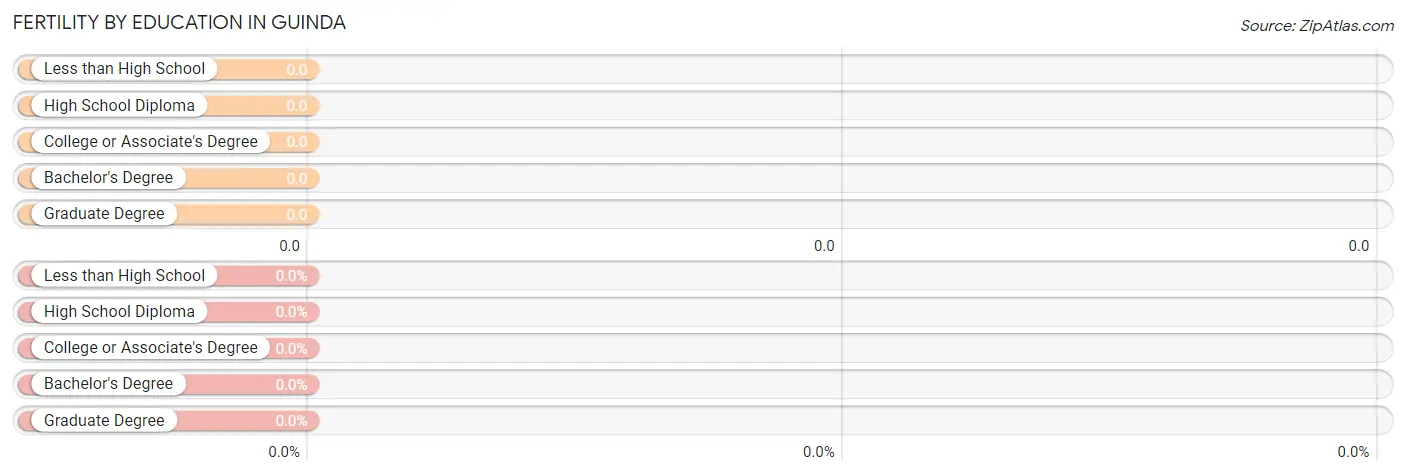
| Educational Attainment | Women with Births | Births / 1,000 Women |
| Less than High School | 0 (0.0%) | 0.0 |
| High School Diploma | 0 (0.0%) | 0.0 |
| College or Associate's Degree | 0 (0.0%) | 0.0 |
| Bachelor's Degree | 0 (0.0%) | 0.0 |
| Graduate Degree | 0 (0.0%) | 0.0 |
| Total | 0 (0.0%) | 0.0 |
Fertility by Education by Marriage Status in Guinda
| Educational Attainment | Married | Unmarried |
| Less than High School | 0 (0.0%) | 0 (0.0%) |
| High School Diploma | 0 (0.0%) | 0 (0.0%) |
| College or Associate's Degree | 0 (0.0%) | 0 (0.0%) |
| Bachelor's Degree | 0 (0.0%) | 0 (0.0%) |
| Graduate Degree | 0 (0.0%) | 0 (0.0%) |
| Total | 0 (0.0%) | 0 (0.0%) |
Employment Characteristics in Guinda
Employment by Class of Employer in Guinda
Among the 100 employed individuals in Guinda, private company employees (75 | 75.0%), federal government employees (16 | 16.0%), and not-for-profit organizations (9 | 9.0%) make up the most common classes of employment.
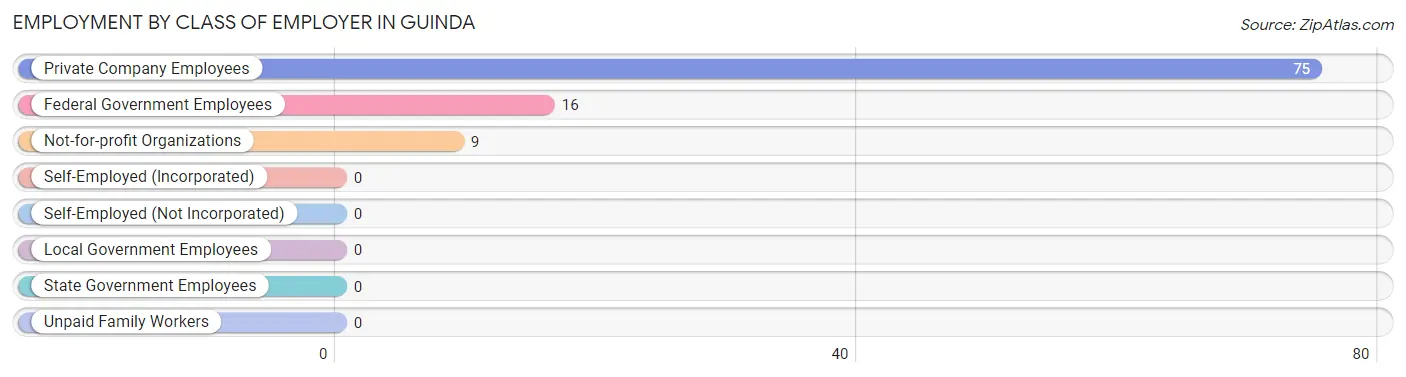
| Employer Class | # Employees | % Employees |
| Private Company Employees | 75 | 75.0% |
| Self-Employed (Incorporated) | 0 | 0.0% |
| Self-Employed (Not Incorporated) | 0 | 0.0% |
| Not-for-profit Organizations | 9 | 9.0% |
| Local Government Employees | 0 | 0.0% |
| State Government Employees | 0 | 0.0% |
| Federal Government Employees | 16 | 16.0% |
| Unpaid Family Workers | 0 | 0.0% |
| Total | 100 | 100.0% |
Employment Status by Age in Guinda
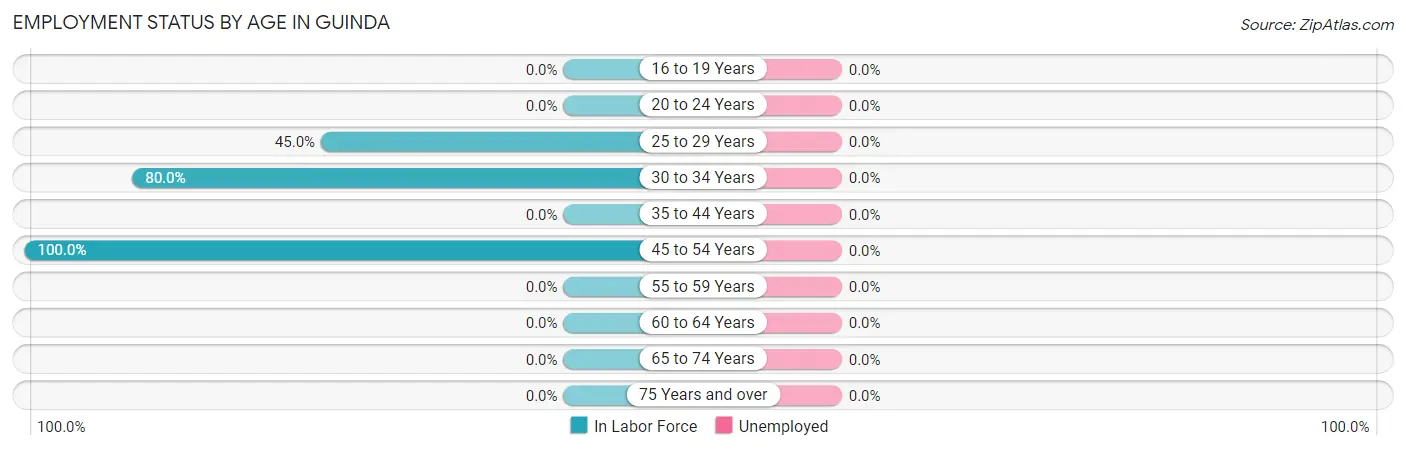
| Age Bracket | In Labor Force | Unemployed |
| 16 to 19 Years | 0 (0.0%) | 0 (0.0%) |
| 20 to 24 Years | 0 (0.0%) | 0 (0.0%) |
| 25 to 29 Years | 9 (45.0%) | 0 (0.0%) |
| 30 to 34 Years | 64 (80.0%) | 0 (0.0%) |
| 35 to 44 Years | 0 (0.0%) | 0 (0.0%) |
| 45 to 54 Years | 27 (100.0%) | 0 (0.0%) |
| 55 to 59 Years | 0 (0.0%) | 0 (0.0%) |
| 60 to 64 Years | 0 (0.0%) | 0 (0.0%) |
| 65 to 74 Years | 0 (0.0%) | 0 (0.0%) |
| 75 Years and over | 0 (0.0%) | 0 (0.0%) |
| Total | 100 (59.2%) | 0 (0.0%) |
Employment Status by Educational Attainment in Guinda
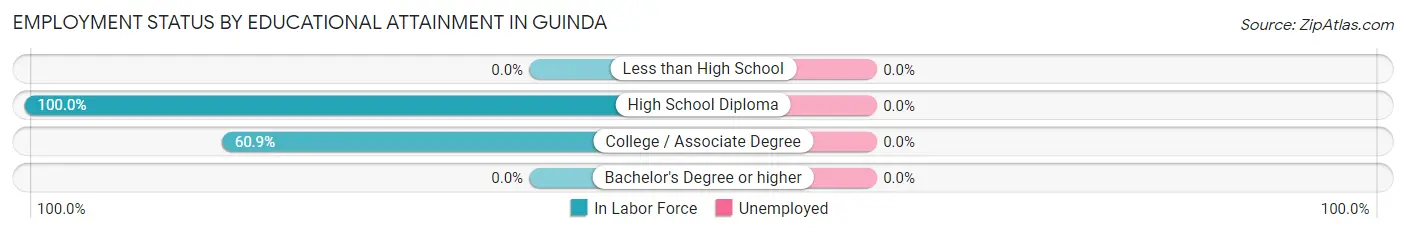
| Educational Attainment | In Labor Force | Unemployed |
| Less than High School | 0 (0.0%) | 0 (0.0%) |
| High School Diploma | 58 (100.0%) | 0 (0.0%) |
| College / Associate Degree | 42 (60.9%) | 0 (0.0%) |
| Bachelor's Degree or higher | 0 (0.0%) | 0 (0.0%) |
| Total | 100 (73.0%) | 0 (0.0%) |
Employment Occupations by Sex in Guinda
Management, Business, Science and Arts Occupations
The most common Management, Business, Science and Arts occupations in Guinda are , and Management (11 | 11.0%).
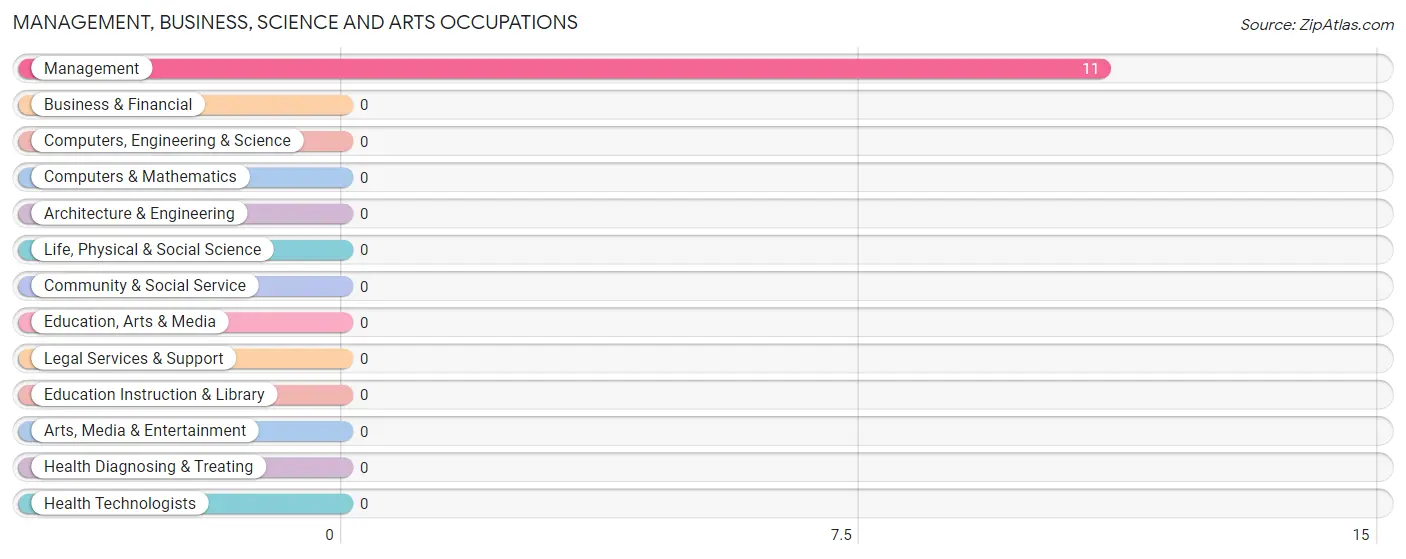
Management, Business, Science and Arts Occupations by Sex
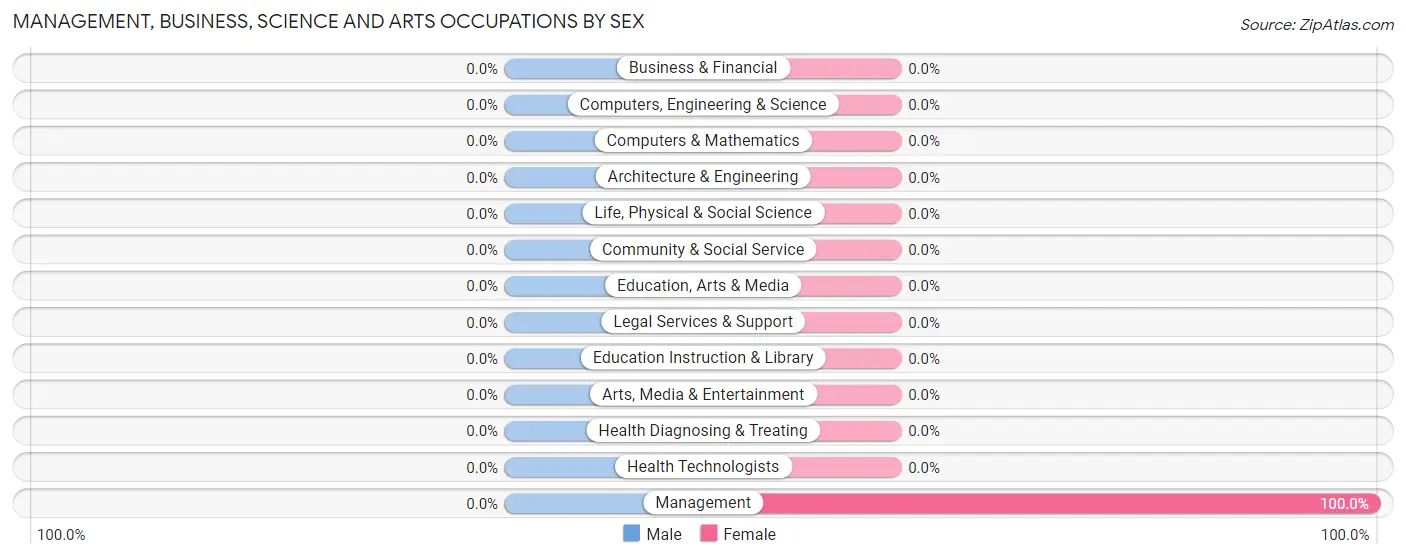
| Occupation | Male | Female |
| Management | 0 (0.0%) | 11 (100.0%) |
| Business & Financial | 0 (0.0%) | 0 (0.0%) |
| Computers, Engineering & Science | 0 (0.0%) | 0 (0.0%) |
| Computers & Mathematics | 0 (0.0%) | 0 (0.0%) |
| Architecture & Engineering | 0 (0.0%) | 0 (0.0%) |
| Life, Physical & Social Science | 0 (0.0%) | 0 (0.0%) |
| Community & Social Service | 0 (0.0%) | 0 (0.0%) |
| Education, Arts & Media | 0 (0.0%) | 0 (0.0%) |
| Legal Services & Support | 0 (0.0%) | 0 (0.0%) |
| Education Instruction & Library | 0 (0.0%) | 0 (0.0%) |
| Arts, Media & Entertainment | 0 (0.0%) | 0 (0.0%) |
| Health Diagnosing & Treating | 0 (0.0%) | 0 (0.0%) |
| Health Technologists | 0 (0.0%) | 0 (0.0%) |
| Total (Category) | 0 (0.0%) | 11 (100.0%) |
| Total (Overall) | 49 (49.0%) | 51 (51.0%) |
Services Occupations
The most common Services occupations in Guinda are , and Cleaning & Maintenance (9 | 9.0%).
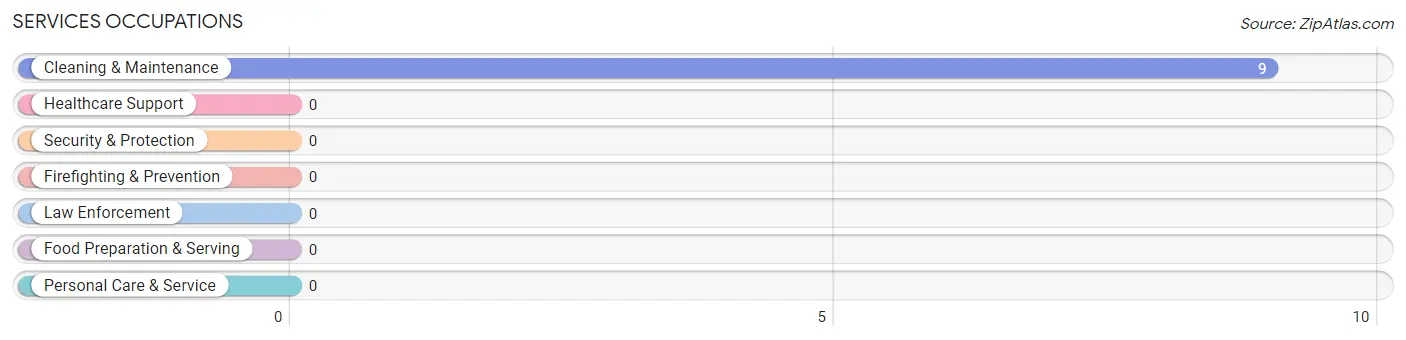
Services Occupations by Sex
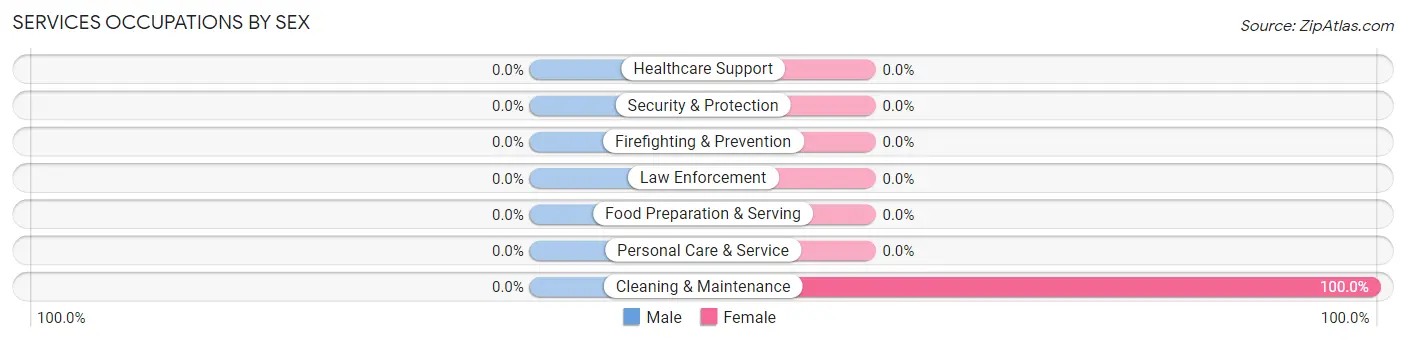
| Occupation | Male | Female |
| Healthcare Support | 0 (0.0%) | 0 (0.0%) |
| Security & Protection | 0 (0.0%) | 0 (0.0%) |
| Firefighting & Prevention | 0 (0.0%) | 0 (0.0%) |
| Law Enforcement | 0 (0.0%) | 0 (0.0%) |
| Food Preparation & Serving | 0 (0.0%) | 0 (0.0%) |
| Cleaning & Maintenance | 0 (0.0%) | 9 (100.0%) |
| Personal Care & Service | 0 (0.0%) | 0 (0.0%) |
| Total (Category) | 0 (0.0%) | 9 (100.0%) |
| Total (Overall) | 49 (49.0%) | 51 (51.0%) |
Sales and Office Occupations
The most common Sales and Office occupations in Guinda are , and Office & Administration (47 | 47.0%).
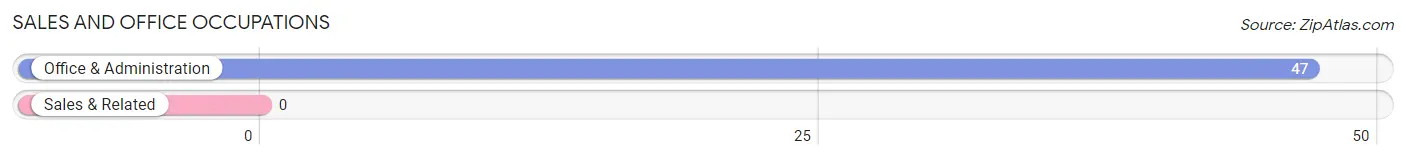
Sales and Office Occupations by Sex
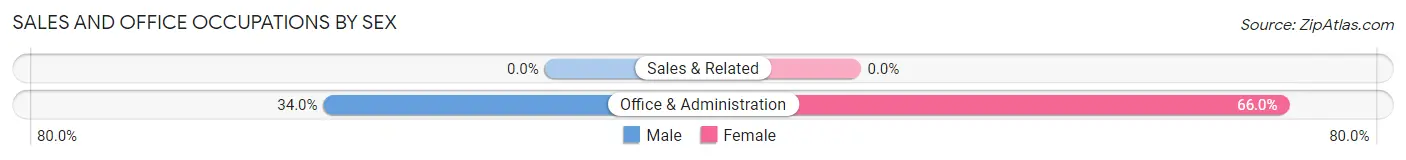
| Occupation | Male | Female |
| Sales & Related | 0 (0.0%) | 0 (0.0%) |
| Office & Administration | 16 (34.0%) | 31 (66.0%) |
| Total (Category) | 16 (34.0%) | 31 (66.0%) |
| Total (Overall) | 49 (49.0%) | 51 (51.0%) |
Natural Resources, Construction and Maintenance Occupations
The most common Natural Resources, Construction and Maintenance occupations in Guinda are , and Construction & Extraction (33 | 33.0%).
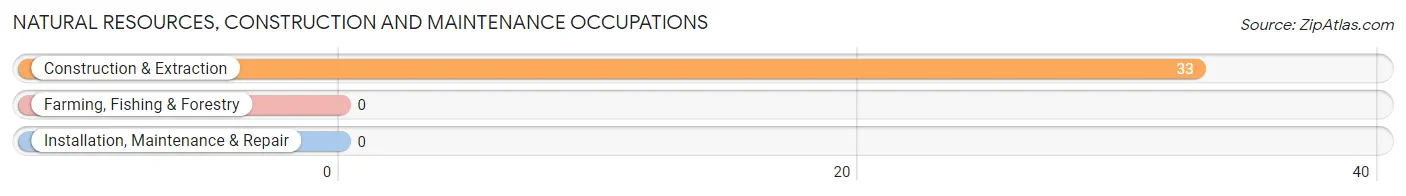
Natural Resources, Construction and Maintenance Occupations by Sex
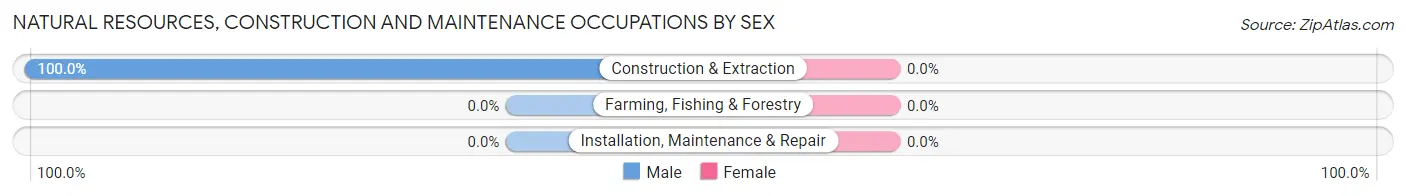
| Occupation | Male | Female |
| Farming, Fishing & Forestry | 0 (0.0%) | 0 (0.0%) |
| Construction & Extraction | 33 (100.0%) | 0 (0.0%) |
| Installation, Maintenance & Repair | 0 (0.0%) | 0 (0.0%) |
| Total (Category) | 33 (100.0%) | 0 (0.0%) |
| Total (Overall) | 49 (49.0%) | 51 (51.0%) |
Production, Transportation and Moving Occupations
Production, Transportation and Moving Occupations by Sex
| Occupation | Male | Female |
| Production | 0 (0.0%) | 0 (0.0%) |
| Transportation | 0 (0.0%) | 0 (0.0%) |
| Material Moving | 0 (0.0%) | 0 (0.0%) |
| Total (Category) | 0 (0.0%) | 0 (0.0%) |
| Total (Overall) | 49 (49.0%) | 51 (51.0%) |
Employment Industries by Sex in Guinda
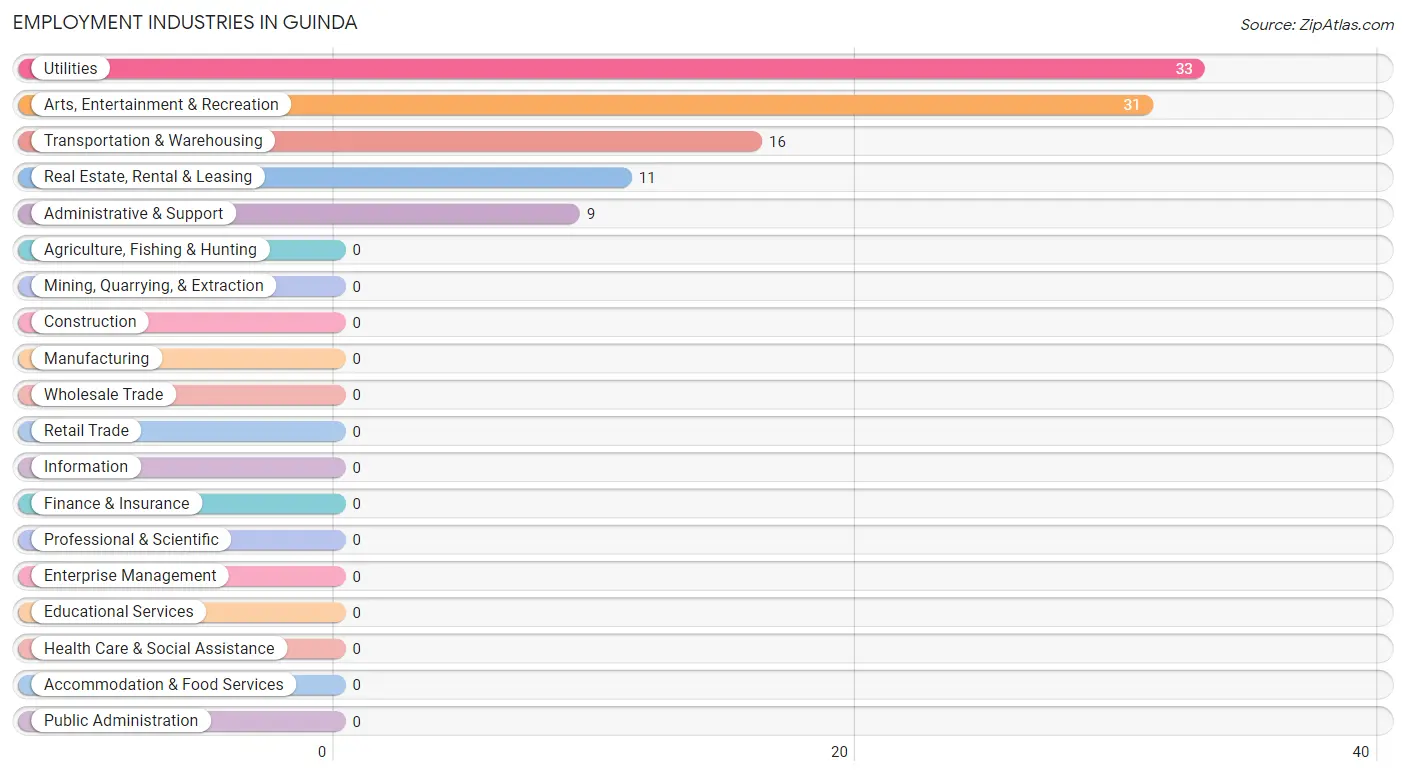
Employment Industries in Guinda
The major employment industries in Guinda include Utilities (33 | 33.0%), Arts, Entertainment & Recreation (31 | 31.0%), Transportation & Warehousing (16 | 16.0%), Real Estate, Rental & Leasing (11 | 11.0%), and Administrative & Support (9 | 9.0%).
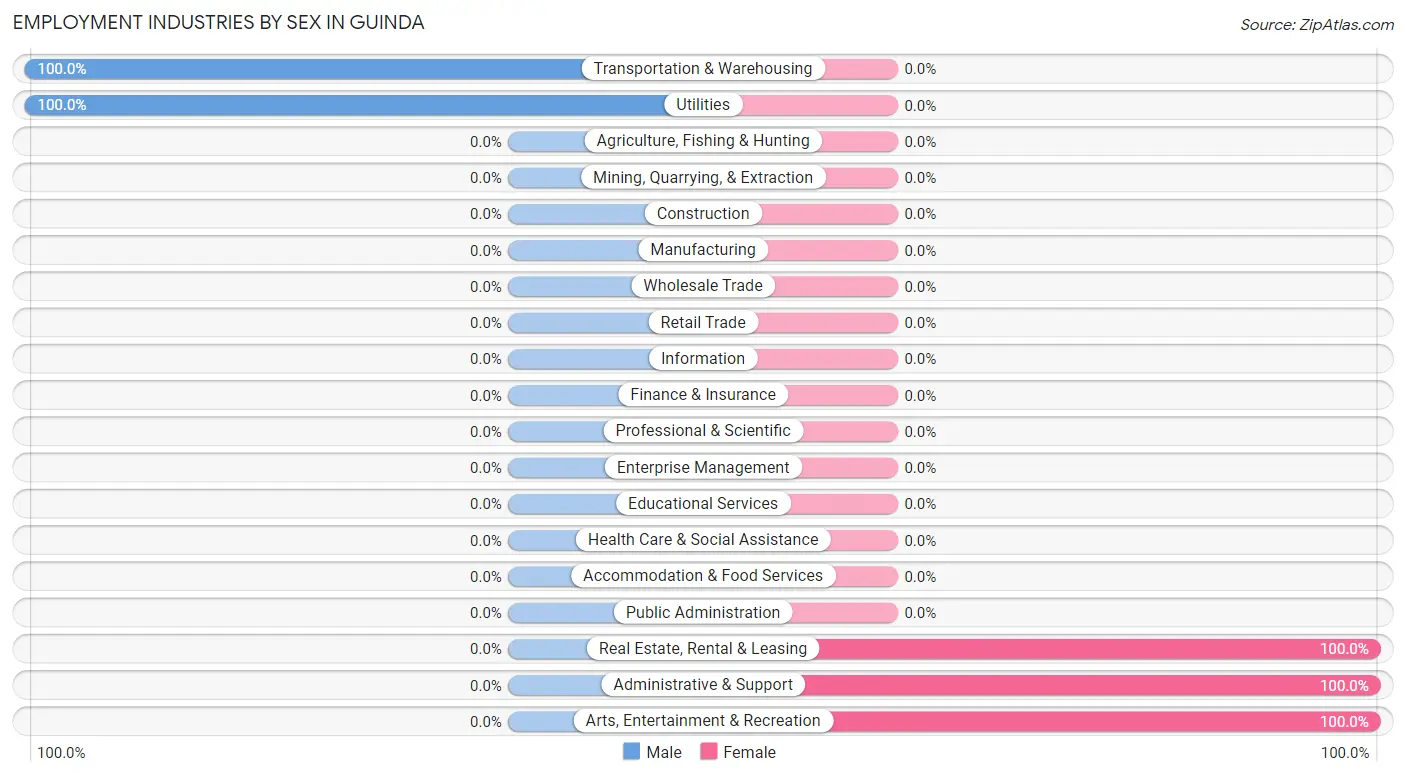
Employment Industries by Sex in Guinda
The Guinda industries that see more men than women are Transportation & Warehousing (100.0%), and Utilities (100.0%), whereas the industries that tend to have a higher number of women are Real Estate, Rental & Leasing (100.0%), Administrative & Support (100.0%), and Arts, Entertainment & Recreation (100.0%).
| Industry | Male | Female |
| Agriculture, Fishing & Hunting | 0 (0.0%) | 0 (0.0%) |
| Mining, Quarrying, & Extraction | 0 (0.0%) | 0 (0.0%) |
| Construction | 0 (0.0%) | 0 (0.0%) |
| Manufacturing | 0 (0.0%) | 0 (0.0%) |
| Wholesale Trade | 0 (0.0%) | 0 (0.0%) |
| Retail Trade | 0 (0.0%) | 0 (0.0%) |
| Transportation & Warehousing | 16 (100.0%) | 0 (0.0%) |
| Utilities | 33 (100.0%) | 0 (0.0%) |
| Information | 0 (0.0%) | 0 (0.0%) |
| Finance & Insurance | 0 (0.0%) | 0 (0.0%) |
| Real Estate, Rental & Leasing | 0 (0.0%) | 11 (100.0%) |
| Professional & Scientific | 0 (0.0%) | 0 (0.0%) |
| Enterprise Management | 0 (0.0%) | 0 (0.0%) |
| Administrative & Support | 0 (0.0%) | 9 (100.0%) |
| Educational Services | 0 (0.0%) | 0 (0.0%) |
| Health Care & Social Assistance | 0 (0.0%) | 0 (0.0%) |
| Arts, Entertainment & Recreation | 0 (0.0%) | 31 (100.0%) |
| Accommodation & Food Services | 0 (0.0%) | 0 (0.0%) |
| Public Administration | 0 (0.0%) | 0 (0.0%) |
| Total | 49 (49.0%) | 51 (51.0%) |
Education in Guinda
School Enrollment in Guinda
The most common levels of schooling among the 23 students in Guinda are elementary school (12 | 52.2%), and college / undergraduate (11 | 47.8%).
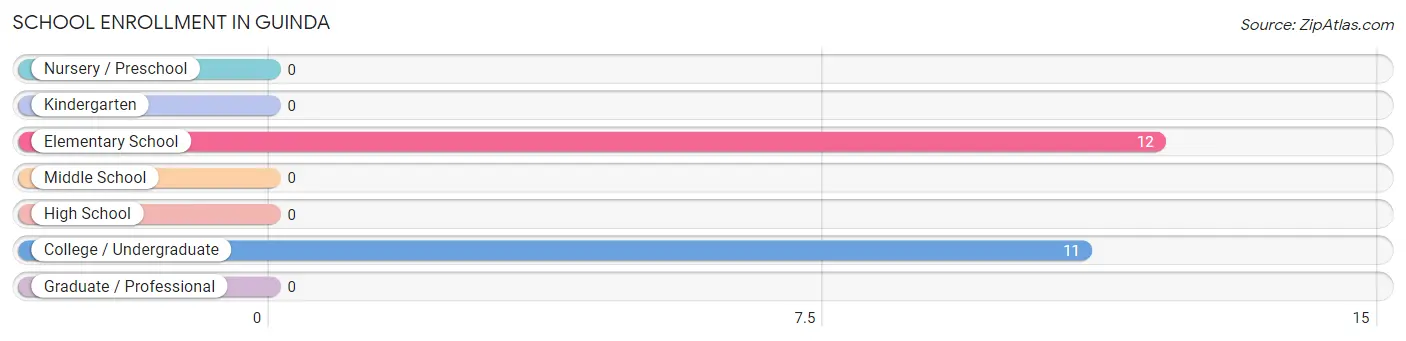
| School Level | # Students | % Students |
| Nursery / Preschool | 0 | 0.0% |
| Kindergarten | 0 | 0.0% |
| Elementary School | 12 | 52.2% |
| Middle School | 0 | 0.0% |
| High School | 0 | 0.0% |
| College / Undergraduate | 11 | 47.8% |
| Graduate / Professional | 0 | 0.0% |
| Total | 23 | 100.0% |
School Enrollment by Age by Funding Source in Guinda
Out of a total of 23 students who are enrolled in schools in Guinda, 12 (52.2%) attend a private institution, while the remaining 11 (47.8%) are enrolled in public schools. The age group of 5 to 9 year old has the highest likelihood of being enrolled in private schools, with 12 (100.0% in the age bracket) enrolled. Conversely, the age group of 25 to 34 year olds has the lowest likelihood of being enrolled in a private school, with 11 (100.0% in the age bracket) attending a public institution.
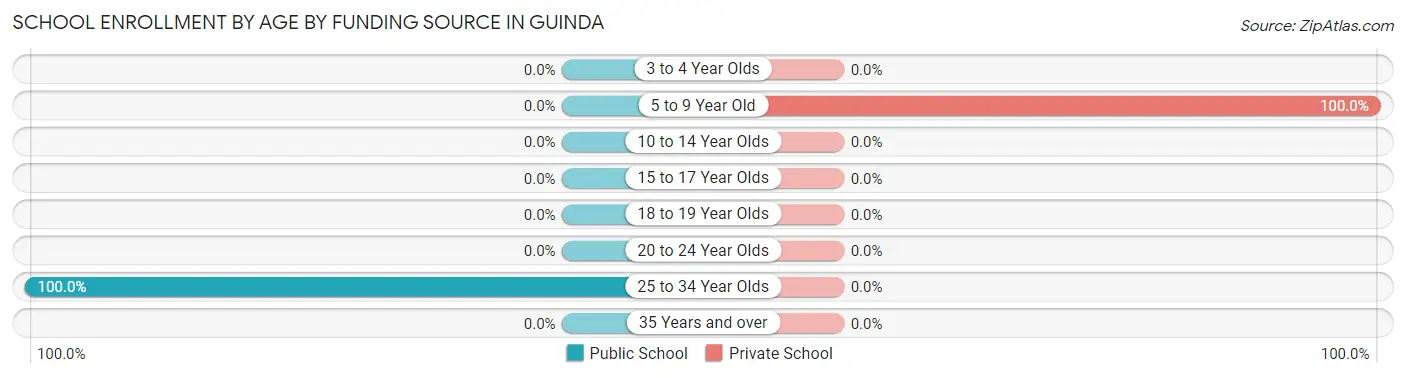
| Age Bracket | Public School | Private School |
| 3 to 4 Year Olds | 0 (0.0%) | 0 (0.0%) |
| 5 to 9 Year Old | 0 (0.0%) | 12 (100.0%) |
| 10 to 14 Year Olds | 0 (0.0%) | 0 (0.0%) |
| 15 to 17 Year Olds | 0 (0.0%) | 0 (0.0%) |
| 18 to 19 Year Olds | 0 (0.0%) | 0 (0.0%) |
| 20 to 24 Year Olds | 0 (0.0%) | 0 (0.0%) |
| 25 to 34 Year Olds | 11 (100.0%) | 0 (0.0%) |
| 35 Years and over | 0 (0.0%) | 0 (0.0%) |
| Total | 11 (47.8%) | 12 (52.2%) |
Educational Attainment by Field of Study in Guinda
, and liberal arts & history (32 | 100.0%) are the most common fields of study among 32 individuals in Guinda who have obtained a bachelor's degree or higher.
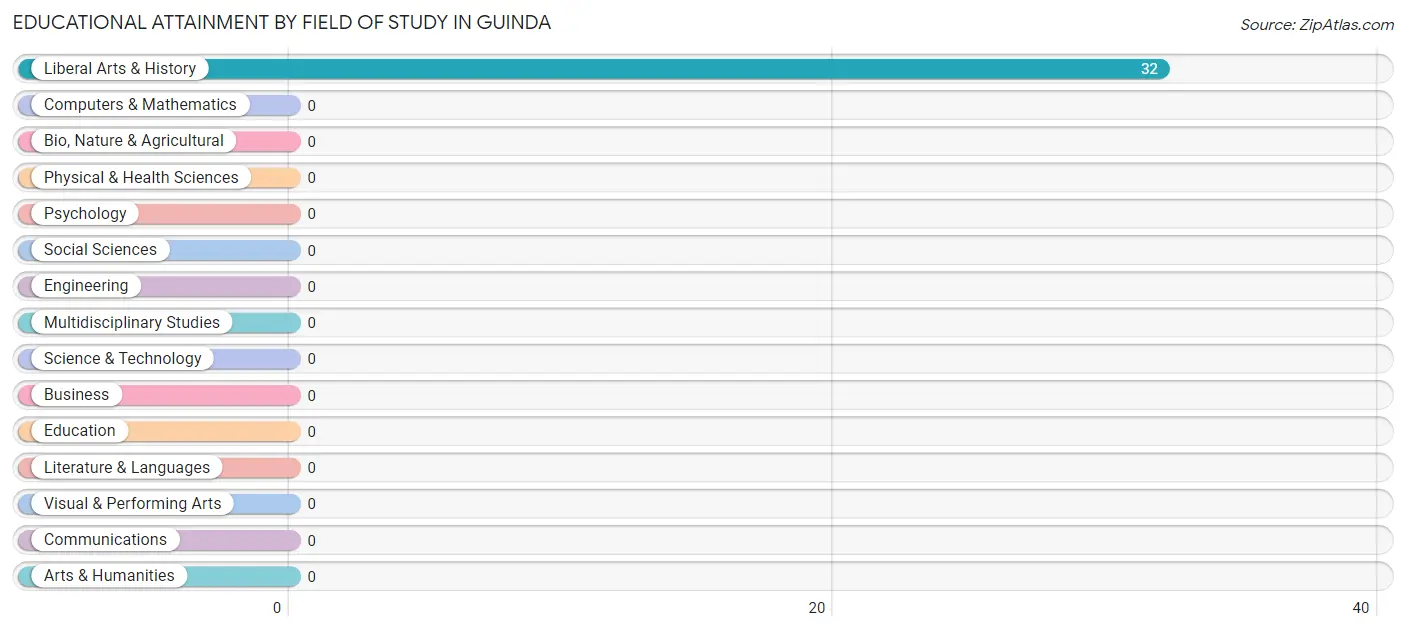
| Field of Study | # Graduates | % Graduates |
| Computers & Mathematics | 0 | 0.0% |
| Bio, Nature & Agricultural | 0 | 0.0% |
| Physical & Health Sciences | 0 | 0.0% |
| Psychology | 0 | 0.0% |
| Social Sciences | 0 | 0.0% |
| Engineering | 0 | 0.0% |
| Multidisciplinary Studies | 0 | 0.0% |
| Science & Technology | 0 | 0.0% |
| Business | 0 | 0.0% |
| Education | 0 | 0.0% |
| Literature & Languages | 0 | 0.0% |
| Liberal Arts & History | 32 | 100.0% |
| Visual & Performing Arts | 0 | 0.0% |
| Communications | 0 | 0.0% |
| Arts & Humanities | 0 | 0.0% |
| Total | 32 | 100.0% |
Transportation & Commute in Guinda
Vehicle Availability by Sex in Guinda
The most prevalent vehicle ownership categories in Guinda are males with 3 vehicles (33, accounting for 67.3%) and females with 3 vehicles (40, making up 64.7%).
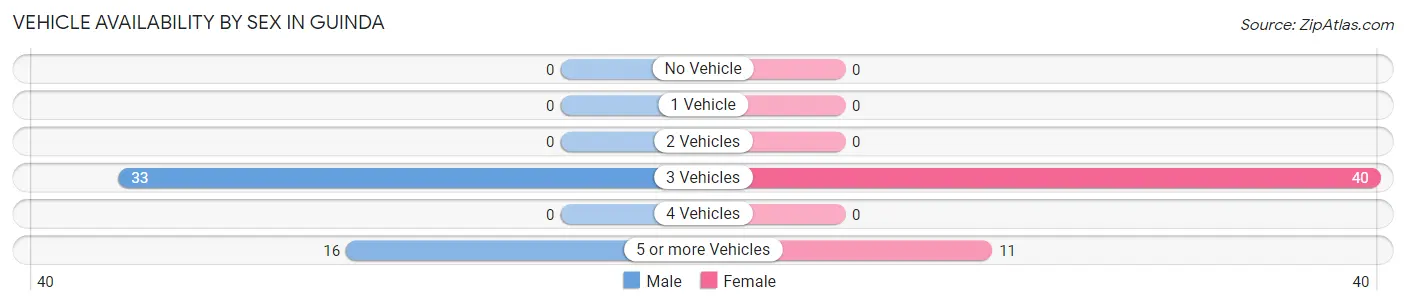
| Vehicles Available | Male | Female |
| No Vehicle | 0 (0.0%) | 0 (0.0%) |
| 1 Vehicle | 0 (0.0%) | 0 (0.0%) |
| 2 Vehicles | 0 (0.0%) | 0 (0.0%) |
| 3 Vehicles | 33 (67.3%) | 40 (78.4%) |
| 4 Vehicles | 0 (0.0%) | 0 (0.0%) |
| 5 or more Vehicles | 16 (32.7%) | 11 (21.6%) |
| Total | 49 (100.0%) | 51 (100.0%) |
Commute Time in Guinda
The most frequently occuring commute durations in Guinda are 60 to 89 minutes (33 commuters, 45.2%), 5 to 9 minutes (31 commuters, 42.5%), and 15 to 19 minutes (9 commuters, 12.3%).
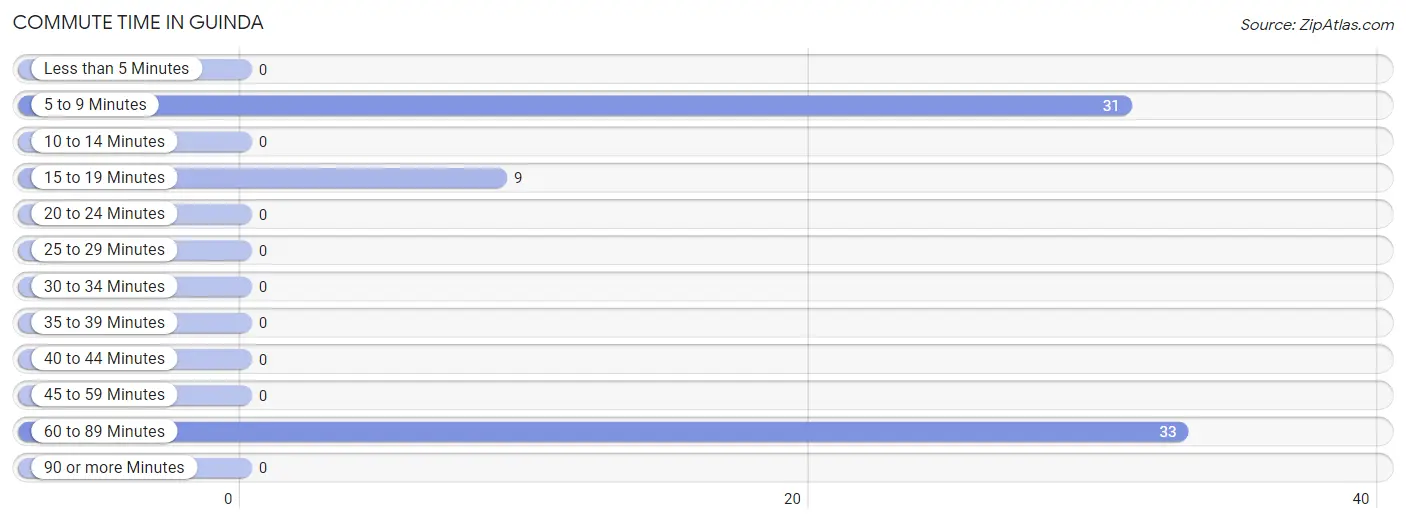
| Commute Time | # Commuters | % Commuters |
| Less than 5 Minutes | 0 | 0.0% |
| 5 to 9 Minutes | 31 | 42.5% |
| 10 to 14 Minutes | 0 | 0.0% |
| 15 to 19 Minutes | 9 | 12.3% |
| 20 to 24 Minutes | 0 | 0.0% |
| 25 to 29 Minutes | 0 | 0.0% |
| 30 to 34 Minutes | 0 | 0.0% |
| 35 to 39 Minutes | 0 | 0.0% |
| 40 to 44 Minutes | 0 | 0.0% |
| 45 to 59 Minutes | 0 | 0.0% |
| 60 to 89 Minutes | 33 | 45.2% |
| 90 or more Minutes | 0 | 0.0% |
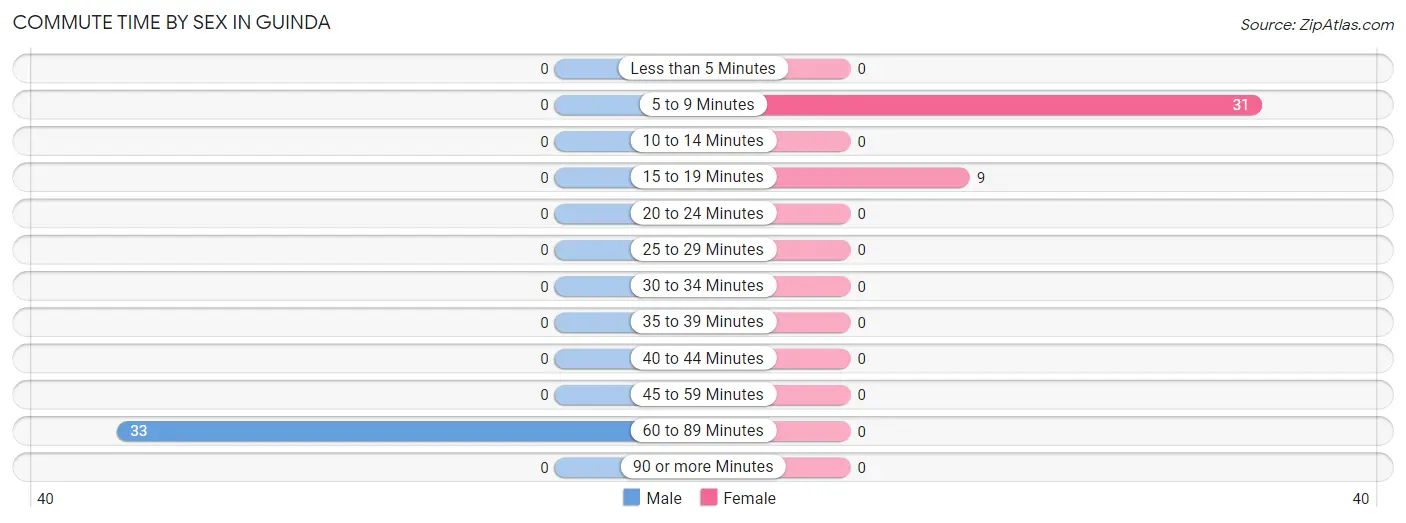
Commute Time by Sex in Guinda
The most common commute times in Guinda are 60 to 89 minutes (33 commuters, 100.0%) for males and 5 to 9 minutes (31 commuters, 77.5%) for females.
| Commute Time | Male | Female |
| Less than 5 Minutes | 0 (0.0%) | 0 (0.0%) |
| 5 to 9 Minutes | 0 (0.0%) | 31 (77.5%) |
| 10 to 14 Minutes | 0 (0.0%) | 0 (0.0%) |
| 15 to 19 Minutes | 0 (0.0%) | 9 (22.5%) |
| 20 to 24 Minutes | 0 (0.0%) | 0 (0.0%) |
| 25 to 29 Minutes | 0 (0.0%) | 0 (0.0%) |
| 30 to 34 Minutes | 0 (0.0%) | 0 (0.0%) |
| 35 to 39 Minutes | 0 (0.0%) | 0 (0.0%) |
| 40 to 44 Minutes | 0 (0.0%) | 0 (0.0%) |
| 45 to 59 Minutes | 0 (0.0%) | 0 (0.0%) |
| 60 to 89 Minutes | 33 (100.0%) | 0 (0.0%) |
| 90 or more Minutes | 0 (0.0%) | 0 (0.0%) |
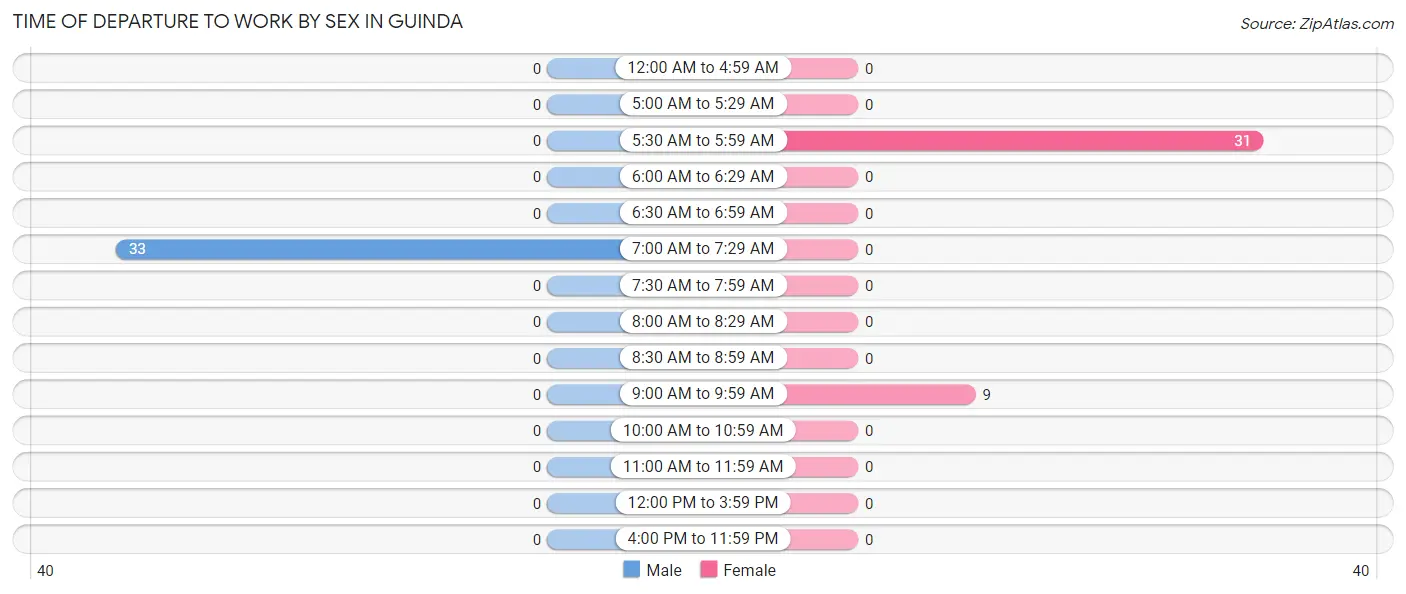
Time of Departure to Work by Sex in Guinda
The most frequent times of departure to work in Guinda are 7:00 AM to 7:29 AM (33, 100.0%) for males and 5:30 AM to 5:59 AM (31, 77.5%) for females.
| Time of Departure | Male | Female |
| 12:00 AM to 4:59 AM | 0 (0.0%) | 0 (0.0%) |
| 5:00 AM to 5:29 AM | 0 (0.0%) | 0 (0.0%) |
| 5:30 AM to 5:59 AM | 0 (0.0%) | 31 (77.5%) |
| 6:00 AM to 6:29 AM | 0 (0.0%) | 0 (0.0%) |
| 6:30 AM to 6:59 AM | 0 (0.0%) | 0 (0.0%) |
| 7:00 AM to 7:29 AM | 33 (100.0%) | 0 (0.0%) |
| 7:30 AM to 7:59 AM | 0 (0.0%) | 0 (0.0%) |
| 8:00 AM to 8:29 AM | 0 (0.0%) | 0 (0.0%) |
| 8:30 AM to 8:59 AM | 0 (0.0%) | 0 (0.0%) |
| 9:00 AM to 9:59 AM | 0 (0.0%) | 9 (22.5%) |
| 10:00 AM to 10:59 AM | 0 (0.0%) | 0 (0.0%) |
| 11:00 AM to 11:59 AM | 0 (0.0%) | 0 (0.0%) |
| 12:00 PM to 3:59 PM | 0 (0.0%) | 0 (0.0%) |
| 4:00 PM to 11:59 PM | 0 (0.0%) | 0 (0.0%) |
| Total | 33 (100.0%) | 40 (100.0%) |
Housing Occupancy in Guinda
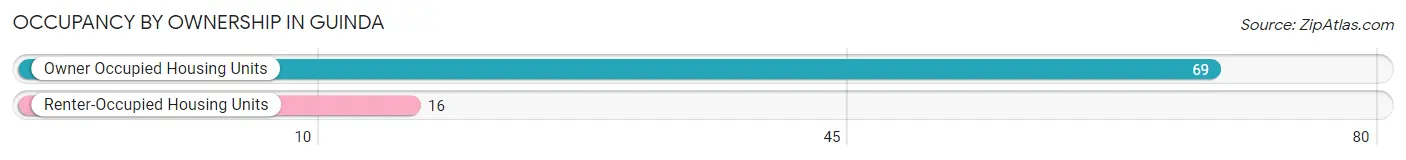
Occupancy by Ownership in Guinda
Of the total 85 dwellings in Guinda, owner-occupied units account for 69 (81.2%), while renter-occupied units make up 16 (18.8%).
| Occupancy | # Housing Units | % Housing Units |
| Owner Occupied Housing Units | 69 | 81.2% |
| Renter-Occupied Housing Units | 16 | 18.8% |
| Total Occupied Housing Units | 85 | 100.0% |
Occupancy by Household Size in Guinda
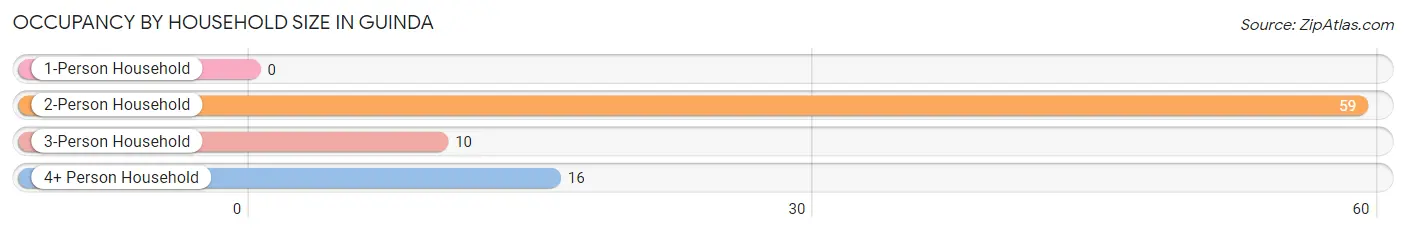
| Household Size | # Housing Units | % Housing Units |
| 1-Person Household | 0 | 0.0% |
| 2-Person Household | 59 | 69.4% |
| 3-Person Household | 10 | 11.8% |
| 4+ Person Household | 16 | 18.8% |
| Total Housing Units | 85 | 100.0% |
Occupancy by Ownership by Household Size in Guinda
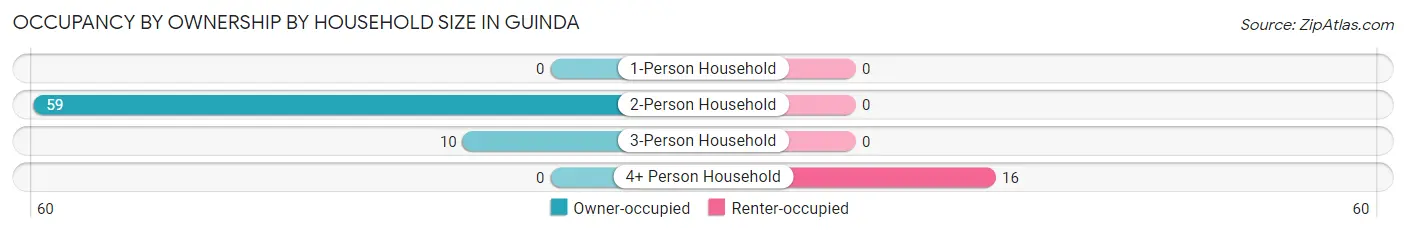
| Household Size | Owner-occupied | Renter-occupied |
| 1-Person Household | 0 (0.0%) | 0 (0.0%) |
| 2-Person Household | 59 (100.0%) | 0 (0.0%) |
| 3-Person Household | 10 (100.0%) | 0 (0.0%) |
| 4+ Person Household | 0 (0.0%) | 16 (100.0%) |
| Total Housing Units | 69 (81.2%) | 16 (18.8%) |
Occupancy by Educational Attainment in Guinda
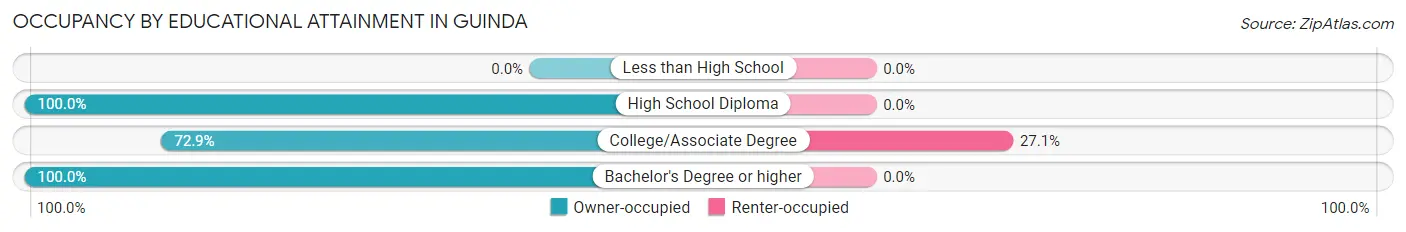
| Household Size | Owner-occupied | Renter-occupied |
| Less than High School | 0 (0.0%) | 0 (0.0%) |
| High School Diploma | 16 (100.0%) | 0 (0.0%) |
| College/Associate Degree | 43 (72.9%) | 16 (27.1%) |
| Bachelor's Degree or higher | 10 (100.0%) | 0 (0.0%) |
Occupancy by Age of Householder in Guinda
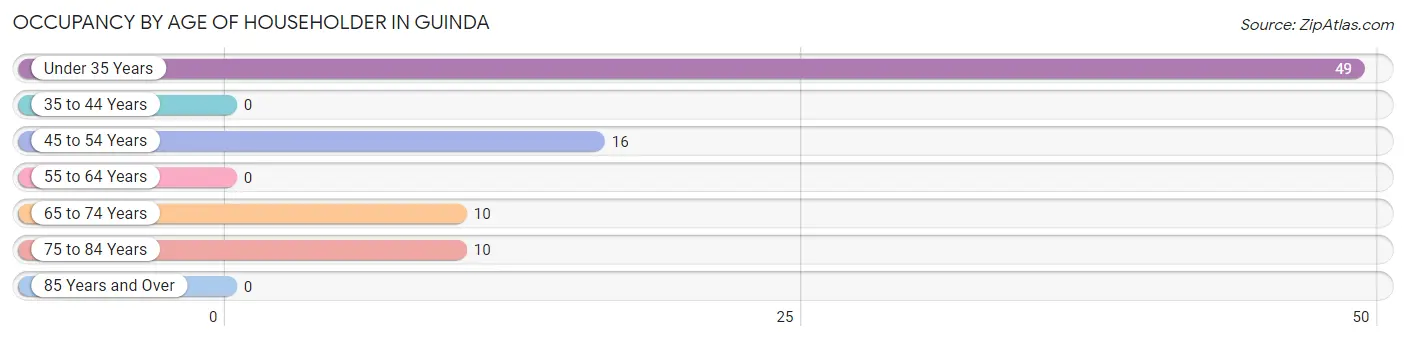
| Age Bracket | # Households | % Households |
| Under 35 Years | 49 | 57.7% |
| 35 to 44 Years | 0 | 0.0% |
| 45 to 54 Years | 16 | 18.8% |
| 55 to 64 Years | 0 | 0.0% |
| 65 to 74 Years | 10 | 11.8% |
| 75 to 84 Years | 10 | 11.8% |
| 85 Years and Over | 0 | 0.0% |
| Total | 85 | 100.0% |
Housing Finances in Guinda
Median Income by Occupancy in Guinda
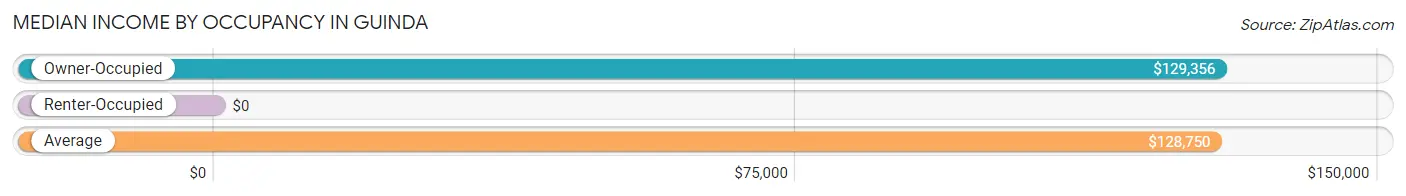
| Occupancy Type | # Households | Median Income |
| Owner-Occupied | 69 (81.2%) | $129,356 |
| Renter-Occupied | 16 (18.8%) | $0 |
| Average | 85 (100.0%) | $128,750 |
Occupancy by Householder Income Bracket in Guinda
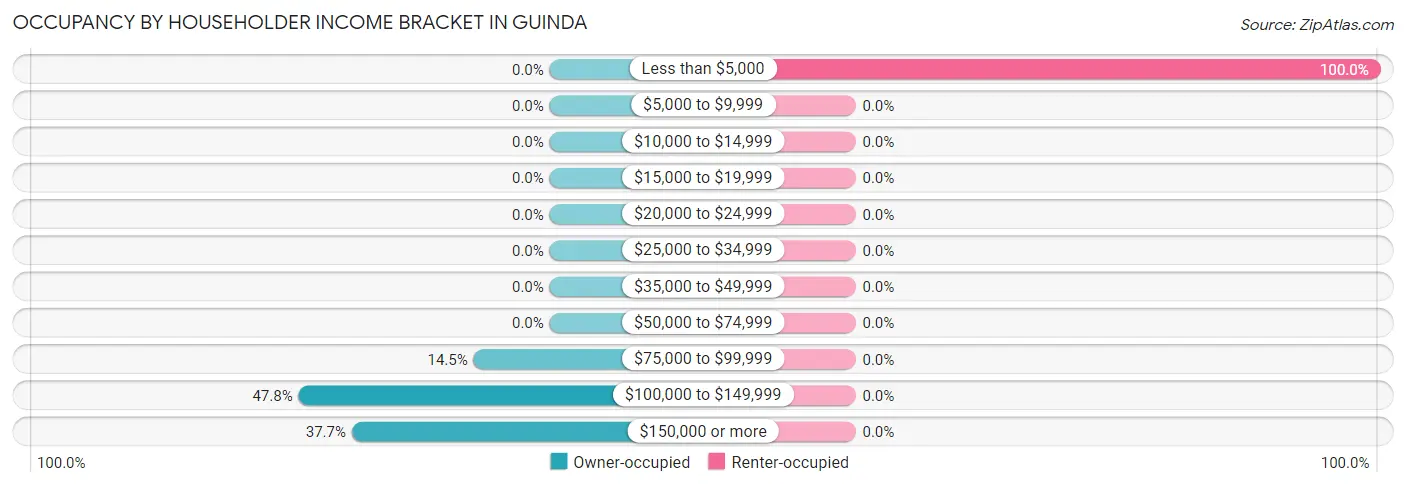
| Income Bracket | Owner-occupied | Renter-occupied |
| Less than $5,000 | 0 (0.0%) | 16 (100.0%) |
| $5,000 to $9,999 | 0 (0.0%) | 0 (0.0%) |
| $10,000 to $14,999 | 0 (0.0%) | 0 (0.0%) |
| $15,000 to $19,999 | 0 (0.0%) | 0 (0.0%) |
| $20,000 to $24,999 | 0 (0.0%) | 0 (0.0%) |
| $25,000 to $34,999 | 0 (0.0%) | 0 (0.0%) |
| $35,000 to $49,999 | 0 (0.0%) | 0 (0.0%) |
| $50,000 to $74,999 | 0 (0.0%) | 0 (0.0%) |
| $75,000 to $99,999 | 10 (14.5%) | 0 (0.0%) |
| $100,000 to $149,999 | 33 (47.8%) | 0 (0.0%) |
| $150,000 or more | 26 (37.7%) | 0 (0.0%) |
| Total | 69 (100.0%) | 16 (100.0%) |
Monthly Housing Cost Tiers in Guinda
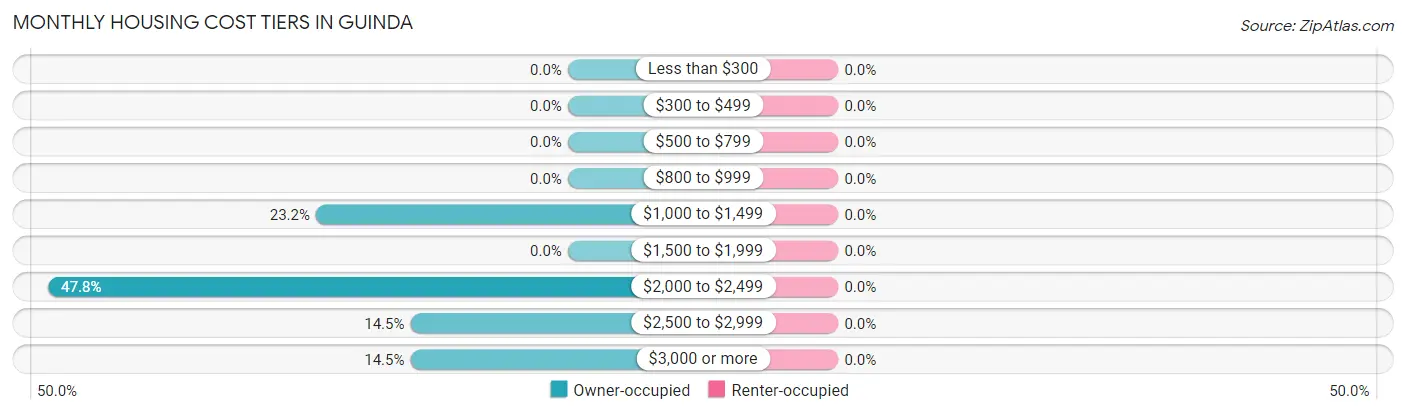
| Monthly Cost | Owner-occupied | Renter-occupied |
| Less than $300 | 0 (0.0%) | 0 (0.0%) |
| $300 to $499 | 0 (0.0%) | 0 (0.0%) |
| $500 to $799 | 0 (0.0%) | 0 (0.0%) |
| $800 to $999 | 0 (0.0%) | 0 (0.0%) |
| $1,000 to $1,499 | 16 (23.2%) | 0 (0.0%) |
| $1,500 to $1,999 | 0 (0.0%) | 0 (0.0%) |
| $2,000 to $2,499 | 33 (47.8%) | 0 (0.0%) |
| $2,500 to $2,999 | 10 (14.5%) | 0 (0.0%) |
| $3,000 or more | 10 (14.5%) | 0 (0.0%) |
| Total | 69 (100.0%) | 16 (100.0%) |
Physical Housing Characteristics in Guinda
Housing Structures in Guinda
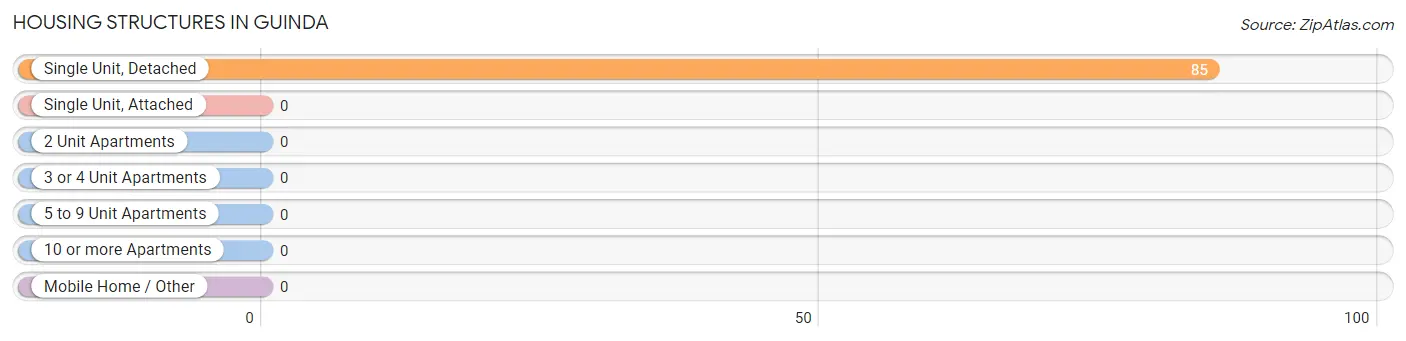
| Structure Type | # Housing Units | % Housing Units |
| Single Unit, Detached | 85 | 100.0% |
| Single Unit, Attached | 0 | 0.0% |
| 2 Unit Apartments | 0 | 0.0% |
| 3 or 4 Unit Apartments | 0 | 0.0% |
| 5 to 9 Unit Apartments | 0 | 0.0% |
| 10 or more Apartments | 0 | 0.0% |
| Mobile Home / Other | 0 | 0.0% |
| Total | 85 | 100.0% |
Housing Structures by Occupancy in Guinda
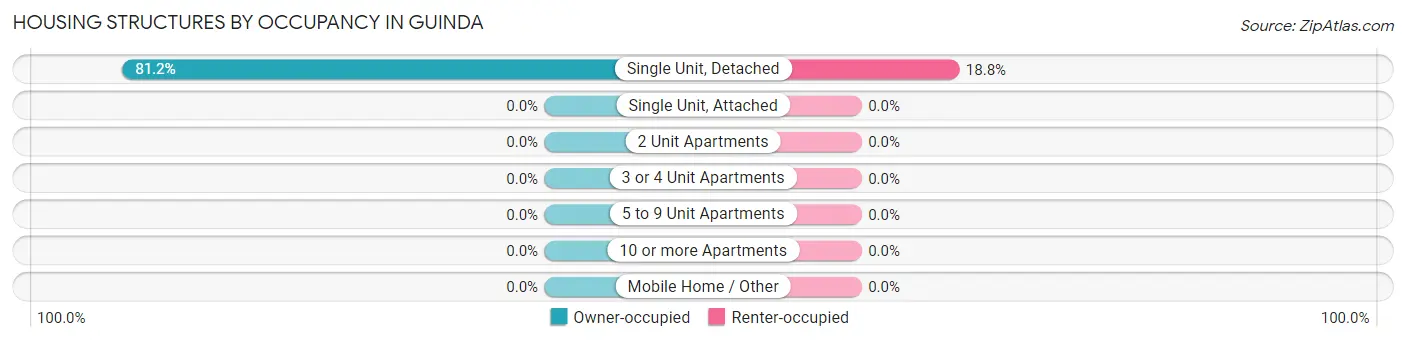
| Structure Type | Owner-occupied | Renter-occupied |
| Single Unit, Detached | 69 (81.2%) | 16 (18.8%) |
| Single Unit, Attached | 0 (0.0%) | 0 (0.0%) |
| 2 Unit Apartments | 0 (0.0%) | 0 (0.0%) |
| 3 or 4 Unit Apartments | 0 (0.0%) | 0 (0.0%) |
| 5 to 9 Unit Apartments | 0 (0.0%) | 0 (0.0%) |
| 10 or more Apartments | 0 (0.0%) | 0 (0.0%) |
| Mobile Home / Other | 0 (0.0%) | 0 (0.0%) |
| Total | 69 (81.2%) | 16 (18.8%) |
Housing Structures by Number of Rooms in Guinda
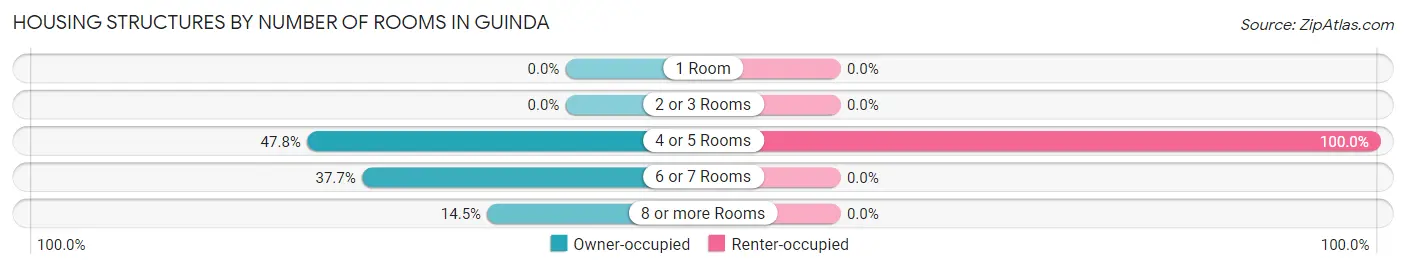
| Number of Rooms | Owner-occupied | Renter-occupied |
| 1 Room | 0 (0.0%) | 0 (0.0%) |
| 2 or 3 Rooms | 0 (0.0%) | 0 (0.0%) |
| 4 or 5 Rooms | 33 (47.8%) | 16 (100.0%) |
| 6 or 7 Rooms | 26 (37.7%) | 0 (0.0%) |
| 8 or more Rooms | 10 (14.5%) | 0 (0.0%) |
| Total | 69 (100.0%) | 16 (100.0%) |
Housing Structure by Heating Type in Guinda
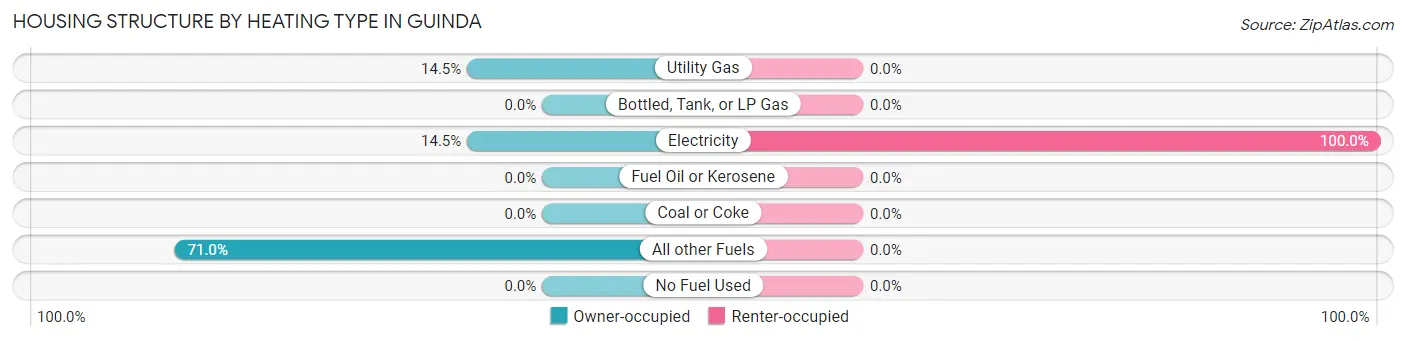
| Heating Type | Owner-occupied | Renter-occupied |
| Utility Gas | 10 (14.5%) | 0 (0.0%) |
| Bottled, Tank, or LP Gas | 0 (0.0%) | 0 (0.0%) |
| Electricity | 10 (14.5%) | 16 (100.0%) |
| Fuel Oil or Kerosene | 0 (0.0%) | 0 (0.0%) |
| Coal or Coke | 0 (0.0%) | 0 (0.0%) |
| All other Fuels | 49 (71.0%) | 0 (0.0%) |
| No Fuel Used | 0 (0.0%) | 0 (0.0%) |
| Total | 69 (100.0%) | 16 (100.0%) |
Household Vehicle Usage in Guinda
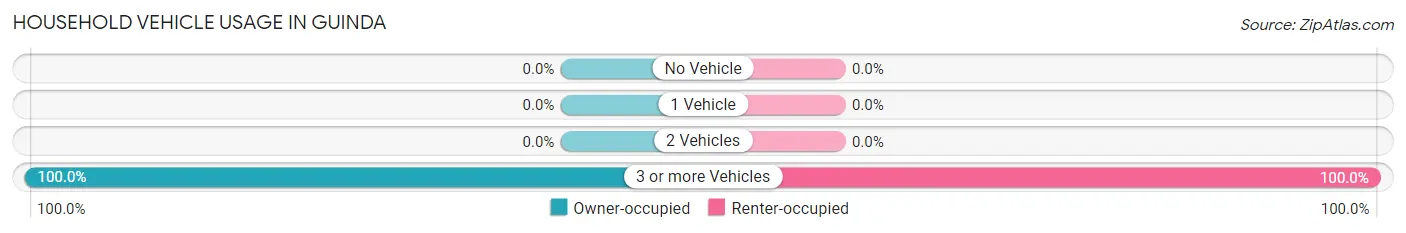
| Vehicles per Household | Owner-occupied | Renter-occupied |
| No Vehicle | 0 (0.0%) | 0 (0.0%) |
| 1 Vehicle | 0 (0.0%) | 0 (0.0%) |
| 2 Vehicles | 0 (0.0%) | 0 (0.0%) |
| 3 or more Vehicles | 69 (100.0%) | 16 (100.0%) |
| Total | 69 (100.0%) | 16 (100.0%) |
Real Estate & Mortgages in Guinda
Real Estate and Mortgage Overview in Guinda
| Characteristic | Without Mortgage | With Mortgage |
| Housing Units | 16 | 53 |
| Median Property Value | - | - |
| Median Household Income | - | - |
| Monthly Housing Costs | - | - |
| Real Estate Taxes | - | - |
Property Value by Mortgage Status in Guinda
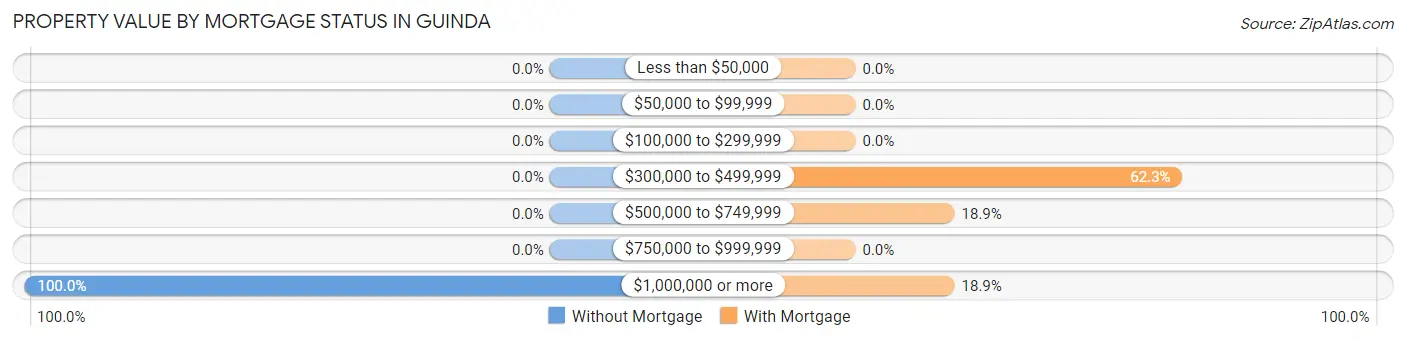
| Property Value | Without Mortgage | With Mortgage |
| Less than $50,000 | 0 (0.0%) | 0 (0.0%) |
| $50,000 to $99,999 | 0 (0.0%) | 0 (0.0%) |
| $100,000 to $299,999 | 0 (0.0%) | 0 (0.0%) |
| $300,000 to $499,999 | 0 (0.0%) | 33 (62.3%) |
| $500,000 to $749,999 | 0 (0.0%) | 10 (18.9%) |
| $750,000 to $999,999 | 0 (0.0%) | 0 (0.0%) |
| $1,000,000 or more | 16 (100.0%) | 10 (18.9%) |
| Total | 16 (100.0%) | 53 (100.0%) |
Household Income by Mortgage Status in Guinda
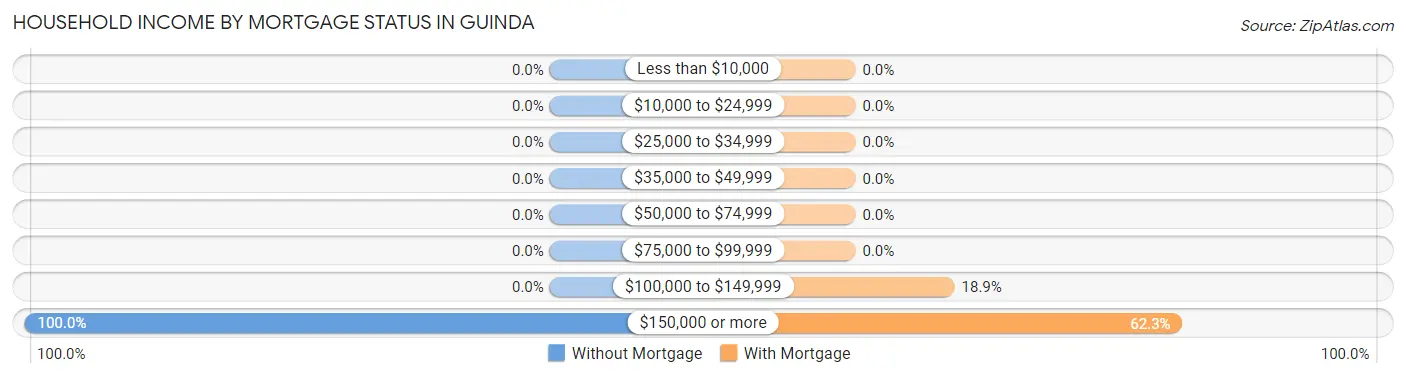
| Household Income | Without Mortgage | With Mortgage |
| Less than $10,000 | 0 (0.0%) | 0 (0.0%) |
| $10,000 to $24,999 | 0 (0.0%) | 0 (0.0%) |
| $25,000 to $34,999 | 0 (0.0%) | 0 (0.0%) |
| $35,000 to $49,999 | 0 (0.0%) | 0 (0.0%) |
| $50,000 to $74,999 | 0 (0.0%) | 0 (0.0%) |
| $75,000 to $99,999 | 0 (0.0%) | 0 (0.0%) |
| $100,000 to $149,999 | 0 (0.0%) | 10 (18.9%) |
| $150,000 or more | 16 (100.0%) | 33 (62.3%) |
| Total | 16 (100.0%) | 53 (100.0%) |
Property Value to Household Income Ratio in Guinda
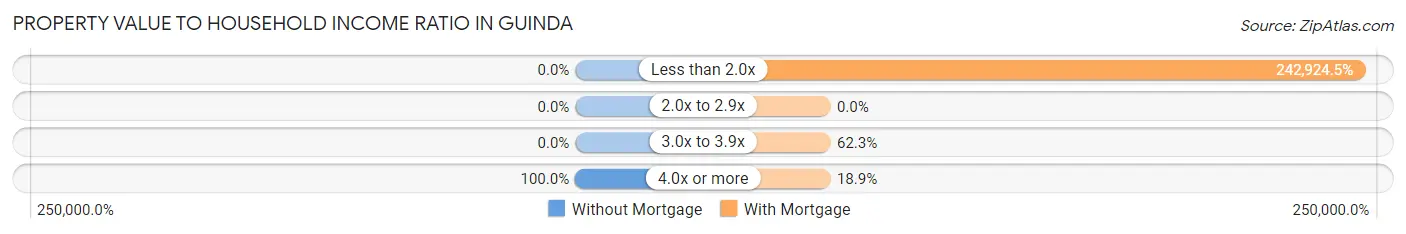
| Value-to-Income Ratio | Without Mortgage | With Mortgage |
| Less than 2.0x | 0 (0.0%) | 128,750 (242,924.5%) |
| 2.0x to 2.9x | 0 (0.0%) | 0 (0.0%) |
| 3.0x to 3.9x | 0 (0.0%) | 33 (62.3%) |
| 4.0x or more | 16 (100.0%) | 10 (18.9%) |
| Total | 16 (100.0%) | 53 (100.0%) |
Real Estate Taxes by Mortgage Status in Guinda
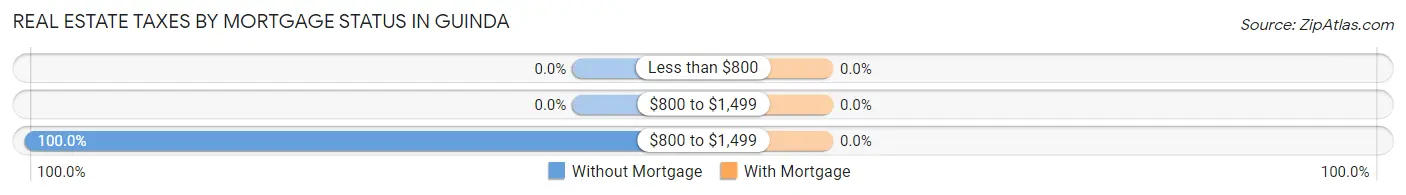
| Property Taxes | Without Mortgage | With Mortgage |
| Less than $800 | 0 (0.0%) | 0 (0.0%) |
| $800 to $1,499 | 0 (0.0%) | 0 (0.0%) |
| $800 to $1,499 | 16 (100.0%) | 0 (0.0%) |
| Total | 16 (100.0%) | 53 (100.0%) |
Health & Disability in Guinda
Health Insurance Coverage by Age in Guinda
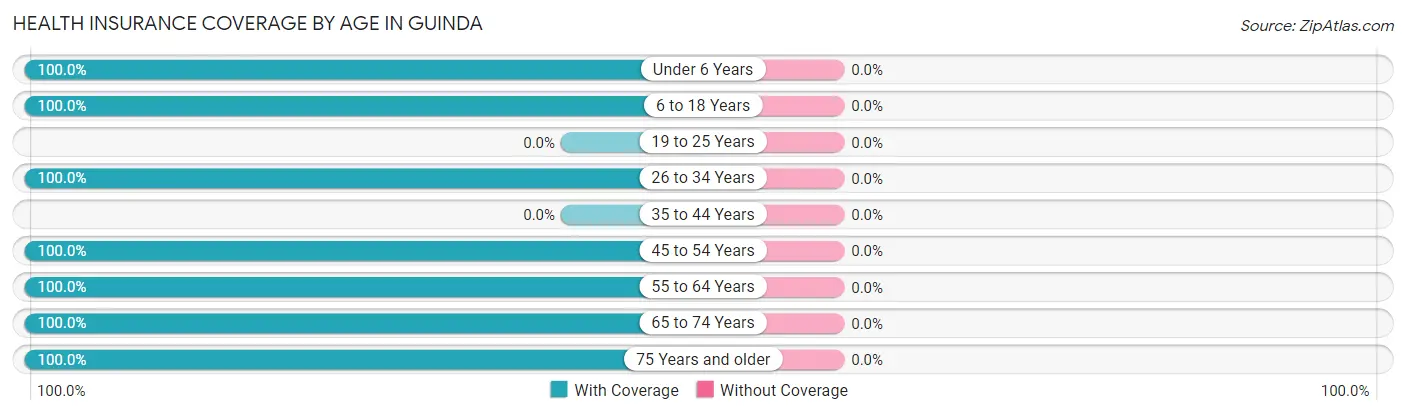
| Age Bracket | With Coverage | Without Coverage |
| Under 6 Years | 13 (100.0%) | 0 (0.0%) |
| 6 to 18 Years | 12 (100.0%) | 0 (0.0%) |
| 19 to 25 Years | 0 (0.0%) | 0 (0.0%) |
| 26 to 34 Years | 100 (100.0%) | 0 (0.0%) |
| 35 to 44 Years | 0 (0.0%) | 0 (0.0%) |
| 45 to 54 Years | 27 (100.0%) | 0 (0.0%) |
| 55 to 64 Years | 10 (100.0%) | 0 (0.0%) |
| 65 to 74 Years | 10 (100.0%) | 0 (0.0%) |
| 75 Years and older | 22 (100.0%) | 0 (0.0%) |
| Total | 194 (100.0%) | 0 (0.0%) |
Health Insurance Coverage by Citizenship Status in Guinda
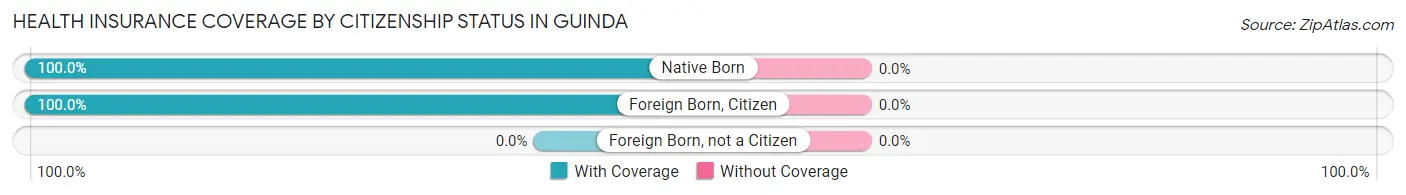
| Citizenship Status | With Coverage | Without Coverage |
| Native Born | 13 (100.0%) | 0 (0.0%) |
| Foreign Born, Citizen | 12 (100.0%) | 0 (0.0%) |
| Foreign Born, not a Citizen | 0 (0.0%) | 0 (0.0%) |
Health Insurance Coverage by Household Income in Guinda
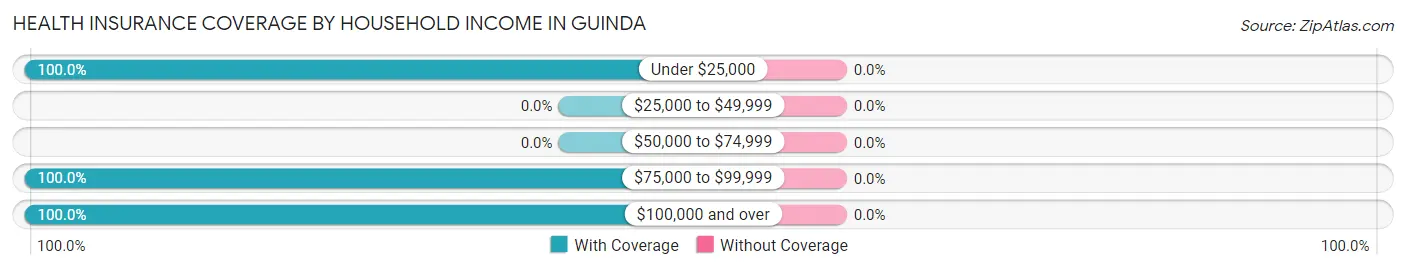
| Household Income | With Coverage | Without Coverage |
| Under $25,000 | 50 (100.0%) | 0 (0.0%) |
| $25,000 to $49,999 | 0 (0.0%) | 0 (0.0%) |
| $50,000 to $74,999 | 0 (0.0%) | 0 (0.0%) |
| $75,000 to $99,999 | 22 (100.0%) | 0 (0.0%) |
| $100,000 and over | 122 (100.0%) | 0 (0.0%) |
Public vs Private Health Insurance Coverage by Age in Guinda
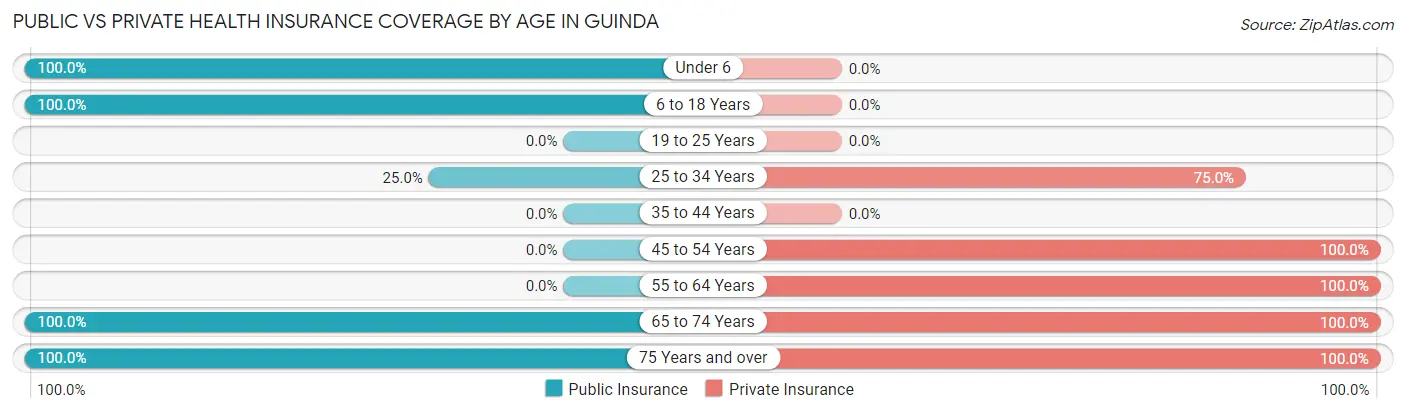
| Age Bracket | Public Insurance | Private Insurance |
| Under 6 | 13 (100.0%) | 0 (0.0%) |
| 6 to 18 Years | 12 (100.0%) | 0 (0.0%) |
| 19 to 25 Years | 0 (0.0%) | 0 (0.0%) |
| 25 to 34 Years | 25 (25.0%) | 75 (75.0%) |
| 35 to 44 Years | 0 (0.0%) | 0 (0.0%) |
| 45 to 54 Years | 0 (0.0%) | 27 (100.0%) |
| 55 to 64 Years | 0 (0.0%) | 10 (100.0%) |
| 65 to 74 Years | 10 (100.0%) | 10 (100.0%) |
| 75 Years and over | 22 (100.0%) | 22 (100.0%) |
| Total | 82 (42.3%) | 144 (74.2%) |
Disability Status by Sex by Age in Guinda
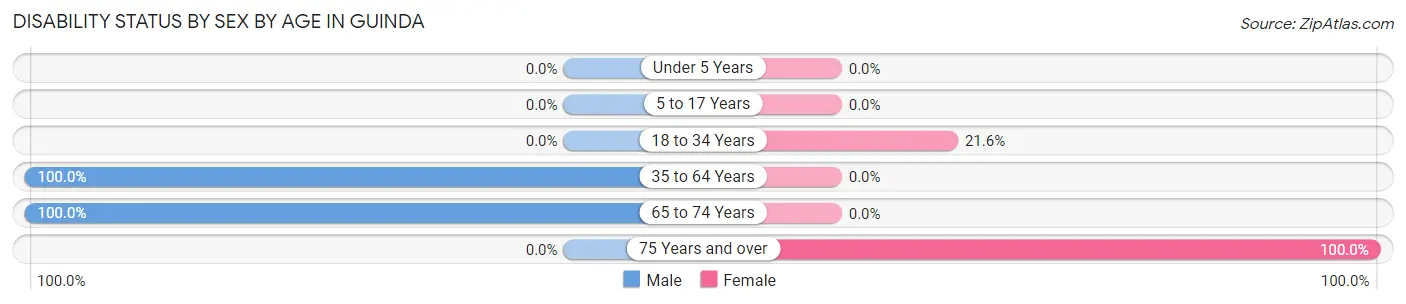
| Age Bracket | Male | Female |
| Under 5 Years | 0 (0.0%) | 0 (0.0%) |
| 5 to 17 Years | 0 (0.0%) | 0 (0.0%) |
| 18 to 34 Years | 0 (0.0%) | 11 (21.6%) |
| 35 to 64 Years | 16 (100.0%) | 0 (0.0%) |
| 65 to 74 Years | 10 (100.0%) | 0 (0.0%) |
| 75 Years and over | 0 (0.0%) | 12 (100.0%) |
Disability Class by Sex by Age in Guinda
Disability Class: Hearing Difficulty
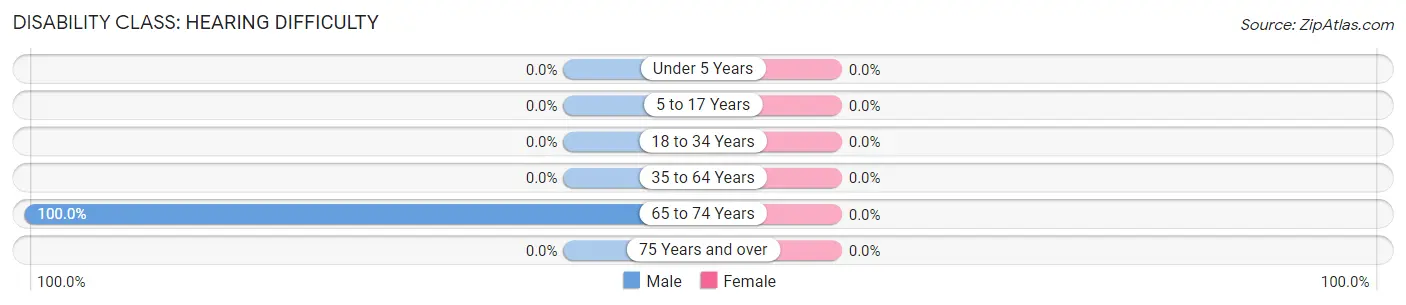
| Age Bracket | Male | Female |
| Under 5 Years | 0 (0.0%) | 0 (0.0%) |
| 5 to 17 Years | 0 (0.0%) | 0 (0.0%) |
| 18 to 34 Years | 0 (0.0%) | 0 (0.0%) |
| 35 to 64 Years | 0 (0.0%) | 0 (0.0%) |
| 65 to 74 Years | 10 (100.0%) | 0 (0.0%) |
| 75 Years and over | 0 (0.0%) | 0 (0.0%) |
Disability Class: Vision Difficulty
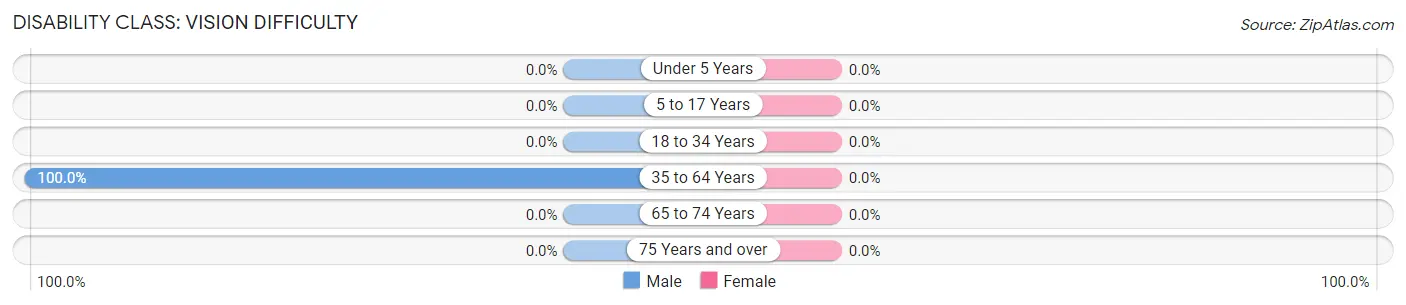
| Age Bracket | Male | Female |
| Under 5 Years | 0 (0.0%) | 0 (0.0%) |
| 5 to 17 Years | 0 (0.0%) | 0 (0.0%) |
| 18 to 34 Years | 0 (0.0%) | 0 (0.0%) |
| 35 to 64 Years | 16 (100.0%) | 0 (0.0%) |
| 65 to 74 Years | 0 (0.0%) | 0 (0.0%) |
| 75 Years and over | 0 (0.0%) | 0 (0.0%) |
Disability Class: Cognitive Difficulty
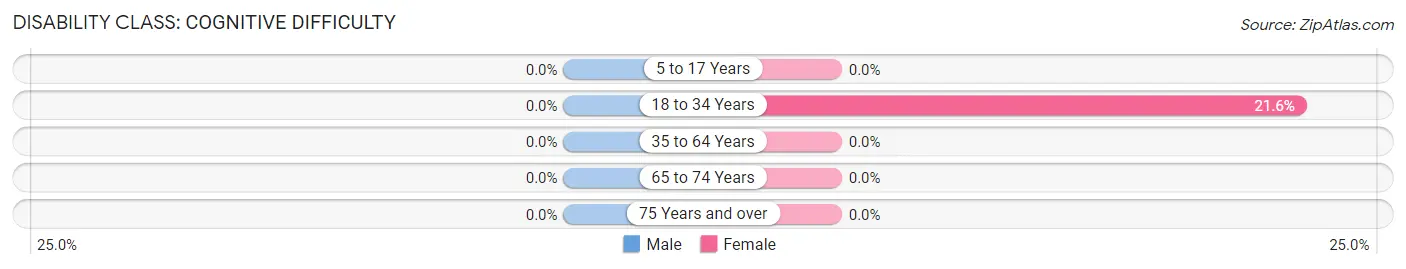
| Age Bracket | Male | Female |
| 5 to 17 Years | 0 (0.0%) | 0 (0.0%) |
| 18 to 34 Years | 0 (0.0%) | 11 (21.6%) |
| 35 to 64 Years | 0 (0.0%) | 0 (0.0%) |
| 65 to 74 Years | 0 (0.0%) | 0 (0.0%) |
| 75 Years and over | 0 (0.0%) | 0 (0.0%) |
Disability Class: Ambulatory Difficulty
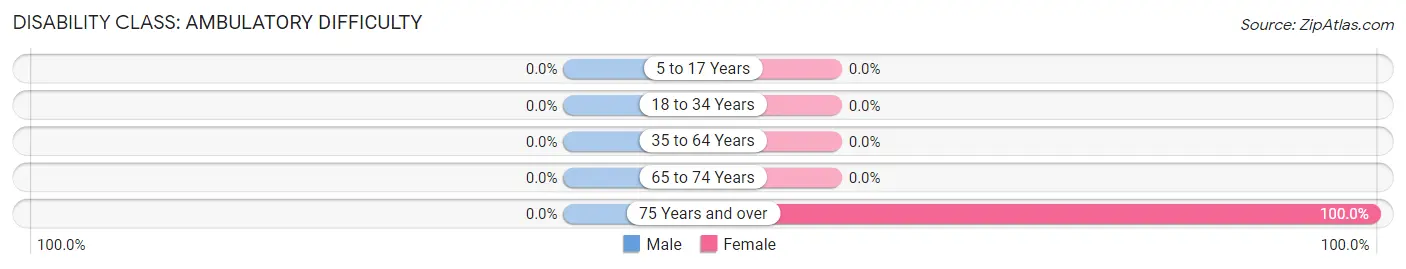
| Age Bracket | Male | Female |
| 5 to 17 Years | 0 (0.0%) | 0 (0.0%) |
| 18 to 34 Years | 0 (0.0%) | 0 (0.0%) |
| 35 to 64 Years | 0 (0.0%) | 0 (0.0%) |
| 65 to 74 Years | 0 (0.0%) | 0 (0.0%) |
| 75 Years and over | 0 (0.0%) | 12 (100.0%) |
Disability Class: Self-Care Difficulty
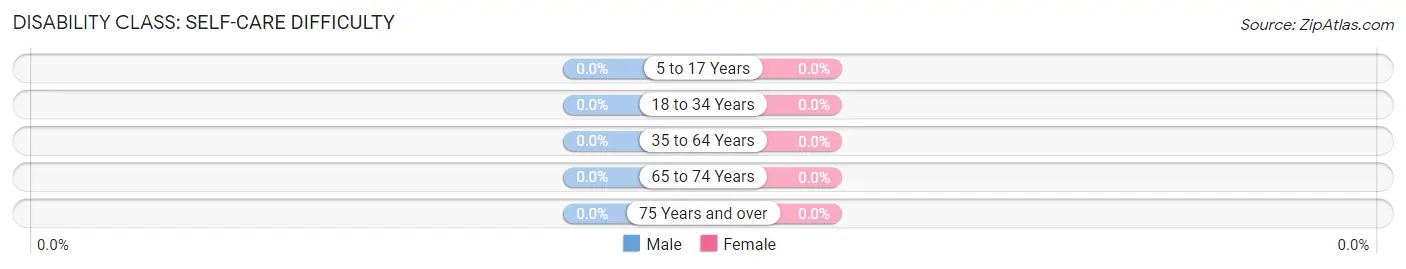
| Age Bracket | Male | Female |
| 5 to 17 Years | 0 (0.0%) | 0 (0.0%) |
| 18 to 34 Years | 0 (0.0%) | 0 (0.0%) |
| 35 to 64 Years | 0 (0.0%) | 0 (0.0%) |
| 65 to 74 Years | 0 (0.0%) | 0 (0.0%) |
| 75 Years and over | 0 (0.0%) | 0 (0.0%) |
Technology Access in Guinda
Computing Device Access in Guinda
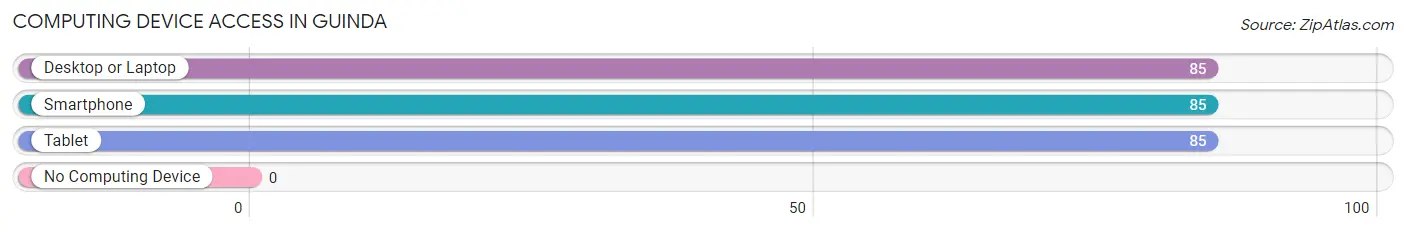
| Device Type | # Households | % Households |
| Desktop or Laptop | 85 | 100.0% |
| Smartphone | 85 | 100.0% |
| Tablet | 85 | 100.0% |
| No Computing Device | 0 | 0.0% |
| Total | 85 | 100.0% |
Internet Access in Guinda
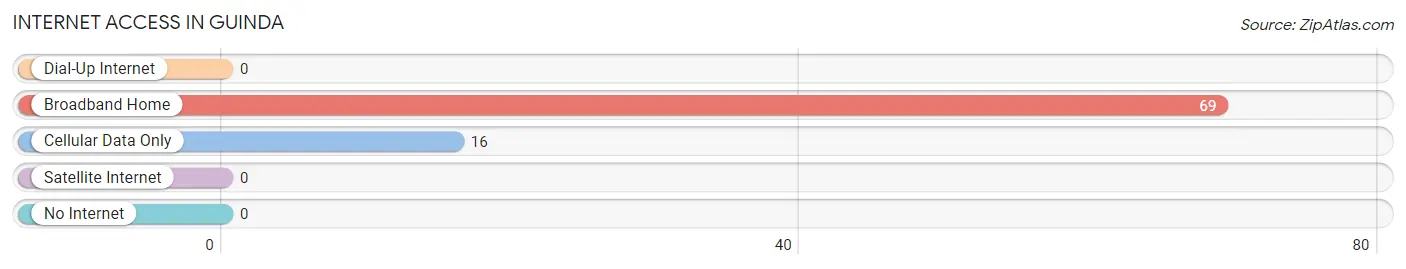
| Internet Type | # Households | % Households |
| Dial-Up Internet | 0 | 0.0% |
| Broadband Home | 69 | 81.2% |
| Cellular Data Only | 16 | 18.8% |
| Satellite Internet | 0 | 0.0% |
| No Internet | 0 | 0.0% |
| Total | 85 | 100.0% |
Guinda Summary
Guinda, California is a small unincorporated community located in Yolo County, California. It is situated in the Capay Valley, approximately 25 miles northwest of the city of Davis. The population of Guinda was estimated to be around 200 people in 2020.
Geography
Guinda is located in the Capay Valley, which is part of the Central Valley of California. The valley is surrounded by rolling hills and is home to a variety of wildlife, including deer, wild turkeys, and quail. The valley is also home to a variety of crops, including walnuts, almonds, and olives. The climate in the valley is mild, with temperatures ranging from the mid-50s in the winter to the mid-90s in the summer.
Economy
The economy of Guinda is largely based on agriculture. The valley is home to a variety of crops, including walnuts, almonds, and olives. The area is also home to a number of wineries, including the Guinda Cellars Winery. The winery produces a variety of wines, including Chardonnay, Cabernet Sauvignon, and Zinfandel.
In addition to agriculture, Guinda is home to a number of small businesses, including a gas station, a grocery store, and a post office. The town also has a number of restaurants, including the Guinda Grill and the Guinda Café.
Demographics
The population of Guinda was estimated to be around 200 people in 2020. The majority of the population is white (90%), followed by Hispanic (7%), and Asian (2%). The median household income in Guinda is $50,000, and the median home value is $400,000.
The town is served by the Esparto Unified School District, which includes Esparto Elementary School, Esparto Middle School, and Esparto High School. The town is also home to a number of churches, including the Guinda Community Church and the Guinda United Methodist Church.
Conclusion
Guinda, California is a small unincorporated community located in Yolo County, California. It is situated in the Capay Valley, approximately 25 miles northwest of the city of Davis. The population of Guinda was estimated to be around 200 people in 2020. The economy of Guinda is largely based on agriculture, with a variety of crops grown in the valley. The town is also home to a number of small businesses, including a gas station, a grocery store, and a post office. The majority of the population is white (90%), followed by Hispanic (7%), and Asian (2%). The median household income in Guinda is $50,000, and the median home value is $400,000. The town is served by the Esparto Unified School District, and is home to a number of churches.
Common Questions
What is Per Capita Income in Guinda?
Per Capita income in Guinda is $61,135.
What is the Median Family Income in Guinda?
Median Family Income in Guinda is $128,144.
What is the Median Household income in Guinda?
Median Household Income in Guinda is $128,750.
What is Inequality or Gini Index in Guinda?
Inequality or Gini Index in Guinda is 0.41.
What is the Total Population of Guinda?
Total Population of Guinda is 194.
What is the Total Male Population of Guinda?
Total Male Population of Guinda is 97.
What is the Total Female Population of Guinda?
Total Female Population of Guinda is 97.
What is the Ratio of Males per 100 Females in Guinda?
There are 100.00 Males per 100 Females in Guinda.
What is the Ratio of Females per 100 Males in Guinda?
There are 100.00 Females per 100 Males in Guinda.
What is the Median Population Age in Guinda?
Median Population Age in Guinda is 30.7 Years.
What is the Average Family Size in Guinda
Average Family Size in Guinda is 2.3 People.
What is the Average Household Size in Guinda
Average Household Size in Guinda is 2.3 People.
How Large is the Labor Force in Guinda?
There are 100 People in the Labor Forcein in Guinda.
What is the Percentage of People in the Labor Force in Guinda?
59.2% of People are in the Labor Force in Guinda.