Cities with the Highest Percentage of Population Employed in Real Estate, Rental & Leasing in North Dakota
RELATED REPORTS & OPTIONS
Real Estate, Rental & Leasing
North Dakota
Compare Cities
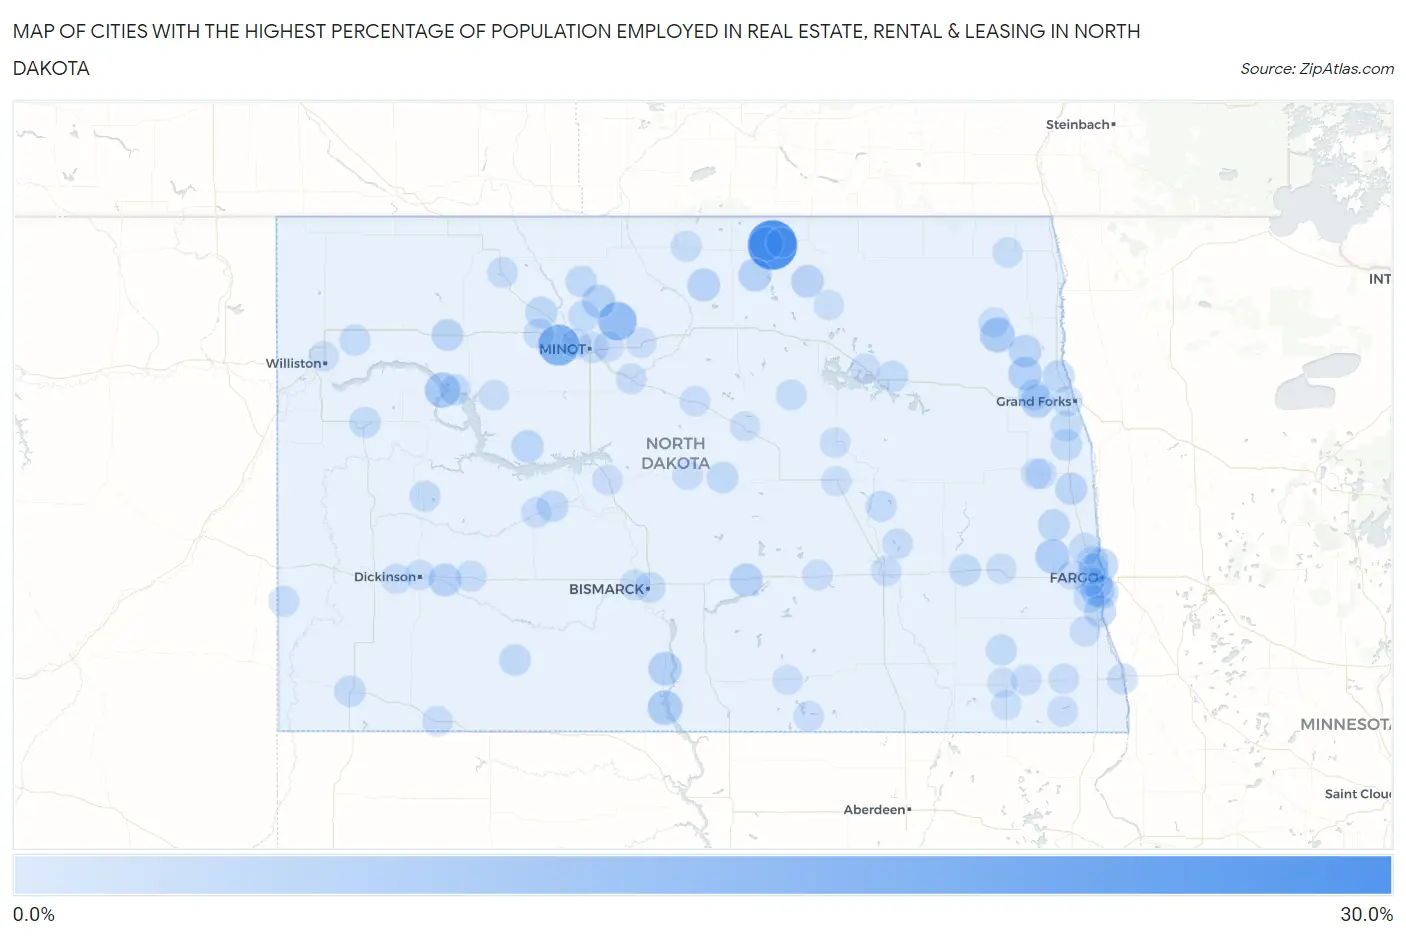
Map of Cities with the Highest Percentage of Population Employed in Real Estate, Rental & Leasing in North Dakota
0.0%
30.0%
Cities with the Highest Percentage of Population Employed in Real Estate, Rental & Leasing in North Dakota
| City | % Employed | vs State | vs National | |
| 1. | Green Acres | 29.1% | 1.1%(+28.1)#1 | 1.9%(+27.2)#70 |
| 2. | Des Lacs | 15.9% | 1.1%(+14.9)#2 | 1.9%(+14.1)#220 |
| 3. | Trenton | 13.8% | 1.1%(+12.7)#3 | 1.9%(+11.9)#288 |
| 4. | Deering | 12.2% | 1.1%(+11.2)#4 | 1.9%(+10.4)#364 |
| 5. | Four Bears Village | 7.5% | 1.1%(+6.44)#5 | 1.9%(+5.61)#931 |
| 6. | Pisek | 7.0% | 1.1%(+5.92)#6 | 1.9%(+5.09)#1,052 |
| 7. | Fort Yates | 6.7% | 1.1%(+5.61)#7 | 1.9%(+4.77)#1,127 |
| 8. | Amenia | 6.0% | 1.1%(+4.94)#8 | 1.9%(+4.11)#1,376 |
| 9. | Belcourt | 5.5% | 1.1%(+4.46)#9 | 1.9%(+3.63)#1,581 |
| 10. | North River | 5.3% | 1.1%(+4.20)#10 | 1.9%(+3.37)#1,713 |
| 11. | Gilby | 4.9% | 1.1%(+3.86)#11 | 1.9%(+3.03)#1,909 |
| 12. | Cannon Ball | 4.9% | 1.1%(+3.85)#12 | 1.9%(+3.02)#1,916 |
| 13. | Frontier | 4.9% | 1.1%(+3.84)#13 | 1.9%(+3.01)#1,921 |
| 14. | Rolette | 4.5% | 1.1%(+3.46)#14 | 1.9%(+2.63)#2,194 |
| 15. | Steele | 4.4% | 1.1%(+3.34)#15 | 1.9%(+2.51)#2,285 |
| 16. | Glenburn | 4.4% | 1.1%(+3.31)#16 | 1.9%(+2.48)#2,310 |
| 17. | Emerado | 4.3% | 1.1%(+3.27)#17 | 1.9%(+2.44)#2,348 |
| 18. | Gladstone | 4.1% | 1.1%(+3.05)#18 | 1.9%(+2.22)#2,538 |
| 19. | Willow City | 4.1% | 1.1%(+3.02)#19 | 1.9%(+2.19)#2,577 |
| 20. | Bisbee | 3.8% | 1.1%(+2.78)#20 | 1.9%(+1.95)#2,833 |
| 21. | Forest River | 3.8% | 1.1%(+2.71)#21 | 1.9%(+1.88)#2,921 |
| 22. | Briarwood | 3.2% | 1.1%(+2.16)#22 | 1.9%(+1.33)#3,725 |
| 23. | White Shield | 3.2% | 1.1%(+2.13)#23 | 1.9%(+1.30)#3,784 |
| 24. | Oxbow | 3.0% | 1.1%(+1.94)#24 | 1.9%(+1.11)#4,122 |
| 25. | Hillsboro | 2.9% | 1.1%(+1.88)#25 | 1.9%(+1.05)#4,232 |
| 26. | Ross | 2.9% | 1.1%(+1.82)#26 | 1.9%(+0.993)#4,352 |
| 27. | Manvel | 2.8% | 1.1%(+1.76)#27 | 1.9%(+0.925)#4,508 |
| 28. | Carpio | 2.7% | 1.1%(+1.61)#28 | 1.9%(+0.775)#4,875 |
| 29. | Hunter | 2.5% | 1.1%(+1.39)#29 | 1.9%(+0.562)#5,470 |
| 30. | New Leipzig | 2.4% | 1.1%(+1.29)#30 | 1.9%(+0.461)#5,803 |
| 31. | Goodrich | 2.2% | 1.1%(+1.16)#31 | 1.9%(+0.331)#6,243 |
| 32. | Valley City | 2.2% | 1.1%(+1.14)#32 | 1.9%(+0.309)#6,310 |
| 33. | Argusville | 2.1% | 1.1%(+1.09)#33 | 1.9%(+0.256)#6,505 |
| 34. | Grand Forks Afb | 2.1% | 1.1%(+1.04)#34 | 1.9%(+0.211)#6,659 |
| 35. | Reynolds | 2.1% | 1.1%(+1.03)#35 | 1.9%(+0.200)#6,703 |
| 36. | Hazen | 2.1% | 1.1%(+1.01)#36 | 1.9%(+0.179)#6,768 |
| 37. | Lansford | 2.0% | 1.1%(+0.938)#37 | 1.9%(+0.108)#7,053 |
| 38. | Bowman | 1.9% | 1.1%(+0.871)#38 | 1.9%(+0.041)#7,324 |
| 39. | Watford City | 1.9% | 1.1%(+0.840)#39 | 1.9%(+0.010)#7,440 |
| 40. | Crary | 1.8% | 1.1%(+0.757)#40 | 1.9%(-0.074)#7,775 |
| 41. | Epping | 1.8% | 1.1%(+0.693)#41 | 1.9%(-0.137)#8,032 |
| 42. | New Town | 1.7% | 1.1%(+0.618)#42 | 1.9%(-0.213)#8,393 |
| 43. | Killdeer | 1.6% | 1.1%(+0.587)#43 | 1.9%(-0.243)#8,540 |
| 44. | Lisbon | 1.6% | 1.1%(+0.524)#44 | 1.9%(-0.306)#8,839 |
| 45. | Minot Afb | 1.5% | 1.1%(+0.446)#45 | 1.9%(-0.384)#9,261 |
| 46. | Kensal | 1.4% | 1.1%(+0.377)#46 | 1.9%(-0.453)#9,621 |
| 47. | Thompson | 1.4% | 1.1%(+0.360)#47 | 1.9%(-0.470)#9,699 |
| 48. | Minot | 1.4% | 1.1%(+0.350)#48 | 1.9%(-0.480)#9,755 |
| 49. | Fargo | 1.3% | 1.1%(+0.279)#49 | 1.9%(-0.551)#10,107 |
| 50. | Bismarck | 1.3% | 1.1%(+0.266)#50 | 1.9%(-0.564)#10,173 |
| 51. | Maddock | 1.3% | 1.1%(+0.229)#51 | 1.9%(-0.601)#10,368 |
| 52. | Bottineau | 1.3% | 1.1%(+0.208)#52 | 1.9%(-0.622)#10,486 |
| 53. | Mandan | 1.2% | 1.1%(+0.093)#53 | 1.9%(-0.737)#11,139 |
| 54. | West Fargo | 1.1% | 1.1%(+0.044)#54 | 1.9%(-0.786)#11,385 |
| 55. | Wahpeton | 1.1% | 1.1%(+0.027)#55 | 1.9%(-0.803)#11,498 |
| 56. | Harwood | 1.1% | 1.1%(-0.009)#56 | 1.9%(-0.839)#11,697 |
| 57. | Golva | 1.0% | 1.1%(-0.020)#57 | 1.9%(-0.850)#11,769 |
| 58. | Velva | 1.0% | 1.1%(-0.041)#58 | 1.9%(-0.871)#11,877 |
| 59. | Grand Forks | 1.0% | 1.1%(-0.057)#59 | 1.9%(-0.887)#11,968 |
| 60. | Berthold | 1.0% | 1.1%(-0.057)#60 | 1.9%(-0.887)#11,973 |
| 61. | Reile S Acres | 0.97% | 1.1%(-0.089)#61 | 1.9%(-0.919)#12,154 |
| 62. | Spiritwood Lake | 0.95% | 1.1%(-0.109)#62 | 1.9%(-0.939)#12,275 |
| 63. | Richardton | 0.95% | 1.1%(-0.114)#63 | 1.9%(-0.944)#12,299 |
| 64. | Kenmare | 0.95% | 1.1%(-0.116)#64 | 1.9%(-0.947)#12,319 |
| 65. | Milnor | 0.94% | 1.1%(-0.123)#65 | 1.9%(-0.953)#12,367 |
| 66. | Drake | 0.93% | 1.1%(-0.136)#66 | 1.9%(-0.966)#12,429 |
| 67. | Horace | 0.92% | 1.1%(-0.138)#67 | 1.9%(-0.968)#12,436 |
| 68. | Beulah | 0.83% | 1.1%(-0.233)#68 | 1.9%(-1.06)#12,944 |
| 69. | Mayville | 0.82% | 1.1%(-0.245)#69 | 1.9%(-1.08)#13,021 |
| 70. | Medina | 0.78% | 1.1%(-0.280)#70 | 1.9%(-1.11)#13,222 |
| 71. | Wyndmere | 0.78% | 1.1%(-0.283)#71 | 1.9%(-1.11)#13,236 |
| 72. | Burlington | 0.76% | 1.1%(-0.305)#72 | 1.9%(-1.14)#13,363 |
| 73. | Hettinger | 0.76% | 1.1%(-0.305)#73 | 1.9%(-1.14)#13,365 |
| 74. | Mapleton | 0.73% | 1.1%(-0.327)#74 | 1.9%(-1.16)#13,477 |
| 75. | South Heart | 0.73% | 1.1%(-0.329)#75 | 1.9%(-1.16)#13,488 |
| 76. | Portland | 0.73% | 1.1%(-0.334)#76 | 1.9%(-1.16)#13,520 |
| 77. | Granville | 0.69% | 1.1%(-0.367)#77 | 1.9%(-1.20)#13,715 |
| 78. | Surrey | 0.69% | 1.1%(-0.376)#78 | 1.9%(-1.21)#13,767 |
| 79. | Ashley | 0.68% | 1.1%(-0.377)#79 | 1.9%(-1.21)#13,774 |
| 80. | Walcott | 0.65% | 1.1%(-0.416)#80 | 1.9%(-1.25)#13,985 |
| 81. | Parshall | 0.64% | 1.1%(-0.425)#81 | 1.9%(-1.25)#14,017 |
| 82. | Cavalier | 0.62% | 1.1%(-0.442)#82 | 1.9%(-1.27)#14,125 |
| 83. | Mcclusky | 0.60% | 1.1%(-0.459)#83 | 1.9%(-1.29)#14,218 |
| 84. | Dickinson | 0.60% | 1.1%(-0.464)#84 | 1.9%(-1.29)#14,241 |
| 85. | Lidgerwood | 0.59% | 1.1%(-0.472)#85 | 1.9%(-1.30)#14,287 |
| 86. | New Rockford | 0.58% | 1.1%(-0.478)#86 | 1.9%(-1.31)#14,333 |
| 87. | Devils Lake | 0.57% | 1.1%(-0.487)#87 | 1.9%(-1.32)#14,376 |
| 88. | Underwood | 0.57% | 1.1%(-0.492)#88 | 1.9%(-1.32)#14,410 |
| 89. | Park River | 0.57% | 1.1%(-0.493)#89 | 1.9%(-1.32)#14,418 |
| 90. | Jamestown | 0.54% | 1.1%(-0.525)#90 | 1.9%(-1.35)#14,592 |
| 91. | Tower City | 0.52% | 1.1%(-0.546)#91 | 1.9%(-1.38)#14,706 |
| 92. | Wishek | 0.45% | 1.1%(-0.610)#92 | 1.9%(-1.44)#15,058 |
| 93. | Carrington | 0.43% | 1.1%(-0.627)#93 | 1.9%(-1.46)#15,135 |
| 94. | Gwinner | 0.42% | 1.1%(-0.644)#94 | 1.9%(-1.47)#15,225 |
| 95. | Harvey | 0.37% | 1.1%(-0.696)#95 | 1.9%(-1.53)#15,441 |
| 96. | Williston | 0.36% | 1.1%(-0.702)#96 | 1.9%(-1.53)#15,472 |
| 97. | Cando | 0.35% | 1.1%(-0.716)#97 | 1.9%(-1.55)#15,534 |
| 98. | Forman | 0.34% | 1.1%(-0.725)#98 | 1.9%(-1.56)#15,571 |
| 99. | Rolla | 0.22% | 1.1%(-0.838)#99 | 1.9%(-1.67)#15,942 |
Common Questions
What are the Top 10 Cities with the Highest Percentage of Population Employed in Real Estate, Rental & Leasing in North Dakota?
Top 10 Cities with the Highest Percentage of Population Employed in Real Estate, Rental & Leasing in North Dakota are:
#1
29.1%
#2
15.9%
#3
12.2%
#4
7.5%
#5
7.0%
#6
6.7%
#7
6.0%
#8
5.5%
#9
5.3%
#10
4.9%
What city has the Highest Percentage of Population Employed in Real Estate, Rental & Leasing in North Dakota?
Green Acres has the Highest Percentage of Population Employed in Real Estate, Rental & Leasing in North Dakota with 29.1%.
What is the Percentage of Population Employed in Real Estate, Rental & Leasing in the State of North Dakota?
Percentage of Population Employed in Real Estate, Rental & Leasing in North Dakota is 1.1%.
What is the Percentage of Population Employed in Real Estate, Rental & Leasing in the United States?
Percentage of Population Employed in Real Estate, Rental & Leasing in the United States is 1.9%.