Cities with the Highest Percentage of Population Employed in Real Estate, Rental & Leasing in Nebraska
RELATED REPORTS & OPTIONS
Real Estate, Rental & Leasing
Nebraska
Compare Cities
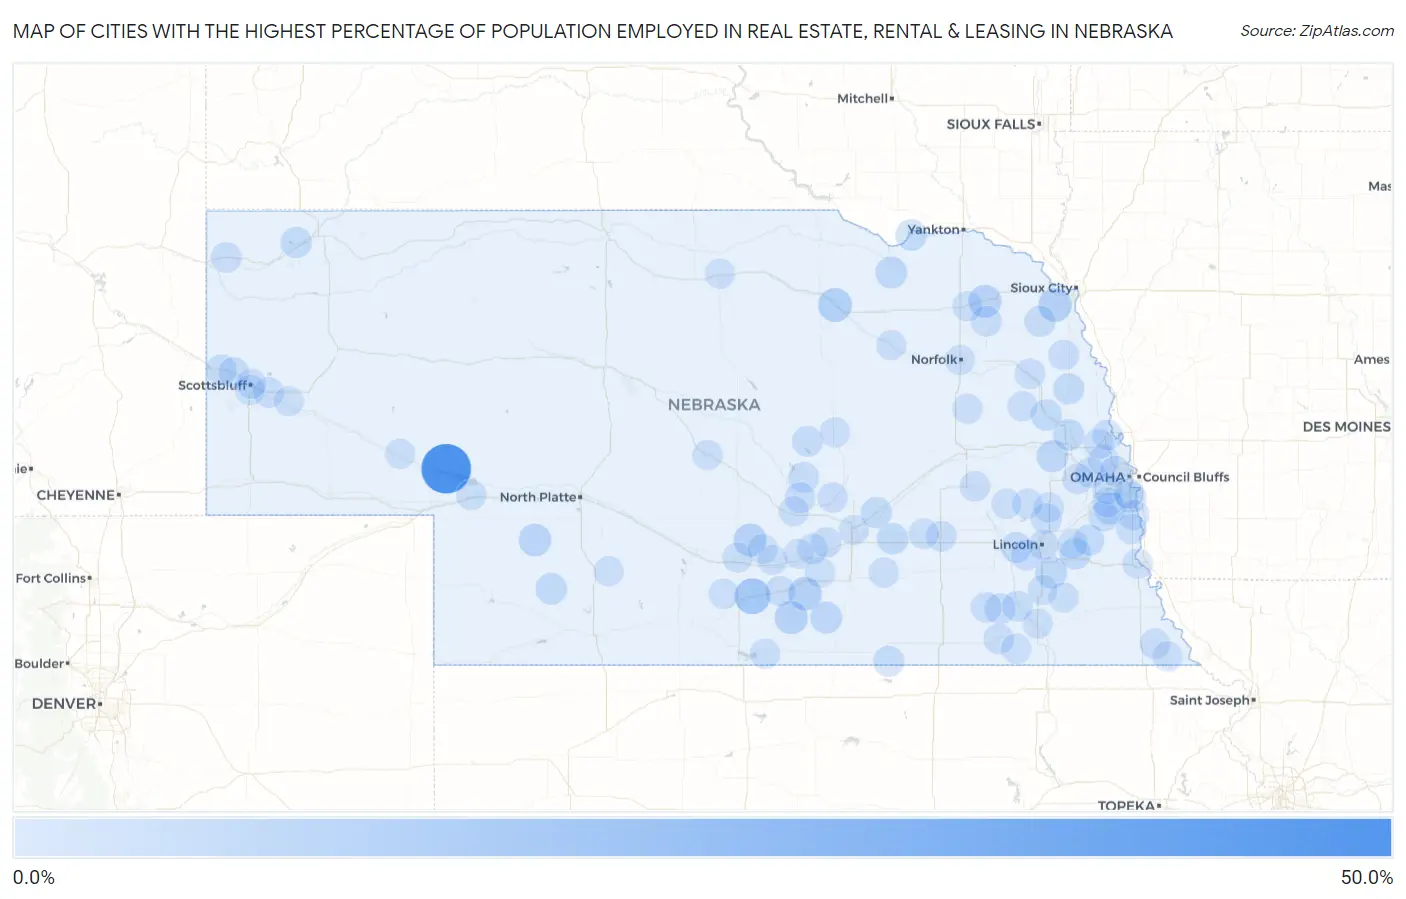
Map of Cities with the Highest Percentage of Population Employed in Real Estate, Rental & Leasing in Nebraska
0.0%
50.0%
Cities with the Highest Percentage of Population Employed in Real Estate, Rental & Leasing in Nebraska
| City | % Employed | vs State | vs National | |
| 1. | Belmar | 48.5% | 1.2%(+47.3)#1 | 1.9%(+46.6)#26 |
| 2. | Funk | 14.3% | 1.2%(+13.1)#2 | 1.9%(+12.4)#270 |
| 3. | Inman | 9.8% | 1.2%(+8.57)#3 | 1.9%(+7.86)#563 |
| 4. | Hubbard | 8.7% | 1.2%(+7.51)#4 | 1.9%(+6.80)#693 |
| 5. | Norman | 8.7% | 1.2%(+7.51)#5 | 1.9%(+6.80)#694 |
| 6. | Upland | 8.2% | 1.2%(+7.04)#6 | 1.9%(+6.33)#774 |
| 7. | Amherst | 7.4% | 1.2%(+6.18)#7 | 1.9%(+5.48)#959 |
| 8. | Belden | 7.2% | 1.2%(+6.06)#8 | 1.9%(+5.35)#980 |
| 9. | Wallace | 6.9% | 1.2%(+5.69)#9 | 1.9%(+4.98)#1,082 |
| 10. | Cheney | 6.6% | 1.2%(+5.41)#10 | 1.9%(+4.70)#1,156 |
| 11. | Cedar Bluffs | 5.4% | 1.2%(+4.24)#11 | 1.9%(+3.53)#1,623 |
| 12. | Verdigre | 5.2% | 1.2%(+4.00)#12 | 1.9%(+3.29)#1,761 |
| 13. | Bladen | 5.0% | 1.2%(+3.82)#13 | 1.9%(+3.11)#1,862 |
| 14. | Hickman | 4.8% | 1.2%(+3.64)#14 | 1.9%(+2.93)#1,981 |
| 15. | Hayes Center | 4.5% | 1.2%(+3.28)#15 | 1.9%(+2.57)#2,244 |
| 16. | Woodland Hills | 4.4% | 1.2%(+3.22)#16 | 1.9%(+2.51)#2,287 |
| 17. | Cedar Creek | 4.2% | 1.2%(+3.02)#17 | 1.9%(+2.31)#2,438 |
| 18. | Nickerson | 4.0% | 1.2%(+2.86)#18 | 1.9%(+2.15)#2,615 |
| 19. | Aurora | 3.9% | 1.2%(+2.75)#19 | 1.9%(+2.04)#2,732 |
| 20. | Santee | 3.9% | 1.2%(+2.71)#20 | 1.9%(+2.00)#2,774 |
| 21. | Scribner | 3.7% | 1.2%(+2.47)#21 | 1.9%(+1.76)#3,082 |
| 22. | Chapman | 3.6% | 1.2%(+2.45)#22 | 1.9%(+1.74)#3,110 |
| 23. | Whitney | 3.3% | 1.2%(+2.15)#23 | 1.9%(+1.44)#3,527 |
| 24. | Oakland | 3.3% | 1.2%(+2.07)#24 | 1.9%(+1.36)#3,669 |
| 25. | Elmwood | 3.3% | 1.2%(+2.07)#25 | 1.9%(+1.36)#3,682 |
| 26. | Morrill | 2.9% | 1.2%(+1.75)#26 | 1.9%(+1.04)#4,260 |
| 27. | Emerson | 2.8% | 1.2%(+1.61)#27 | 1.9%(+0.897)#4,573 |
| 28. | Ashton | 2.7% | 1.2%(+1.52)#28 | 1.9%(+0.811)#4,783 |
| 29. | Swanton | 2.7% | 1.2%(+1.48)#29 | 1.9%(+0.775)#4,876 |
| 30. | Superior | 2.7% | 1.2%(+1.47)#30 | 1.9%(+0.761)#4,923 |
| 31. | North Loup | 2.6% | 1.2%(+1.38)#31 | 1.9%(+0.672)#5,174 |
| 32. | Pleasant Dale | 2.5% | 1.2%(+1.35)#32 | 1.9%(+0.640)#5,263 |
| 33. | Mitchell | 2.5% | 1.2%(+1.33)#33 | 1.9%(+0.620)#5,302 |
| 34. | Davey | 2.5% | 1.2%(+1.32)#34 | 1.9%(+0.608)#5,345 |
| 35. | Offutt Afb | 2.5% | 1.2%(+1.28)#35 | 1.9%(+0.574)#5,432 |
| 36. | De Witt | 2.4% | 1.2%(+1.26)#36 | 1.9%(+0.547)#5,525 |
| 37. | Carroll | 2.4% | 1.2%(+1.18)#37 | 1.9%(+0.470)#5,779 |
| 38. | Bennington | 2.3% | 1.2%(+1.07)#38 | 1.9%(+0.366)#6,114 |
| 39. | Western | 2.2% | 1.2%(+1.06)#39 | 1.9%(+0.355)#6,159 |
| 40. | Denton | 2.2% | 1.2%(+1.06)#40 | 1.9%(+0.355)#6,162 |
| 41. | Wood River | 2.2% | 1.2%(+1.06)#41 | 1.9%(+0.352)#6,171 |
| 42. | York | 2.2% | 1.2%(+1.04)#42 | 1.9%(+0.329)#6,248 |
| 43. | Harrison | 2.2% | 1.2%(+1.01)#43 | 1.9%(+0.306)#6,325 |
| 44. | Rockville | 2.1% | 1.2%(+0.944)#44 | 1.9%(+0.236)#6,586 |
| 45. | Rosalie | 2.1% | 1.2%(+0.922)#45 | 1.9%(+0.214)#6,652 |
| 46. | Verdon | 2.1% | 1.2%(+0.871)#46 | 1.9%(+0.163)#6,832 |
| 47. | Plattsmouth | 2.0% | 1.2%(+0.811)#47 | 1.9%(+0.103)#7,072 |
| 48. | Beemer | 2.0% | 1.2%(+0.788)#48 | 1.9%(+0.080)#7,179 |
| 49. | Minden | 1.9% | 1.2%(+0.758)#49 | 1.9%(+0.050)#7,283 |
| 50. | Shelton | 1.9% | 1.2%(+0.750)#50 | 1.9%(+0.042)#7,320 |
| 51. | Rising City | 1.9% | 1.2%(+0.740)#51 | 1.9%(+0.031)#7,365 |
| 52. | Yutan | 1.9% | 1.2%(+0.726)#52 | 1.9%(+0.018)#7,408 |
| 53. | Jansen | 1.8% | 1.2%(+0.635)#53 | 1.9%(-0.074)#7,776 |
| 54. | Louisville | 1.8% | 1.2%(+0.575)#54 | 1.9%(-0.133)#8,008 |
| 55. | Waterloo | 1.7% | 1.2%(+0.529)#55 | 1.9%(-0.179)#8,210 |
| 56. | Chalco | 1.7% | 1.2%(+0.510)#56 | 1.9%(-0.198)#8,321 |
| 57. | Minatare | 1.7% | 1.2%(+0.478)#57 | 1.9%(-0.230)#8,474 |
| 58. | Omaha | 1.6% | 1.2%(+0.451)#58 | 1.9%(-0.257)#8,606 |
| 59. | Ogallala | 1.6% | 1.2%(+0.425)#59 | 1.9%(-0.283)#8,731 |
| 60. | Dannebrog | 1.6% | 1.2%(+0.379)#60 | 1.9%(-0.329)#8,964 |
| 61. | Blair | 1.6% | 1.2%(+0.375)#61 | 1.9%(-0.334)#8,985 |
| 62. | Ceresco | 1.5% | 1.2%(+0.323)#62 | 1.9%(-0.385)#9,271 |
| 63. | Kennard | 1.5% | 1.2%(+0.315)#63 | 1.9%(-0.394)#9,306 |
| 64. | Broken Bow | 1.5% | 1.2%(+0.313)#64 | 1.9%(-0.395)#9,313 |
| 65. | Valparaiso | 1.5% | 1.2%(+0.303)#65 | 1.9%(-0.405)#9,364 |
| 66. | Eagle | 1.5% | 1.2%(+0.294)#66 | 1.9%(-0.414)#9,407 |
| 67. | Murray | 1.5% | 1.2%(+0.294)#67 | 1.9%(-0.414)#9,409 |
| 68. | Bradshaw | 1.4% | 1.2%(+0.255)#68 | 1.9%(-0.453)#9,619 |
| 69. | Nebraska City | 1.4% | 1.2%(+0.240)#69 | 1.9%(-0.469)#9,691 |
| 70. | Diller | 1.4% | 1.2%(+0.225)#70 | 1.9%(-0.483)#9,771 |
| 71. | Riverdale | 1.4% | 1.2%(+0.215)#71 | 1.9%(-0.493)#9,816 |
| 72. | Gering | 1.4% | 1.2%(+0.196)#72 | 1.9%(-0.513)#9,917 |
| 73. | Harvard | 1.4% | 1.2%(+0.181)#73 | 1.9%(-0.527)#9,982 |
| 74. | Randolph | 1.4% | 1.2%(+0.178)#74 | 1.9%(-0.530)#9,996 |
| 75. | Greeley Center | 1.4% | 1.2%(+0.168)#75 | 1.9%(-0.540)#10,046 |
| 76. | Ravenna | 1.3% | 1.2%(+0.164)#76 | 1.9%(-0.544)#10,070 |
| 77. | Springfield | 1.3% | 1.2%(+0.155)#77 | 1.9%(-0.554)#10,117 |
| 78. | Curtis | 1.3% | 1.2%(+0.150)#78 | 1.9%(-0.558)#10,144 |
| 79. | Neligh | 1.3% | 1.2%(+0.125)#79 | 1.9%(-0.583)#10,266 |
| 80. | Creston | 1.3% | 1.2%(+0.115)#80 | 1.9%(-0.593)#10,324 |
| 81. | Naponee | 1.3% | 1.2%(+0.115)#81 | 1.9%(-0.593)#10,325 |
| 82. | Bassett | 1.3% | 1.2%(+0.111)#82 | 1.9%(-0.597)#10,345 |
| 83. | Gibbon | 1.3% | 1.2%(+0.100)#83 | 1.9%(-0.608)#10,405 |
| 84. | Kenesaw | 1.3% | 1.2%(+0.095)#84 | 1.9%(-0.613)#10,440 |
| 85. | Falls City | 1.3% | 1.2%(+0.089)#85 | 1.9%(-0.620)#10,473 |
| 86. | Norfolk | 1.3% | 1.2%(+0.088)#86 | 1.9%(-0.620)#10,474 |
| 87. | Scottsbluff | 1.3% | 1.2%(+0.081)#87 | 1.9%(-0.628)#10,519 |
| 88. | Grand Island | 1.3% | 1.2%(+0.073)#88 | 1.9%(-0.635)#10,563 |
| 89. | Bayard | 1.2% | 1.2%(+0.046)#89 | 1.9%(-0.662)#10,711 |
| 90. | Loomis | 1.2% | 1.2%(+0.014)#90 | 1.9%(-0.694)#10,906 |
| 91. | Dwight | 1.2% | 1.2%(+0.014)#91 | 1.9%(-0.694)#10,908 |
| 92. | Lincoln | 1.2% | 1.2%(+0.003)#92 | 1.9%(-0.705)#10,967 |
| 93. | Elm Creek | 1.2% | 1.2%(-0.003)#93 | 1.9%(-0.711)#10,994 |
| 94. | Kearney | 1.2% | 1.2%(-0.008)#94 | 1.9%(-0.716)#11,025 |
| 95. | Oshkosh | 1.2% | 1.2%(-0.011)#95 | 1.9%(-0.719)#11,036 |
| 96. | Beatrice | 1.2% | 1.2%(-0.015)#96 | 1.9%(-0.723)#11,059 |
| 97. | Bellevue | 1.2% | 1.2%(-0.023)#97 | 1.9%(-0.731)#11,109 |
| 98. | Adams | 1.1% | 1.2%(-0.034)#98 | 1.9%(-0.742)#11,167 |
| 99. | Dodge | 1.1% | 1.2%(-0.034)#99 | 1.9%(-0.742)#11,168 |
| 100. | Cortland | 1.1% | 1.2%(-0.043)#100 | 1.9%(-0.751)#11,214 |
Common Questions
What are the Top 10 Cities with the Highest Percentage of Population Employed in Real Estate, Rental & Leasing in Nebraska?
Top 10 Cities with the Highest Percentage of Population Employed in Real Estate, Rental & Leasing in Nebraska are:
What city has the Highest Percentage of Population Employed in Real Estate, Rental & Leasing in Nebraska?
Belmar has the Highest Percentage of Population Employed in Real Estate, Rental & Leasing in Nebraska with 48.5%.
What is the Percentage of Population Employed in Real Estate, Rental & Leasing in the State of Nebraska?
Percentage of Population Employed in Real Estate, Rental & Leasing in Nebraska is 1.2%.
What is the Percentage of Population Employed in Real Estate, Rental & Leasing in the United States?
Percentage of Population Employed in Real Estate, Rental & Leasing in the United States is 1.9%.