Cities with the Highest Percentage of Population Employed in Real Estate, Rental & Leasing in Tennessee
RELATED REPORTS & OPTIONS
Real Estate, Rental & Leasing
Tennessee
Compare Cities
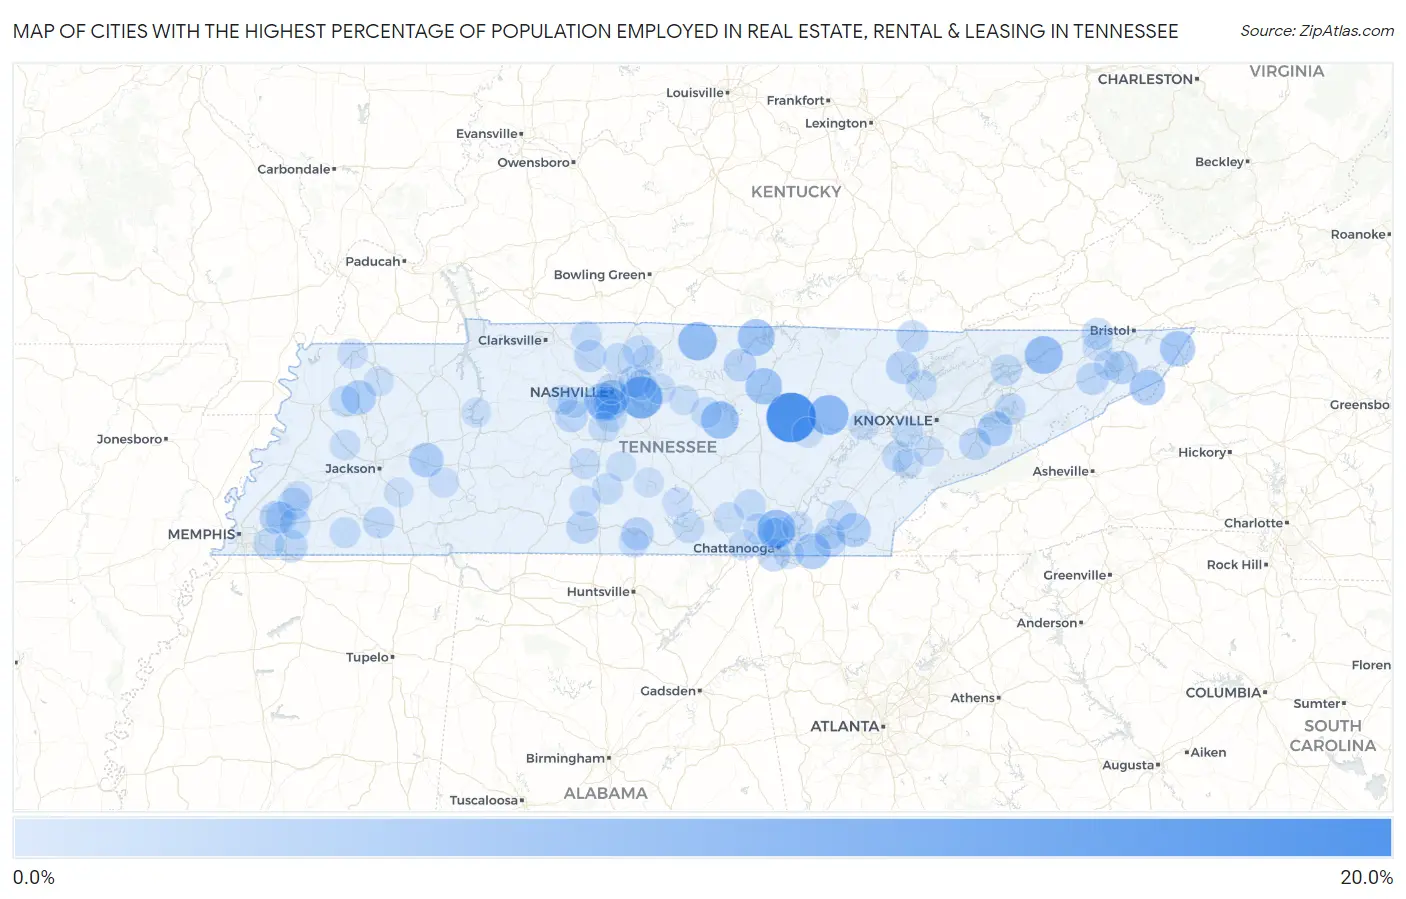
Map of Cities with the Highest Percentage of Population Employed in Real Estate, Rental & Leasing in Tennessee
0.0%
20.0%
Cities with the Highest Percentage of Population Employed in Real Estate, Rental & Leasing in Tennessee
| City | % Employed | vs State | vs National | |
| 1. | Pleasant Hill | 18.4% | 1.7%(+16.7)#1 | 1.9%(+16.5)#172 |
| 2. | Coker Creek | 16.7% | 1.7%(+14.9)#2 | 1.9%(+14.8)#203 |
| 3. | Rural Hill | 11.9% | 1.7%(+10.2)#3 | 1.9%(+10.1)#378 |
| 4. | Blanche | 11.0% | 1.7%(+9.27)#4 | 1.9%(+9.12)#442 |
| 5. | Fairfield Glade | 9.9% | 1.7%(+8.21)#5 | 1.9%(+8.05)#546 |
| 6. | Lafayette | 9.0% | 1.7%(+7.25)#6 | 1.9%(+7.09)#654 |
| 7. | Fairmount | 8.5% | 1.7%(+6.74)#7 | 1.9%(+6.58)#727 |
| 8. | Rogersville | 8.4% | 1.7%(+6.71)#8 | 1.9%(+6.55)#735 |
| 9. | Smithville | 8.1% | 1.7%(+6.38)#9 | 1.9%(+6.22)#805 |
| 10. | Celina | 7.5% | 1.7%(+5.72)#10 | 1.9%(+5.56)#941 |
| 11. | Algood | 7.2% | 1.7%(+5.50)#11 | 1.9%(+5.34)#982 |
| 12. | Belle Meade | 7.1% | 1.7%(+5.36)#12 | 1.9%(+5.20)#1,023 |
| 13. | Apison | 6.7% | 1.7%(+4.92)#13 | 1.9%(+4.76)#1,133 |
| 14. | Mayland | 6.5% | 1.7%(+4.74)#14 | 1.9%(+4.58)#1,198 |
| 15. | Mountain City | 6.3% | 1.7%(+4.59)#15 | 1.9%(+4.43)#1,242 |
| 16. | Roan Mountain | 6.3% | 1.7%(+4.55)#16 | 1.9%(+4.39)#1,253 |
| 17. | Berry Hill | 5.8% | 1.7%(+4.08)#17 | 1.9%(+3.92)#1,451 |
| 18. | Fairgarden | 5.8% | 1.7%(+4.06)#18 | 1.9%(+3.91)#1,461 |
| 19. | Lexington | 5.6% | 1.7%(+3.88)#19 | 1.9%(+3.72)#1,541 |
| 20. | Rutherford | 5.5% | 1.7%(+3.78)#20 | 1.9%(+3.62)#1,587 |
| 21. | Benton | 5.4% | 1.7%(+3.65)#21 | 1.9%(+3.49)#1,648 |
| 22. | Russellville | 4.9% | 1.7%(+3.14)#22 | 1.9%(+2.99)#1,934 |
| 23. | Biltmore | 4.7% | 1.7%(+3.01)#23 | 1.9%(+2.85)#2,027 |
| 24. | Oak Hill | 4.7% | 1.7%(+2.97)#24 | 1.9%(+2.81)#2,059 |
| 25. | Central | 4.7% | 1.7%(+2.95)#25 | 1.9%(+2.80)#2,068 |
| 26. | Lakeland | 4.6% | 1.7%(+2.90)#26 | 1.9%(+2.75)#2,111 |
| 27. | Caryville | 4.5% | 1.7%(+2.74)#27 | 1.9%(+2.59)#2,222 |
| 28. | Lookout Mountain | 4.2% | 1.7%(+2.49)#28 | 1.9%(+2.34)#2,422 |
| 29. | Fayetteville | 4.2% | 1.7%(+2.47)#29 | 1.9%(+2.31)#2,441 |
| 30. | Gainesboro | 4.1% | 1.7%(+2.40)#30 | 1.9%(+2.24)#2,514 |
| 31. | Pulaski | 4.0% | 1.7%(+2.31)#31 | 1.9%(+2.15)#2,625 |
| 32. | Piperton | 4.0% | 1.7%(+2.30)#32 | 1.9%(+2.14)#2,631 |
| 33. | Green Hill | 3.9% | 1.7%(+2.20)#33 | 1.9%(+2.04)#2,736 |
| 34. | Forest Hills | 3.9% | 1.7%(+2.16)#34 | 1.9%(+2.00)#2,770 |
| 35. | Telford | 3.9% | 1.7%(+2.15)#35 | 1.9%(+1.99)#2,789 |
| 36. | Fairview | 3.8% | 1.7%(+2.08)#36 | 1.9%(+1.92)#2,859 |
| 37. | Coopertown | 3.8% | 1.7%(+2.02)#37 | 1.9%(+1.86)#2,941 |
| 38. | Pigeon Forge | 3.7% | 1.7%(+1.97)#38 | 1.9%(+1.82)#2,998 |
| 39. | Jellico | 3.6% | 1.7%(+1.87)#39 | 1.9%(+1.71)#3,146 |
| 40. | Braden | 3.6% | 1.7%(+1.86)#40 | 1.9%(+1.70)#3,168 |
| 41. | Wildwood Lake | 3.5% | 1.7%(+1.73)#41 | 1.9%(+1.57)#3,331 |
| 42. | Walden | 3.4% | 1.7%(+1.69)#42 | 1.9%(+1.53)#3,388 |
| 43. | Arlington | 3.3% | 1.7%(+1.57)#43 | 1.9%(+1.41)#3,581 |
| 44. | Bloomingdale | 3.3% | 1.7%(+1.55)#44 | 1.9%(+1.39)#3,599 |
| 45. | Hornsby | 3.3% | 1.7%(+1.54)#45 | 1.9%(+1.39)#3,618 |
| 46. | Baneberry | 3.3% | 1.7%(+1.53)#46 | 1.9%(+1.37)#3,651 |
| 47. | Signal Mountain | 3.2% | 1.7%(+1.48)#47 | 1.9%(+1.32)#3,750 |
| 48. | Cottontown | 3.2% | 1.7%(+1.43)#48 | 1.9%(+1.27)#3,826 |
| 49. | Winchester | 3.1% | 1.7%(+1.41)#49 | 1.9%(+1.25)#3,864 |
| 50. | Palmer | 3.1% | 1.7%(+1.35)#50 | 1.9%(+1.19)#3,954 |
| 51. | Tellico Village | 3.1% | 1.7%(+1.33)#51 | 1.9%(+1.17)#3,992 |
| 52. | Brentwood | 3.1% | 1.7%(+1.33)#52 | 1.9%(+1.17)#3,997 |
| 53. | Yorkville | 3.0% | 1.7%(+1.31)#53 | 1.9%(+1.16)#4,029 |
| 54. | Millersville | 3.0% | 1.7%(+1.31)#54 | 1.9%(+1.16)#4,030 |
| 55. | Oakland | 3.0% | 1.7%(+1.31)#55 | 1.9%(+1.16)#4,033 |
| 56. | Bean Station | 3.0% | 1.7%(+1.30)#56 | 1.9%(+1.15)#4,057 |
| 57. | Powells Crossroads | 3.0% | 1.7%(+1.24)#57 | 1.9%(+1.09)#4,162 |
| 58. | Norris | 3.0% | 1.7%(+1.22)#58 | 1.9%(+1.06)#4,219 |
| 59. | Lewisburg | 2.9% | 1.7%(+1.22)#59 | 1.9%(+1.06)#4,220 |
| 60. | Kingston Springs | 2.9% | 1.7%(+1.16)#60 | 1.9%(+1.00)#4,332 |
| 61. | Germantown | 2.9% | 1.7%(+1.16)#61 | 1.9%(+1.00)#4,338 |
| 62. | Columbia | 2.8% | 1.7%(+1.11)#62 | 1.9%(+0.958)#4,427 |
| 63. | Farragut | 2.8% | 1.7%(+1.08)#63 | 1.9%(+0.923)#4,520 |
| 64. | Finley | 2.8% | 1.7%(+1.07)#64 | 1.9%(+0.912)#4,541 |
| 65. | Dowelltown | 2.8% | 1.7%(+1.04)#65 | 1.9%(+0.886)#4,587 |
| 66. | Lebanon | 2.8% | 1.7%(+1.04)#66 | 1.9%(+0.880)#4,603 |
| 67. | Hickory Valley | 2.7% | 1.7%(+0.968)#67 | 1.9%(+0.811)#4,785 |
| 68. | East Cleveland | 2.7% | 1.7%(+0.936)#68 | 1.9%(+0.779)#4,857 |
| 69. | Lynnville | 2.7% | 1.7%(+0.932)#69 | 1.9%(+0.775)#4,872 |
| 70. | Jasper | 2.6% | 1.7%(+0.884)#70 | 1.9%(+0.726)#5,018 |
| 71. | Cedar Hill | 2.6% | 1.7%(+0.856)#71 | 1.9%(+0.699)#5,085 |
| 72. | Alamo | 2.6% | 1.7%(+0.856)#72 | 1.9%(+0.698)#5,086 |
| 73. | Harriman | 2.6% | 1.7%(+0.839)#73 | 1.9%(+0.682)#5,145 |
| 74. | Nashville | 2.5% | 1.7%(+0.796)#74 | 1.9%(+0.639)#5,266 |
| 75. | Greenback | 2.5% | 1.7%(+0.785)#75 | 1.9%(+0.628)#5,288 |
| 76. | Franklin | 2.5% | 1.7%(+0.729)#76 | 1.9%(+0.572)#5,436 |
| 77. | Cosby | 2.5% | 1.7%(+0.724)#77 | 1.9%(+0.567)#5,449 |
| 78. | Lake Tansi | 2.5% | 1.7%(+0.723)#78 | 1.9%(+0.566)#5,458 |
| 79. | Tracy City | 2.5% | 1.7%(+0.718)#79 | 1.9%(+0.561)#5,473 |
| 80. | Mount Juliet | 2.4% | 1.7%(+0.709)#80 | 1.9%(+0.552)#5,497 |
| 81. | Scotts Hill | 2.4% | 1.7%(+0.678)#81 | 1.9%(+0.521)#5,601 |
| 82. | Union City | 2.4% | 1.7%(+0.676)#82 | 1.9%(+0.519)#5,607 |
| 83. | Gallatin | 2.4% | 1.7%(+0.647)#83 | 1.9%(+0.490)#5,696 |
| 84. | Tullahoma | 2.3% | 1.7%(+0.600)#84 | 1.9%(+0.443)#5,851 |
| 85. | Charleston | 2.3% | 1.7%(+0.591)#85 | 1.9%(+0.434)#5,885 |
| 86. | Maryville | 2.3% | 1.7%(+0.539)#86 | 1.9%(+0.381)#6,048 |
| 87. | East Ridge | 2.3% | 1.7%(+0.531)#87 | 1.9%(+0.374)#6,084 |
| 88. | Lakesite | 2.3% | 1.7%(+0.529)#88 | 1.9%(+0.372)#6,095 |
| 89. | Park City | 2.3% | 1.7%(+0.521)#89 | 1.9%(+0.364)#6,122 |
| 90. | Mason | 2.3% | 1.7%(+0.519)#90 | 1.9%(+0.362)#6,128 |
| 91. | White Bluff | 2.2% | 1.7%(+0.509)#91 | 1.9%(+0.352)#6,170 |
| 92. | Sharon | 2.2% | 1.7%(+0.498)#92 | 1.9%(+0.340)#6,204 |
| 93. | Chapel Hill | 2.2% | 1.7%(+0.442)#93 | 1.9%(+0.285)#6,411 |
| 94. | Watertown | 2.2% | 1.7%(+0.428)#94 | 1.9%(+0.270)#6,462 |
| 95. | Delano | 2.1% | 1.7%(+0.411)#95 | 1.9%(+0.254)#6,512 |
| 96. | Shelbyville | 2.1% | 1.7%(+0.391)#96 | 1.9%(+0.234)#6,595 |
| 97. | New Johnsonville | 2.1% | 1.7%(+0.356)#97 | 1.9%(+0.199)#6,709 |
| 98. | Johnson City | 2.1% | 1.7%(+0.338)#98 | 1.9%(+0.181)#6,763 |
| 99. | Colonial Heights | 2.1% | 1.7%(+0.336)#99 | 1.9%(+0.179)#6,770 |
| 100. | Henderson | 2.0% | 1.7%(+0.282)#100 | 1.9%(+0.125)#6,976 |
Common Questions
What are the Top 10 Cities with the Highest Percentage of Population Employed in Real Estate, Rental & Leasing in Tennessee?
Top 10 Cities with the Highest Percentage of Population Employed in Real Estate, Rental & Leasing in Tennessee are:
#1
18.4%
#2
11.9%
#3
9.9%
#4
9.0%
#5
8.5%
#6
8.4%
#7
8.1%
#8
7.5%
#9
7.2%
#10
7.1%
What city has the Highest Percentage of Population Employed in Real Estate, Rental & Leasing in Tennessee?
Pleasant Hill has the Highest Percentage of Population Employed in Real Estate, Rental & Leasing in Tennessee with 18.4%.
What is the Percentage of Population Employed in Real Estate, Rental & Leasing in the State of Tennessee?
Percentage of Population Employed in Real Estate, Rental & Leasing in Tennessee is 1.7%.
What is the Percentage of Population Employed in Real Estate, Rental & Leasing in the United States?
Percentage of Population Employed in Real Estate, Rental & Leasing in the United States is 1.9%.